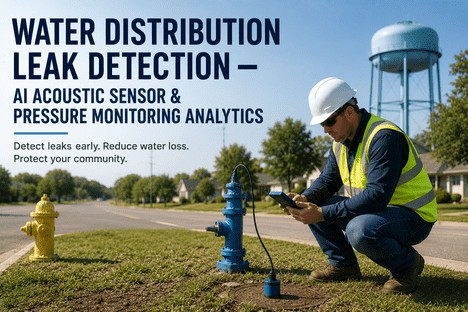
Water Distribution Leak Detection — AI Acoustic Sensor & Pressure Monitoring Analytics
By Grace on June 19, 2026
Every water distribution network leaks. The question is not whether leaks exist but how long they remain undetected before they surface as visible main breaks, customer complaints, or unbudgeted repair costs. Utility managers responsible for distribution systems oversee networks that span hundreds to thousands of miles of pipe — most of it buried, most of it installed before 1980, and most of it leaking at a rate that the utility has never been able to measure with precision. A 0.5 gallon-per-minute leak that goes undetected for six months wastes 130,000 gallons of treated water — enough to supply a household for a full year — and the leak noise is present in the pipe from day one. AI acoustic sensing combined with pressure monitoring analytics detects leaks at the earliest audible stage, correlates pressure anomalies with acoustic events to confirm and locate the leak, and provides utility managers with a quantified leakage map of their entire distribution system without deploying a single ground-listening crew. This is the utility manager's guide to deploying it.
AI Acoustic Sensing · Pressure Zone Analytics · Predictive Leak Localization · Non-Revenue Water Reduction
The Average Water Utility Loses 20% of Its Treated Water to Leaks. AI Acoustic Detection Finds the Ones That Have Been Running for Months Before They Surface.
iFactory's AI acoustic leak detection and pressure monitoring platform gives utility managers continuous surveillance across the entire distribution network — detecting leaks as small as 0.5 GPM, locating them within meters, and forecasting main break risk before the pipe fails — without sending a single crew on a listening survey.
Water main breaks occur annually in the US and Canada — one break every two minutes — costing $2.6 billion per year in repair and service disruption costs
19.5%
Of treated drinking water is lost to non-revenue water before reaching customers — representing $6.4 billion in annual uncaptured revenue across US water utilities
6.75B
Gallons of treated drinking water are lost daily in the US — enough to supply the annual needs of more than 20 million households
$452B
Estimated cost to replace aging water mains in the US and Canada — nearly 20% of installed mains are beyond their useful life and have not been replaced
The Leak Escalation Path: From Micro-Leak to Catastrophic Main Break
Water distribution leaks do not appear suddenly as main breaks. They develop through a progression of stages that can span months or years — and at every stage before the final one, the leak is detectable through acoustic sensing and pressure monitoring. Understanding this path is essential for building a business case for continuous monitoring: the cost of detecting a Stage 1 micro-leak is a fraction of the cost of repairing a Stage 4 catastrophic break, but most utilities do not have the instrumentation to detect any stage before the water surfaces.
01
Micro-Leak
0.5–2 GPM
Pinhole leak or hairline crack in pipe wall. No surface water. No pressure drop visible at zone level. Acoustic signature present but masked by normal flow noise to human hearing. AI acoustic filters isolate the leak frequency from ambient noise.
AI detects at Stage 1
02
Developing Leak
2–10 GPM
Crack propagates or joint seal deteriorates. Water migrates into surrounding soil. Acoustic signal strengthens. Pressure may show minor fluctuation at district metered area level. Soil saturation begins but no surface expression. Visible only through acoustic correlation and pressure anomaly analysis.
AI detects at Stage 2
03
Significant Leak
10–50 GPM
Large volume loss. Pressure drop detectable at the zone level. Water may reach surface as wet spot or small flow. Emergency repair crew dispatched. Pipe structural integrity is compromised. Corrosion or joint failure is accelerating. Repairs during this stage cost 3–5x planned rehabilitation.
Reactive response
04
Main Break
100–500+ GPM
Catastrophic pipe failure. High-volume water discharge floods roadway, damages adjacent infrastructure, causes service outages to customers. Emergency repair required. Road closure, traffic disruption, property damage claims. Repair cost: $10,000–$50,000 per event plus indirect costs 3–5x that amount.
Emergency only
A 2 GPM leak running for 6 months wastes 157,000 gallons and creates $8,000+ in lost revenue and energy cost — and is detectable by AI acoustic sensors on the day it starts.
Cost to repair at Stage 1: $0 (scheduled). At Stage 4: $10K–50K+ emergency.
A Single Undetected 5 GPM Leak Wastes 2.6 Million Gallons Per Year — and Creates a Pressure Anomaly That AI Can Detect Within 24 Hours of Deployment.
iFactory's AI acoustic and pressure monitoring platform detects leaks at Stage 1 — before water surfaces, before pressure drops are visible to operators, before the repair cost escalates from scheduled to emergency. Every day the leak runs undetected costs water, energy, and pipe life.
Leak Detection Methods Compared: Why AI Acoustic Plus Pressure Monitoring Changes the Detection Equation
Utility managers evaluating leak detection technology have three distinct approaches available. Each has a different cost profile, coverage capacity, detection sensitivity, and time-to-detection. Understanding the trade-offs is essential for designing a leak detection programme that matches the utility's pipe inventory, budget, and loss reduction targets — and for building the internal business case for AI-based continuous monitoring over periodic manual survey methods.
Method 01
Periodic Manual Acoustic Survey
Ground-listening crews walk or drive the distribution network with listening sticks, ground microphones, and noise correlators. Coverage is limited by crew availability. Typical survey frequency: once every 1–3 years. Detection depends on operator experience and ambient noise conditions. Leaks in high-traffic areas or deep mains are frequently missed. Cost per mile surveyed is moderate but total network coverage is low because crews cannot cover the full system within budget constraints.
Coverage10–20% of network per year
Min. leak size3–5 GPM (variable)
Time to detectionMonths to years
Method 02
Fixed Acoustic Logger Network
Permanent acoustic loggers installed on fire hydrants or valves at 200–500 meter intervals. Loggers record noise levels during low-flow nighttime hours and upload data for correlation analysis. Provides continuous surveillance of logged areas. Detection sensitivity is higher than manual survey but loggers cannot distinguish leak noise from regular flow noise without human analysis. Large networks generate thousands of noise recordings per night requiring dedicated analyst time to review.
Coverage40–60% of network (logged areas)
Min. leak size1–3 GPM (night only)
Time to detectionDays to weeks
Method 03 — iFactory
AI Acoustic + Pressure Monitoring
Permanent acoustic sensors and pressure transducers deployed at strategic nodes. AI filters isolate leak frequencies from ambient and flow noise automatically. Pressure anomaly detection correlates pressure drops with acoustic events to confirm leaks and eliminate false positives. Machine learning models differentiate between leak types, estimate flow rate, and track trend over time. Detection is continuous, 24/7, and does not require analyst review — the platform alerts the utility manager only when a confirmed leak is detected.
Coverage100% of monitored zones
Min. leak size0.5 GPM
Time to detectionHours
The Four Zones of the Distribution Network — and How Leaks Manifest Differently in Each
A water distribution network is not a homogeneous system. Different pipe materials, diameters, operating pressures, and flow conditions exist in each zone, and leaks behave differently depending on where they occur. An acoustic detection system that works well in a high-pressure transmission main may not detect leaks in a low-pressure residential distribution line without algorithm tuning. The iFactory platform segments the network into four operational zones and applies zone-specific acoustic and pressure analytics calibrated to each zone's characteristics.
T
Transmission Mains — High Flow, High Pressure
Large-diameter pipes (16–60 inches) carrying treated water from treatment plants to distribution storage. Operating pressures: 60–120 PSI. Leaks here are high-volume events that cause rapid pressure drops detectable across broad areas. Acoustic signal propagates long distances, enabling correlation between widely spaced sensors. AI pressure analytics detect these leaks within minutes of onset through zone-level pressure anomaly detection. Burst risk is elevated in steel and PCCP mains where corrosion weakens structural integrity over decades of service.
AI approach: Pressure transient detection + long-baseline acoustic correlation.
D
Distribution Mains — Medium Flow, Variable Pressure
The largest pipe category by length: 6–16 inch diameter pipes delivering water to residential, commercial, and industrial customers. Operating pressures range from 40–80 PSI with diurnal variation. Leaks in this zone are the most common source of non-revenue water loss. Cast iron pipes installed 1940–1980 dominate this zone and fail through corrosion, joint degradation, and graphitization. AI acoustic sensors deployed at hydrants or valve boxes detect leaks by isolating frequency signatures associated with escaping water from normal flow noise.
AI approach: Night-time minimum flow analysis + acoustic frequency fingerprinting.
S
Service Connections — Low Flow, Customer-Side Risk
Service lines from the distribution main to the customer meter. Typically 0.75–2 inch diameter copper, galvanized steel, or HDPE. Operating pressures: 40–80 PSI. Leaks here are small (0.5–3 GPM) but numerous and often undetected for years because the water may not surface. Lead service lines in this zone are also subject to replacement mandates under the EPA Lead and Copper Rule, making leak detection during replacement planning a dual-purpose opportunity. AI acoustic sensors at the meter or curb stop detect service line leaks by listening at the point of connection.
Elevated storage tanks, ground storage reservoirs, and booster pumping stations create pressure zone boundaries within the distribution system. Leaks at these points are often related to tank overflow, valve leakage, or pump seal failure — loss volumes can be large because flow is unconstrained. AI pressure monitoring at zone boundary points detects pressure anomalies that indicate tank level control issues, valve failures, or unexpected demand patterns that may mask leakage in the downstream zone.
AI approach: Zone boundary pressure + flow balance analytics for DMA-level leakage quantification.
The iFactory AI Leak Detection Platform: Three Capabilities That Transform Distribution System Management
The iFactory platform integrates acoustic sensing, pressure monitoring, and network analytics into a single continuous surveillance system. Utility managers deploy sensors across transmission and distribution zones, and the platform converts raw acoustic and pressure data into actionable leak intelligence — without requiring dedicated analyst staff to interpret noise recordings. Three capabilities define the platform's operational value.
Capability 01
AI Acoustic Classification & Automated Leak Localization
The AI engine processes acoustic signals from permanently deployed sensors and classifies each sound event by type — escaping water, normal flow, hydrant operation, pump noise, traffic rumble, or environmental interference. Leak-correlated acoustic events are isolated using trained frequency and amplitude profiles specific to each pipe material and diameter. When multiple sensors detect the same leak, the system calculates the leak location using time-of-arrival correlation between sensor pairs. Location accuracy is typically within 1–3 meters in well-instrumented zones, enabling the repair crew to dig directly over the leak rather than excavating a trench to investigate.
94–99% leak detection accuracy documented in peer-reviewed studies using ML classification of acoustic data.
Capability 02
Pressure Zone Monitoring & Leak-Pressure Correlation
Pressure transducers at district metered area boundaries, zone inlet points, and critical nodes monitor pressure continuously. The AI platform learns normal pressure patterns for each zone — daily cycles, seasonal variations, and demand-driven fluctuations — and flags deviations that correlate with leak events. A pressure drop that coincides with an acoustic detection provides confirmation that the acoustic event is a real leak rather than a false positive from non-leak noise sources. The pressure data also quantifies the leak's flow impact: the magnitude of pressure drop correlates with leak flow rate, giving the utility manager an estimate of loss volume without installing a separate flow meter at the leak site.
Pressure-leak correlation eliminates 90%+ of false positives from acoustic-only detection systems.
Capability 03
Leak Trend Tracking & Main Break Risk Forecasting
Every detected leak is tracked across its lifecycle — first detection, estimated flow rate, acoustic signature evolution, pressure impact trend, and repair outcome. For leaks that are not immediately repaired (small leaks in non-critical zones), the platform monitors whether the leak is stable, growing, or accelerating. Accelerating leaks — where flow rate increases by more than 20% month-over-month or acoustic signature changes pattern — are flagged for priority repair before they escalate to main breaks. Historical break data combined with pipe age, material, pressure history, and soil corrosivity feeds a main break risk model that forecasts which pipe segments have the highest probability of failure within the next 12–24 months.
Utilities using AI trend-based prioritisation reduce main break frequency by 25–40%.
What the Leak Detection Dashboard Shows the Utility Manager
The utility manager's dashboard is designed for a single purpose: converting raw acoustic and pressure data into clear repair priorities that the maintenance team can act on immediately. Six dashboard views deliver the information needed to manage leakage as a measurable, reducible operational metric rather than an unavoidable cost of doing business.
View 01
Live Leak Map — Confirmed Leaks by Location and Flow Rate
A GIS-based map of the distribution network showing every confirmed leak as a colour-coded marker — green for stable leaks under 2 GPM, amber for developing leaks 2–10 GPM, red for significant leaks 10–50 GPM, and purple for priority leaks above 50 GPM. Each marker displays the estimated flow rate, detection date, acoustic correlation quality score, and recommended repair timeframe. Utility managers see the full leakage picture at a glance and dispatch repair crews to the highest-impact leaks first — not to the leaks that happen to be reported by customer calls.
Utility manager action: Dispatch crew to purple and red markers first. Green leaks scheduled for next planned maintenance cycle.
View 02
DMA Water Balance — Real Loss Quantification by Pressure Zone
Each district metered area displays a live water balance: total flow into the zone, minimum night flow, estimated customer consumption, and calculated real loss. The real loss component is compared against the economic leakage level — the point at which the cost of further leak detection exceeds the value of water saved. Zones operating above the economic level are flagged for intensified detection effort. The water balance trends over time to show whether leakage reduction efforts are effective, stable, or losing ground.
Utility manager action: Zones above economic leakage level receive priority for additional sensor deployment and intensified survey.
View 03
Acoustic Event Feed — Every Sound, Classified and Prioritised
A continuous feed of acoustic events detected across the network, each classified by the AI engine into categories: confirmed leak, potential leak, hydrant operation, pump event, flow noise, or environmental interference. Confirmed leaks appear at the top of the feed with the sensor pair that detected it, the correlation location, the estimated flow rate, and the confidence score. Potential leaks — events that have an acoustic signature consistent with leakage but insufficient sensor coverage to confirm — are flagged for follow-up survey deployment.
Utility manager action: Review confirmed leaks daily. Deploy mobile survey to potential leak locations with insufficient sensor density.
View 04
Leak Trend & Escalation Tracker — Flow Rate Over Time by Leak
Every detected leak is plotted on a flow rate over time trend chart. Stable leaks show a flat or slightly declining line. Escalating leaks show a rising slope that accelerates as pipe deterioration progresses. Utility managers use this view to differentiate between leaks that can be deferred to the next scheduled repair cycle and leaks that require immediate intervention to prevent a main break. The trend view also displays the cumulative volume of water lost since detection — providing the economic justification for each repair decision.
Utility manager action: Escalating trend over two consecutive monitoring cycles triggers accelerated repair priority.
View 05
NRR Reporting — AWWA Water Audit-Ready Data
The platform generates real loss data in the format required for AWWA Free Water Audit Software (v6.1) input — quantified real loss volume by DMA, minimum night flow trends, and leakage by pipe material and age category. Utility managers preparing their annual water audit export the leakage data directly from the dashboard without manual compilation from work order records and flow meter logs. The audit data also populates the Infrastructure Leakage Index calculation, giving utilities a standardised performance metric comparable across the industry.
Utility manager action: Export AWWA-compatible water audit data on demand. No manual data compilation required.
View 06
Main Break Risk Forecast — Pipe Segments Ranked by Failure Probability
A pipe segment risk model ranks every segment in the distribution network by the probability of failure within the forecast horizon — typically 6, 12, or 24 months. The model uses pipe material, age, break history, acoustic leak frequency at nearby locations, pressure fluctuation range, soil corrosivity data, and cathodic protection status where available. Segments in the top 5% of risk are flagged for condition assessment or replacement planning. The forecast is updated as new acoustic and pressure data is acquired, so the risk ranking reflects current operating conditions rather than a static depreciation curve.
Utility manager action: Top-risk segments advance to capital replacement planning. Medium-risk segments scheduled for condition assessment.
"
We had been doing manual acoustic surveys once a year covering maybe 30% of our network. The survey would find 15 to 20 leaks per cycle, and we thought that was acceptable coverage. We deployed fixed AI acoustic sensors with pressure monitoring across our three highest-loss DMA zones — about 40% of the system. In the first month, the platform detected 27 confirmed leaks that had never been found by any manual survey. Twelve of those had estimated flow rates above 5 GPM and had been running for an estimated 6 to 18 months based on the soil saturation patterns observed during excavation. The total annual water savings from the first month's detected leaks was 48 million gallons. The platform paid for itself in lost water reduction within the first quarter.
— Utility Manager, Mid-Sized Municipal Water Utility — 42,000 Service Connections, 520 Miles of Distribution Main
Conclusion
Water distribution leakage is not a problem that can be solved with more frequent manual surveys or better maintenance alone. The fundamental constraint is visibility: a buried pipe network that spans hundreds of miles cannot be monitored for leaks by ground-listening crews operating on annual schedules that cover a fraction of the system each cycle. By the time a leak is detected through traditional methods — customer complaint, surfaced water, visible pressure drop — it has already been running for weeks or months and has caused water loss, energy waste, and pipe damage that could have been prevented with continuous monitoring.
The economic case for AI acoustic and pressure monitoring is built on arithmetic that applies to every utility. A 2 GPM leak running undetected for one year wastes 1,051,200 gallons — worth approximately $10,000 in production cost and lost revenue depending on local water rates. A single AI sensor deployment covering 2 miles of distribution main costs a fraction of that annual leak loss and detects leaks continuously for the life of the sensor. When the average American water utility loses 19.5% of its treated water — 6.75 billion gallons daily across the national network — to leaks that are detectable by sensors that exist today, the gap between available technology and deployed technology is the single largest opportunity in water infrastructure management.
iFactory's AI acoustic detection and pressure monitoring platform is designed for utility managers who need to reduce non-revenue water, prevent main breaks, and build a quantified leak management programme — without hiring an acoustic analyst or sending crews on listening surveys. Book a Demo to see the AI leak detection system configured for your distribution network and DMA zones, or talk to an expert about a free leak detection pilot covering up to three district metered areas in your utility.
Frequently Asked Questions
The AI model is trained on labelled datasets that include leak sounds from controlled release tests and field-confirmed leaks alongside non-leak sounds from hydrant operations, pump stations, irrigation systems, and normal customer demand flow. Each sound event is decomposed into frequency-domain features — spectral centroid, bandwidth, harmonic content, and temporal pattern — that the model uses to classify the source. Leak sounds have a characteristic broadband frequency profile with energy concentrated in specific ranges determined by pipe material, diameter, and pressure. Hydrant flushing produces a distinct temporal pattern: sudden onset, steady flow, and abrupt cessation. Irrigation demand follows diurnal cycles that the model learns over time. The AI also cross-references acoustic classifications with pressure data: a potential leak detected by acoustic sensors that coincides with a pressure drop at the zone boundary is classified as confirmed, while a potential leak with no corresponding pressure anomaly is flagged for follow-up but not elevated to a repair dispatch. This dual-sensor correlation eliminates the false positive problem that limits the operational value of acoustic-only detection systems. Talk to an expert about the training dataset for your pipe material and diameter mix.
Optimal acoustic sensor spacing depends on pipe material, diameter, and background noise levels. For typical distribution mains (6–12 inch diameter cast iron, ductile iron, or PVC), acoustic sensors are deployed at 200 to 400 meter intervals along the pipe route, typically mounted on fire hydrants, valve boxes, or direct-tap connections. In high-noise urban environments with heavy traffic or multiple utility corridors, spacing is reduced to 150–250 meters to maintain detection sensitivity. For transmission mains (16 inch and above), acoustic signals propagate longer distances — 400 to 800 meter spacing is feasible — and pressure transducers are the primary detection sensor for high-volume leaks and bursts. For service areas where plastic pipe (PVC, HDPE) dominates, acoustic sensors are deployed at shorter intervals (100–200 meters) because plastic pipes dampen acoustic propagation compared to metallic pipes. The platform's deployment planning tool calculates the optimal sensor placement for each zone based on pipe material, diameter, background noise, and target minimum leak size. A typical first-phase deployment covers the highest-loss DMA zones with 30–60% of the network instrumented, achieving 60–80% of total leakage reduction potential by focusing on the areas where most real loss occurs. Book a Demo to see the sensor placement optimiser for your network configuration.
iFactory's integration layer supports standard industrial protocols including Modbus, OPC-UA, and MQTT for SCADA connectivity, and API-based integration with AMI head-end systems and asset management platforms. Pressure data from existing SCADA transducers can be ingested directly into the pressure monitoring analytics without deploying additional sensors, reducing the hardware cost for utilities that already have zone-level pressure monitoring in place. Acoustic sensor data flows through the iFactory cloud platform or on-premises edge gateway, and processed leak alerts are pushed to the SCADA alarm system, work order management platform, and utility manager dashboard simultaneously. For utilities using AWWA Free Water Audit Software, the platform exports real loss data in the format required for annual water audit submission. The integration architecture is designed to add leak detection capability to existing utility systems without replacing or duplicating current monitoring infrastructure. Talk to an expert about integration requirements with your current SCADA and asset management platforms.
ROI is calculated from three quantified benefit streams: (1) recovered water value — the cost of treating and pumping the water that was previously lost to undetected leaks, valued at the utility's variable production cost per gallon; (2) avoided emergency repair costs — the difference between scheduled leak repair and emergency main break repair, typically 5:1 to 10:1 cost ratio; and (3) reduced energy consumption — the energy saved from not pumping water that leaks out before reaching customers, which can represent 15–20% of total pumping energy in high-loss zones. Deployment cost includes acoustic sensors, pressure transducers, gateway hardware, installation, and platform subscription. Most utilities achieve full payback within 4 to 8 months from the date of deployment, based on documented results from comparable installations. The primary variable affecting ROI is the pre-deployment real loss level in the target DMA zones: utilities with minimum night flow exceeding 30% of average daily flow typically achieve the fastest payback because the volume of recoverable water is highest. The platform includes a built-in ROI calculator that uses the utility's actual production cost, water rate, and DMA minimum night flow data to project payback before deployment. Book a Demo to generate a site-specific ROI projection for your utility's distribution network.
The Leaks You Cannot Hear Are Costing Millions in Lost Water. Get a Free AI Leak Detection Pilot for Three DMA Zones in Your Utility.
iFactory's AI acoustic detection and pressure monitoring platform delivers continuous leak surveillance across the entire distribution network — detecting leaks as small as 0.5 GPM, locating them within meters, and forecasting main break risk — without requiring dedicated analyst staff or ground-listening crews. Full integration with SCADA, AMI, and asset management systems. AWWA-compatible water audit data exported automatically.