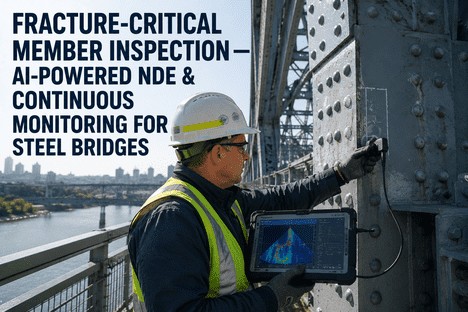
Bridge Fatigue Cracking AASHTO Detail Category Analysis Methods

By Grace on June 18, 2026

bridge-fatigue-cracking-aashto-detail-category

A steel bridge girder can accumulate millions of stress cycles in a single year of service. Each passing truck adds a small increment of cyclic load to every welded connection, cover plate end, and stiffener detail along the span. The steel itself does not yield under these loads — the nominal stresses are often below 30% of the yield strength. But over decades of repeated loading, microscopic discontinuities at weld toes, cope holes, and attachment points grow into detectable fatigue cracks that, if left unaddressed, can propagate through the full member cross-section and compromise the structural integrity of the bridge.

AASHTO LRFD · Fatigue Design · Distortion-Induced Cracking · Retrofit Engineering
Bridge Fatigue Cracking and AASHTO Detail Categories: The Engineer's Guide to Detection, Classification, and Retrofit
Fatigue cracks in steel bridges are not random failures. They follow predictable patterns governed by detail geometry, stress range, and the number of load cycles. Mastering AASHTO detail categories A through E' is the first step toward managing fatigue life — not guessing at it.

The Two Faces of Fatigue in Steel Bridges

Fatigue damage in steel bridges falls into two fundamentally distinct categories, each requiring a different analytical approach and different retrofit strategy. Understanding which type is at work on your bridge is the difference between a repair that lasts and one that fails within months.

Load-Induced Fatigue
Primary in-plane stresses from truck loading

Caused by cyclic in-plane stresses that can be directly correlated with bridge live load using conventional design theories. These stresses are predictable, calculable, and governed by the AASHTO S-N curve framework. Common locations include cover plate ends, flange splice details, and welded attachments where the stress range exceeds the detail category threshold.

Distortion-Induced Fatigue
Secondary out-of-plane stresses at connections

Caused by secondary stresses that cannot be calculated with conventional methods — they require refined finite element analysis or field strain gauge measurement. An estimated 90% of all fatigue cracking in steel bridges is distortion-induced, typically at web gaps where connection plates are not attached to both flanges.

48
Average age in years of steel bridges in the U.S. national inventory — nearly 30% have steel superstructures
90%
Of all fatigue cracking in steel bridges is caused by out-of-plane distortion, not primary load-induced stress
8
AASHTO detail categories from A (highest resistance) to E' (lowest) governing fatigue life of welded connections
75
Year design life specified in AASHTO LRFD for fatigue design — but many in-service bridges exceed this

AASHTO Detail Categories A Through E': What Each Classification Means for Your Bridge

The AASHTO LRFD Bridge Design Specifications define eight detail categories for fatigue — A, B, B', C, C', D, E, and E' — each corresponding to a specific S-N curve that relates the applied stress range to the number of cycles to failure. These categories are not arbitrary. They were derived from thousands of full-scale fatigue tests conducted at Lehigh University and other research laboratories, establishing a statistically validated lower-bound fatigue resistance at a 97.5% probability of survival for each detail type.

AASHTO Detail Categories — Fatigue Resistance and Typical Details
A
CAFT: 24.0 ksi
Plain rolled steel base metal with rolled or cleaned surfaces. No welding or thermal cutting. Highest fatigue resistance. Infinite life below 24 ksi stress range.
B
CAFT: 16.0 ksi
Continuous longitudinal welds, base metal in built-up members with welded stiffeners, welded connections in which the weld is parallel to stress direction.
B'
CAFT: 12.0 ksi
Longitudinal welds with weld termination at ends. Partial penetration butt welds with weld reinforcement not removed. Base metal at tack welds.
C
CAFT: 10.0 ksi
Base metal at transverse stiffener welds, base metal at welded connections with attachments shorter than 4 inches. Riveted connections evaluated as Category C per MBE.
C'
CAFT: 8.0 ksi
Base metal at welded stud-type shear connectors. Normally not a governing detail in typical girder design but relevant in composite member evaluation.
D
CAFT: 7.0 ksi
Base metal at attachments longer than 4 inches with weld normal to stress direction. Cover plate ends with flanges thicker than 0.8 inches. Fillet weld terminations.
E
CAFT: 4.5 ksi
Base metal at cover plate ends with flange thickness 0.8 inches or less. Welded attachments with length perpendicular to stress exceeding 4 inches. Thick cover plates.
E'
CAFT: 2.6 ksi
Base metal at cover plate ends with flange thickness greater than 0.8 inches and cover plate width narrower than flange. The lowest fatigue resistance category. Highest crack growth rate.

The S-N Curve Framework: How Fatigue Life Is Quantified

The S-N curve is the fundamental tool for fatigue design and evaluation. On a log-log plot, stress range (S) is plotted against the number of cycles to failure (N). For each AASHTO detail category, the curve has two regions: a sloping finite-life line where the fatigue resistance follows an inverse cubic relationship with the number of cycles (N = A / S^3), and a horizontal infinite-life line defined by the constant amplitude fatigue threshold (CAFT). If the applied stress range at a detail is below its CAFT, the detail is theoretically capable of infinite fatigue life under constant amplitude loading.

Fatigue Design Limit States Under AASHTO LRFD
Fatigue I
Infinite life check. Uses 75-year design life load factor. Stress range must be below CAFT of the detail category. No ADTT required.
Fatigue II
Finite life check. Applied when Fatigue I is not satisfied. Uses projected ADTT over design life. Strength = (A / N)^(1/3).
Detail Constant A
Experimental constant for each category. Ranges from 250 x 10^8 (Cat A) to 3.9 x 10^8 (Cat E'). Defines position of S-N curve.
Load Factor
Fatigue I load factor = 1.50 (infinite life). Fatigue II load factor = 0.75 (finite life). Dynamic load allowance = 15% for both.

Web Gap Cracking: The Most Common Distortion-Induced Fatigue Problem

Prior to the mid-1980s, bridge girders were commonly constructed with a gap between the end of the transverse connection plate and the tension flange. This practice was intended to reduce the stress concentration at the welded connection plate-to-flange detail. However, it created a different problem: the web gap region became the site of severe out-of-plane distortion under live load. As the cross-section rotates under truck loading, the relative displacement between the connected and unconnected sides of the web gap induces high localized bending stresses that can exceed yield at the web gap toe — even though the global girder stresses remain well within allowable limits.

Root Cause
Differential deflection between adjacent girders

When one girder deflects more than its neighbor under an eccentric truck load, the cross-frame or diaphragm forces the connection plate to rotate. The web gap — typically 2 to 4 inches between the connection plate end and the flange — must accommodate this rotation through out-of-plane bending of the web plate.

Retrofit Solution
Connection plate-to-flange weld attachment

The most effective retrofit for web gap cracking is to weld the connection plate directly to the tension flange, eliminating the gap and preventing the out-of-plane distortion mechanism entirely. Alternative retrofits include softening the connection plate end or removing diaphragms where structurally feasible.

Non-Destructive Testing Methods for Fatigue Crack Detection

Detecting fatigue cracks before they reach critical length is the central challenge of bridge fatigue management. The National Bridge Inspection Standards require fracture-critical members to be inspected every 24 months, but the choice of inspection method determines whether a crack is found at a 1 mm length or a 50 mm length — and that difference determines whether the repair is a simple drill stop or a major structural intervention.

Method 1
Visual Inspection

The most widely used and cost-effective method. Inspectors look for rust staining, paint cracking, and surface discontinuities along weld toes. AWS D1.5 Bridge Welding Code specifies acceptance criteria. Can detect cracks once they have broken the surface, but misses sub-surface crack initiation.

Low cost
Surface cracks only
24-month cycle
Method 2
Magnetic Particle Testing

Ferromagnetic particles are applied to a magnetized surface, accumulating at locations where the magnetic field leaks due to surface or near-surface discontinuities. Wet visible magnetic particle testing with black bath on white contrast paint is the most sensitive field method for detecting surface fatigue cracks in steel bridge welds at thickness transition points.

High sensitivity
Paint must be removed
Field proven
Method 3
Ultrasonic Testing

High-frequency sound waves are transmitted into the steel and reflections from crack surfaces are analyzed. Pulse-echo and time-of-flight diffraction techniques can detect sub-surface cracks and measure crack depth. Phased array UT provides imaging capability for complex geometries at weld details. Requires skilled operators and clean surfaces.

Sub-surface detection
Crack depth measurement
Operator dependent
Method 4
Dye Penetrant Testing

A colored liquid penetrant is applied to the cleaned surface, allowed to seep into surface-breaking cracks, and then developed with a white contrast developer to make the indication visible. Effective for detecting surface cracks in non-porous materials. Less sensitive than magnetic particle testing for ferromagnetic materials but useful for non-magnetic weld metals.

Simple application
Surface only
Low cost

Retrofit Methods for Fatigue Cracks: What Works and When

The choice of retrofit method depends on whether the objective is to arrest an existing crack (repair) or to upgrade the fatigue resistance before cracking occurs (retrofit). The AASHTO-NSBA Maintenance Guidelines for Steel Bridges to Address Fatigue Cracking (G14.1-2021) provides the current state-of-the-art framework for selecting and implementing these methods.

Weld Toe Grinding
Improves geometry, removes discontinuities

Burr grinding the weld toe to a smooth concave profile removes the micro-discontinuities where fatigue cracks initiate. Effective for uncracked welds. Can improve fatigue life by a factor of 2 to 3. Depth should not exceed 0.02 inches below the plate surface. Air or electric die grinder with tungsten carbide burr.

Hammer Peening
Introduces compressive residual stress

Mechanical impact treatment at the weld toe introduces compressive residual stresses that counteract the tensile cyclic stresses driving crack growth. Ultrasonic needle peening (UNP) and high-frequency mechanical impact (HFMI) treatments can increase fatigue class by up to 4 categories for steels with yield below 355 MPa. IIW provides quality assurance guidelines.

Drill Stop Holes
Arrests crack propagation at the tip

Drilling a hole at the crack tip removes the high-stress concentration region and blunts the crack. Cold expansion of the drill stop (StopCrackEX system) imparts compressive residual stress around the hole, extending fatigue life by over 10 times compared to standard drill stops. Effective for small cracks where access permits.

Connection Plate Attachment
Eliminates web gap distortion mechanism

Welding the connection plate end to the girder flange eliminates the web gap and prevents out-of-plane distortion entirely. This is the most permanent retrofit for web gap cracking. Requires careful welding procedure to avoid introducing new fatigue-critical details. Field studies show unlimited fatigue life after proper attachment.

Fatigue Life Evaluation of Existing Bridges: The NCHRP Report 721 Framework

For existing bridges, the evaluation approach differs from the design of new bridges. The AASHTO Manual for Bridge Evaluation incorporates the latest research from NCHRP Report 721, which provides updated fatigue resistance categories for riveted connections and tack welds. The MBE recommends that base metal at net sections of riveted connections in existing bridges be evaluated as Category C rather than the more conservative Category D specified for new design, reflecting the internal redundancy and load distribution characteristics of riveted built-up members.

The Evaluation Sequence: From Field Data to Fatigue Life Decision
Step 1
Classify Every Detail
Review as-built drawings and field verify each connection detail. Assign AASHTO detail category to every welded connection, attachment, stiffener, and splice. Identify all web gaps and distortion-susceptible details.
Step 2
Determine Stress Range
Calculate the live load stress range at each critical detail using the AASHTO fatigue truck with 30-foot fixed rear-axle spacing and 15% dynamic load allowance. For distortion-sensitive details, use refined FE analysis or field strain measurement.
Step 3
Check Fatigue I and II
Check Fatigue I (infinite life) first. If stress range exceeds CAFT, apply Fatigue II (finite life) using projected ADTT over remaining service life. Calculate remaining fatigue life in years. Prioritize details with life less than remaining design life.

Conclusion

Bridge fatigue cracking is not a random occurrence that must be accepted as an inevitable cost of aging infrastructure. It is a predictable, classifiable, and manageable phenomenon. The AASHTO detail category system provides a well-validated framework for understanding why certain details crack and others do not, under what stress ranges, and after how many cycles. The distinction between load-induced and distortion-induced fatigue determines the analytical method required. The choice between infinite-life and finite-life design governs the economic decision of whether to retrofit or monitor.

The most effective fatigue management strategy for any bridge inventory combines three elements: accurate detail classification using the AASHTO framework, appropriate non-destructive inspection at the right frequency with the right method, and timely retrofit intervention using proven techniques such as weld toe grinding, peening, drill stop cold expansion, or connection plate attachment. Bridges that are managed under this three-part framework consistently achieve actual fatigue lives that exceed their original design life — often by several decades.

The technology for fatigue crack detection and life extension has advanced significantly. What was once a reactive cycle of crack discovery, emergency repair, and premature replacement can now be a proactive process of condition-based monitoring, targeted retrofit, and extended service life. The bridge engineer who masters AASHTO detail categories and the full toolkit of fatigue evaluation and retrofit methods is equipped to make decisions that keep bridges in service longer, at lower cost, and with higher safety margins.

Fatigue Evaluation · Detail Classification · Retrofit Engineering · Inspection Planning
Every Bridge Has a Fatigue Life. The Question Is Whether You Know What It Is.
iFactory's AI-driven structural health monitoring platform integrates AASHTO fatigue evaluation workflows with real-time sensor data analysis, automated detail classification, and predictive remaining-life modeling. Book a demo to see it configured for your bridge inventory.

Frequently Asked Questions

Load-induced fatigue is caused by primary in-plane stresses that can be calculated using conventional beam theory and directly correlated with the bridge live load. Distortion-induced fatigue is caused by secondary out-of-plane stresses that result from differential deflection between adjacent girders, cross-frame rotation, or other relative displacements. Approximately 90% of all fatigue cracking in steel bridges is distortion-induced, typically at web gaps where connection plates are not attached to the tension flange. Load-induced fatigue can be evaluated using the standard AASHTO S-N curve framework, while distortion-induced fatigue requires refined finite element analysis or field strain measurement. Talk to an expert about distortion-induced fatigue evaluation for your bridge type.

AASHTO LRFD Table 6.6.1.2.3-1 provides detailed descriptions and illustrative sketches for each detail category. The determination depends on several factors: the type of detail (base metal, weld metal, welded attachment), the direction of stress relative to the weld, the attachment length perpendicular to the stress direction, the flange thickness for cover plate details, and whether the weld is continuous or has termination points. For existing bridges, the AASHTO Manual for Bridge Evaluation provides additional guidance, including the provision that riveted connections may be evaluated as Category C rather than Category D. If a detail does not clearly match any category, consult a bridge engineer with fatigue expertise. Book a demo to see iFactory's automated detail classification tool for bridge inventories.

The constant amplitude fatigue threshold is the stress range below which a detail will theoretically experience infinite fatigue life under constant amplitude loading. Each AASHTO detail category has its own CAFT value, ranging from 24.0 ksi for Category A down to 2.6 ksi for Category E'. The CAFT values are: A = 24.0 ksi, B = 16.0 ksi, B' = 12.0 ksi, C = 10.0 ksi, C' = 8.0 ksi, D = 7.0 ksi, E = 4.5 ksi, and E' = 2.6 ksi. If the calculated stress range at a detail is below its CAFT, the detail satisfies the Fatigue I limit state and no further fatigue evaluation is required. This is why the Fatigue I check is always performed first in design and evaluation. Contact an expert for guidance on interpreting CAFT values in your specific bridge context.

There is no single best method — the optimal NDT technique depends on the crack location, access conditions, and inspection objectives. For surface-breaking cracks in ferromagnetic steel, wet visible magnetic particle testing offers the best combination of sensitivity, speed, and field reliability. For sub-surface cracks or crack depth measurement, ultrasonic testing (especially phased array) is preferred. For initial screening during routine inspection, careful visual inspection for rust staining and paint cracking is the most cost-effective approach. The NBIS requires FCM inspection every 24 months, but the specific NDT method should be selected based on the detail type and cracking history. Many DOTs specify minimum NDT requirements in their bridge inspection manuals. Book a demo to see iFactory's inspection planning module that recommends optimal NDT methods based on detail classification.

Weld toe grinding is a well-validated retrofit technique that can improve fatigue life by a factor of 2 to 3 when properly applied. It works by removing the micro-discontinuities and undercuts at the weld toe where fatigue cracks initiate, and by improving the weld geometry to reduce the local stress concentration factor. The grinding should produce a smooth concave profile with a depth not exceeding 0.02 inches below the plate surface. Burr grinding with a tungsten carbide rotary burr is the preferred method. The improvement is most significant in the high-cycle fatigue regime (lives greater than 10^6 cycles), where crack initiation occupies a larger portion of total life. For low-cycle fatigue, peening methods that introduce compressive residual stress are often more effective. Talk to a retrofit specialist about the most appropriate surface treatment for your specific bridge details.

The most effective and permanent retrofit for web gap fatigue cracking is to weld the connection plate directly to the girder flange, eliminating the gap that allows out-of-plane distortion. This approach has been validated through field instrumentation studies and full-scale testing. When properly executed with appropriate welding procedures and NDT verification, this retrofit can provide unlimited fatigue life at the web gap detail. Alternative retrofits include softening the connection plate end by slot-cutting to reduce stiffness, or removing diaphragms where structurally feasible — though these alternatives are generally less effective and may introduce new issues. The choice depends on the specific bridge configuration, access conditions, and whether the distortion mechanism is driven by cross-frame rotation or differential deflection. Book a demo to see iFactory's retrofit decision support tool for web gap details.

Your Bridge's Fatigue Life Is a Number. We Can Help You Calculate It.
iFactory's fatigue evaluation platform combines AASHTO detail category classification, live sensor data integration, and predictive remaining-life analytics into a single dashboard for bridge engineers and asset managers. See it running on your inventory data.

Share This Story, Choose Your Platform!