Asset Lifecycle Cost Analysis — AI Replacement vs Rehabilitation Decision Framework
By Grace on June 24, 2026
Three identical pumps were installed in the same water treatment facility in 2010. By 2025, Pump A had been overhauled twice and was running at 82% efficiency. Pump B had received only basic maintenance and was operating at 61% efficiency with recurring seal failures. Pump C had been replaced in 2020 at a capital cost of USD 47,000. The asset manager who inherited all three faced the same question for each: repair, rehabilitate, or replace? The answer was different for every pump — and the financial difference between getting it right and getting it wrong exceeded USD 120,000 over the remaining service life of the facility. This is the problem that lifecycle cost analysis solves. The global infrastructure asset management market is projected to reach USD 50.11 billion by 2031, growing at 10.28% annually — driven by the recognition that data-driven repair versus replacement decisions are the single largest controllable cost factor in infrastructure operations. iFactory's AI Lifecycle Cost Analysis module was built to give every asset manager the decision framework that makes this call correctly, every time.
Lifecycle Cost Analysis · AI Replacement Decision · Rehabilitation Framework · TCO Modelling · Capital Allocation
Repair, Rehabilitate, or Replace? iFactory's AI Analyses Every Option's Full Lifecycle Cost and Recommends the Decision That Saves the Most Over Time.
iFactory's AI lifecycle cost analysis module ingests asset condition data, repair history, operating costs, and replacement economics to model repair, rehabilitation, and replacement scenarios — giving asset managers a defensible decision framework for every capital allocation choice, backed by total cost of ownership data rather than repair-bill intuition.
Projected infrastructure asset management market by 2031 at 10.28% CAGR — lifecycle cost analysis is the fastest-growing capability within this market
20-40%
Potential extension of equipment lifetimes achievable through data-driven repair vs replace decision frameworks rather than reactive or calendar-based approaches
3.17x
The maintenance cost multiplier threshold at which replacement becomes the economically correct decision — yet most organisations replace assets far below this threshold
50%
Potential reduction in unplanned downtime through predictive lifecycle analysis — catching assets before they cross the cost-ineffective repair threshold
Why the Repair Versus Replace Decision Is the Highest-Stakes Call an Asset Manager Makes — and Why Most Get It Wrong
The repair versus replace decision is not a single financial calculation. It is a multi-dimensional problem that combines current asset condition, historical cost trajectory, remaining useful life projection, operational criticality, technological obsolescence risk, and capital budget timing. Most asset managers make this decision based on the most visible signal — the immediate repair bill — and miss the lifecycle economics that determine whether that repair is the last one needed or the first of an accelerating cost spiral. The data to make the correct decision exists. It is almost never assembled in the same place at the same time.
The Three Decision Failures That Drive Lifecycle Cost Waste
The Repair Trap
Repeated repairs on a deteriorating asset accumulate to more than replacement cost — but each individual repair is cheap enough to approve.
This is the most common lifecycle cost failure. A pump seal is replaced at USD 1,200. Six months later, a bearing fails at USD 3,800. Four months after that, the motor is rewound at USD 7,400. Each individual repair clears the maintenance budget approval threshold. Over three years, cumulative repair spend reaches USD 28,000 against a replacement cost of USD 18,000 — with the asset still running at degraded efficiency. The organisation paid 55% more than replacement and still owns an aging asset with further failures inevitable. The problem is not the repair decisions in isolation. It is the absence of a cumulative cost tracking mechanism that triggers the replacement evaluation when total repair spend crosses a defined threshold relative to replacement value.
Cumulative Cost Blindness
The Premature Replacement Bias
Assets are replaced before their economic life is exhausted because a single high repair cost triggers an emotional rather than analytical replacement decision.
The opposite failure is equally costly. A compressor experiences a major failure at year 12 of a 20-year design life. The repair quote of USD 22,000 seems high against a replacement cost of USD 65,000, so the decision is made to replace. But the lifecycle cost model shows that with this single repair, the compressor's remaining useful life of seven years costs USD 3,140 per year in maintenance against USD 9,280 per year in capital recovery cost for the replacement. The repair was the economically correct choice — but the organisation's decision framework compared the repair bill against the replacement price in isolation, without dividing each by the remaining life the asset would deliver. Premature replacement at scale produces capital programmes that spend money faster than necessary, consuming budget that should be allocated to genuinely failing assets.
Capital Spend Acceleration
The Rehabilitation Gap
Rehabilitation — the intermediate option between repair and replace — is systematically underused because it requires more analysis than either extreme.
For many asset classes, the optimal economic decision is neither full replacement nor continued piecemeal repair. It is targeted rehabilitation — restoring the asset to near-original condition at 40-60% of replacement cost, with an extended service life of 60-80% of new. A concrete bridge with deck spalling does not need replacement. It needs deck rehabilitation. A water main with internal corrosion does not need full replacement. It needs lining. A pump with impeller wear does not need replacement. It needs a refurbished impeller and bearing upgrade. But rehabilitation decisions require detailed condition assessment, cost-benefit modelling of the restored versus new asset, and remaining life projection — analysis that most organisations cannot produce quickly enough to inform the decision cycle. The result is systematic underinvestment in rehabilitation and overinvestment in both repairs and replacements.
Underused Optimal Option
The Data Disconnection
The data needed to make the correct decision is distributed across four systems that never share information with each other.
A correct lifecycle cost decision requires: condition assessment history from the inspection system, cumulative repair cost from the work order system, operating efficiency data from the SCADA or monitoring system, and replacement cost data from procurement. When these data sources are disconnected, the asset manager making the repair-or-replace decision sees only the current repair bill and a vague memory of past costs — producing decisions that are systematically biased toward whichever option requires the least data assembly effort. The connection between repair decisions and lifecycle outcomes remains invisible until a post-hoc analysis reveals that the wrong call was made three budget cycles ago, with costs that cannot be recovered.
Invisible Decision Cost
AI Lifecycle Cost Analysis · Asset Replacement Decision · TCO Optimisation · Repair vs Rehab vs Replace
The Correct Decision for Every Asset at Every Point in Its Life. iFactory's AI Makes Repair, Rehab, and Replace a Data Question Instead of a Guess.
Integrated lifecycle cost modelling that pulls condition data, repair history, operating costs, and replacement economics into a single decision view — with AI-powered scenario comparison for repair, rehabilitation, and replacement options, backed by total cost of ownership projections across each asset's remaining service life.
The Three-Option Decision Framework — How iFactory Models Repair, Rehabilitate, and Replace
Most asset organisations operate with a binary decision framework — repair or replace. The most cost-effective option is often the one in the middle: rehabilitation. iFactory's Lifecycle Cost Analysis module models all three options simultaneously, projecting the total cost of ownership for each over the remaining service life of the asset and presenting the comparison in a single decision view.
Capability 01
Full Lifecycle Cost Models for Every Asset — Built Automatically from Your Existing Data
TCO Intelligence
iFactory's lifecycle cost engine automatically builds a total cost of ownership model for each asset in the register by ingesting data from existing source systems — acquisition cost and installation date from procurement, cumulative repair spend from work order history, operating costs from the energy management system or SCADA, condition scores from inspection records, and replacement cost estimates from procurement or recent procurement exercises. The model calculates the asset's annualised cost per year of service to date and projects the forward cost trajectory under each of the three decision options. Asset managers reviewing a repair-or-replace decision no longer need to assemble data from four systems and build a spreadsheet. The TCO model is pre-calculated for every asset, updated with every new work order, and visible from the asset record in a single click.
Auto-built TCO per asset from existing data
Annualised cost to date and forward projection
Live TCO update with every new work order entry
Capability 02
Three-Option Scenario Comparison — Repair, Rehabilitate, and Replace Modelled Side by Side
Decision Framework
When an asset reaches a decision trigger point — a high-cost repair event, a condition score drop below threshold, or cumulative repair spend reaching a configurable percentage of replacement value — iFactory automatically generates a three-option scenario comparison. Option A models continued repair with projected annual maintenance costs based on the asset's deterioration curve. Option B models rehabilitation with its estimated cost, the resulting condition improvement, and extended service life based on industry benchmarks for the specific asset class and intervention type. Option C models replacement with the full capital cost, depreciation schedule, and projected operating cost advantage of the new asset. Each scenario shows the net present value of total cost of ownership over the remaining planning horizon, the annualised cost comparison, and the breakeven point where one option becomes more economical than another. The asset manager sees the lifecycle economic comparison in a single view — not a spreadsheet they have to build themselves.
Repair vs rehab vs replace scenario models
NPV comparison across remaining life horizon
Breakeven point and annualised cost analysis
Capability 03
Remaining Useful Life Prediction — Project When Each Asset Will Cross the Economic Replacement Threshold
Predictive Analytics
The AI engine in iFactory's lifecycle cost module analyses deterioration patterns from the asset's own condition history and from benchmark data across similar asset classes to project the remaining useful life under each decision option. For the repair option, the model projects the point at which annual maintenance cost will exceed the annualised capital recovery cost of a replacement — the economic replacement threshold. For the rehabilitation option, the model projects the extended service life delivered by the intervention and the year in which the asset will again reach the decision trigger point. For the replacement option, the model projects the full lifecycle cost of the new asset across its expected service life, including projected maintenance costs. These projections allow asset managers to see not just which option is cheapest today, but which option produces the lowest total cost over the full planning horizon — and when each option's relative advantage shifts.
Economic replacement threshold projection
Remaining useful life modelling
Benchmark deterioration curve analysis
Capability 04
Portfolio-Level Lifecycle Optimisation — Prioritise Capital Across Your Full Asset Population
Portfolio Intelligence
iFactory extends lifecycle cost analysis from the individual asset level to the full portfolio. The portfolio view shows every asset colour-coded by its current economic decision zone — green for assets where continued repair is optimal, amber for assets approaching the rehabilitation window, and red for assets that have crossed the economic replacement threshold. Asset managers can filter the portfolio view by asset class, location, criticality, or condition range to identify clusters of assets approaching replacement simultaneously — enabling bundled procurement strategies and capital programme sequencing that individual asset analysis cannot support. The portfolio lifecycle view transforms capital planning from a reactive process — replacing assets when they fail — into a strategic one — replacing assets at the economically optimal point in their lifecycle, sequenced to maximise programme efficiency and minimise total cost of ownership across the full asset population.
Portfolio-wide economic decision zone mapping
Replacement clustering for bundled procurement
Strategic capital sequencing from lifecycle data
How the Lifecycle Cost Comparison Works — Repair, Rehabilitate, and Replace by the Numbers
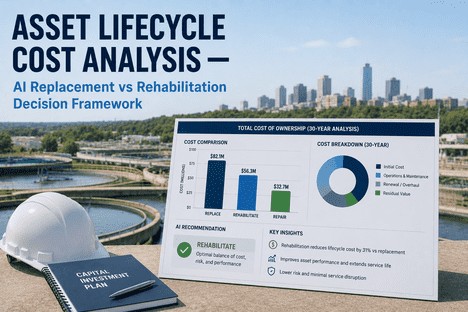
The table below shows how iFactory's lifecycle cost engine presents the three-option comparison for a single asset — a 15-year-old industrial pump that has just experienced its third major failure. The numbers demonstrate why the middle option is so often the correct choice, and why binary repair-or-replace frameworks systematically misallocate capital.
Three-Option Lifecycle Cost Comparison for a 15-Year Industrial Pump (iFactory AI Model Output)
Decision Option
Immediate Cost
10-Year TCO
Annualised Cost
Option A: Continue Repair
USD 11,200 (current repair)
USD 73,400
USD 7,340 / year
Option B: Rehabilitation
USD 24,500 (overhaul + upgrade)
USD 41,800
USD 4,180 / year
Option C: Full Replacement
USD 57,000 (purchase + install)
USD 67,200
USD 6,720 / year
In this example, rehabilitation delivers 43% lower 10-year TCO than continued repair and 38% lower than replacement — but this option is invisible to any decision framework that only compares the immediate repair bill against the replacement price. iFactory's AI surfaces the rehab option automatically when the asset's condition trajectory and cost history indicate it is viable.
I inherited a portfolio of 840 assets with a maintenance backlog of USD 4.2 million and a capital replacement budget that had not kept pace with deterioration. Every repair-or-replace decision was a debate between the maintenance superintendent who wanted to fix everything and the finance director who wanted to delay all capital spend. There was no data layer underneath the discussion — just opinions and budget pressure. The first time I ran iFactory's lifecycle cost model across our pump population, it identified fourteen assets where rehabilitation was the optimal choice but nobody had ever proposed it because our process only asked whether to repair or replace. The rehabilitation programme alone saved us approximately USD 340,000 in the first year versus the replacement costs we would have approved. I now bring the lifecycle cost comparison to every capital budget meeting. The data settles debates that used to take weeks.
— Director of Asset Management, Municipal Water Utility — 22 Years Infrastructure Operations
Conclusion — The Asset Decision You Make Today Determines the Cost You Pay for the Next Decade
The difference between a correct lifecycle cost decision and an incorrect one is not visible in the current month's budget. It compounds over years — appearing as assets that consume maintenance budgets faster than they should, capital programmes that spend money earlier than necessary, and a portfolio-wide cost trajectory that drifts upward without any single decision point being identifiable as the cause. The global infrastructure asset management market recognises this: it is growing at 10.28% annually because organisations have realised that the cost of disconnected lifecycle data exceeds the cost of the platform that connects it.
The organisations that will maintain the lowest total cost of ownership over the next decade are not those with the largest capital budgets or the newest equipment. They are the ones that have deployed a structured lifecycle cost decision framework — one that evaluates repair, rehabilitation, and replacement options side by side, powered by current condition data, cumulative repair history, and forward-looking cost projections for every asset in the portfolio.
iFactory's AI Lifecycle Cost Analysis module gives asset managers the decision framework they need to make every repair, rehabilitate, or replace call correctly — with auto-built TCO models, three-option scenario comparison, remaining useful life prediction, and portfolio-level lifecycle optimisation. Book a Demo to see the platform configured with your asset data and lifecycle cost parameters, or talk to an expert about how AI-powered lifecycle analysis maps to your organisation's asset portfolio and capital planning process.
Stop Guessing Whether to Repair or Replace. iFactory's AI Analyses Every Option's Total Cost of Ownership and Shows You the Answer.
Auto-built lifecycle cost models, three-option scenario comparison, remaining useful life prediction, and portfolio-level capital optimisation — all in a single platform built for asset managers who need to defend every dollar they spend or defer.
iFactory's lifecycle cost engine requires three core data layers to build initial TCO models: an asset register with acquisition cost and installation date, work order history with repair costs and fault codes, and current condition scores or inspection grades. If operating cost data from SCADA or energy management systems is available, the model incorporates it for greater precision. The initial TCO model for the full asset portfolio is typically generated within the first one to two weeks of data ingestion, with accuracy improving as the engine processes more condition history and repair data. For organisations with limited historical data, iFactory uses industry benchmark deterioration curves and standard cost assumptions calibrated to the asset class, with confidence indicators that flag which projections are data-rich and which rely on broader estimates. Talk to an expert to review your current data landscape and determine which additional data sources would strengthen the lifecycle cost models for your specific asset portfolio.
iFactory's lifecycle cost model uses a tiered approach for rehabilitation cost estimation. The initial model uses asset class benchmarks — for example, pump overhaul and bearing upgrade at 40% of replacement cost, bridge deck rehabilitation at 55% of replacement cost, water main lining at 35% of replacement cost — derived from industry databases and aggregated project records. These benchmark estimates are used for the initial TCO comparison and portfolio-level screening. When an asset is flagged as a rehabilitation candidate for detailed evaluation, the platform supports a detailed rehabilitation cost input from the engineering team or a site-specific assessment, which replaces the benchmark estimate in the model. The three-option comparison is then re-run with the site-specific cost data to produce the final decision recommendation. This tiered approach ensures that the portfolio screening is data-driven without requiring site-specific assessments for every asset, while the final decision on flagged assets incorporates the detailed engineering cost estimate. Book a Demo to see how the tiered estimation process works for your asset classes.
Yes. iFactory's lifecycle cost engine is asset-class aware, applying different deterioration curves, intervention types, cost benchmarks, and service life projections for each asset category. Buildings are modelled with component-level deterioration (roof, HVAC, structural, envelope) and typical 30-50 year service lives with major rehabilitation cycles at 15-20 years. Mechanical equipment like pumps and compressors is modelled with wear-curve deterioration, cumulative repair cost tracking relative to replacement value, and typical 10-20 year service lives with overhaul options. Linear infrastructure like roads, water mains, and bridges is modelled with condition-index-based deterioration, rehabilitation options at specific condition thresholds, and lifecycle cost optimisation across the network. The platform supports unlimited asset classifications with configurable lifecycle parameters, deterioration curves, and intervention cost benchmarks per class. Talk to an expert to review your asset classification structure and confirm the lifecycle parameter configuration for each asset class in your portfolio.
iFactory generates lifecycle cost outputs in formats that both asset management and finance teams can use. The asset-level three-option comparison is available as a detailed decision view for the asset manager. The portfolio-level lifecycle summary is available as an executive dashboard showing total replacement value, assets in each economic decision zone, projected rehabilitation and replacement spend over the next five and ten years by asset class, and the total cost of ownership trend for the full portfolio. Both views can be exported for capital planning submissions, budget presentations, and board reporting. The platform also supports integration with financial planning systems for capital budget data exchange. The lifecycle cost outputs are designed to provide the defensible, auditable data trail that finance stakeholders require when approving capital expenditure — with every cost projection linked to the underlying asset data and assumptions that produced it. Book a Demo to see the capital planning and portfolio reporting outputs for a sample asset portfolio similar to yours.
iFactory's lifecycle cost model includes a sensitivity analysis layer that tests the decision robustness against changes in key assumptions — inflation rate, discount rate, energy cost escalation, and maintenance cost escalation. For each three-option comparison, the model shows the range within which each option remains the optimal choice, and identifies the breakeven point at which changing conditions would shift the recommendation from one option to another. For example, the model might show that Option B (rehabilitation) is the optimal choice as long as annual maintenance cost escalation stays below 6.5% — and that if escalation exceeds this threshold, Option C (replacement) becomes the lower-cost option. This sensitivity analysis allows asset managers and finance teams to understand not just which option is cheapest under current assumptions, but how much confidence they should have in that recommendation given the uncertainty in forward projections. Talk to an expert to learn how the sensitivity analysis layer applies to your asset classes and operating context.