Water Infrastructure Capital Planning — Pipe Replacement & AI Investment Optimization
By Grace on June 20, 2026
The water utility asset manager operates in a world where 40% of the pipe network is past its expected service life, capital budgets cover less than 1% of total system replacement value annually, and every dollar allocated to one project is a dollar not invested in another. The traditional capital improvement plan — built from spreadsheets, age-based assumptions, and institutional memory — produces replacement lists that feel defensible but are not predictive. Pipes with decades of remaining useful life get replaced because they are old. Pipes near failure stay in the ground because their condition was inferred rather than measured. Regulators and ratepayers increasingly demand evidence that every capital dollar is allocated where it prevents the most failures, reduces the most risk, and delivers the highest return on investment. AI-powered capital planning closes the gap between what the asset manager knows about the network and what the network actually needs — transforming capital allocation from age-based guesswork into condition-based, risk-prioritised investment optimisation.
40%
Average proportion of water pipe networks in the US that have exceeded their expected service life — yet most capital plans continue to allocate replacement budgets based on age rather than actual condition and remaining useful life
77%
Reduction in annual pipe replacement costs achieved when AI-based risk modelling replaced age-based replacement programmes — documented by a mid-Atlantic utility serving 270,000 customers across 1,000 miles of water main
75%
Reduction in capital project planning time when AI-driven probability of failure analysis and spatial clustering replaced manual risk assessment — documented by Raleigh Water across its entire distribution network
55%
Proportion of all pipe failures found in just 1% of the distribution network when ML models identified high-risk cohorts — documented by Tucson Water across 4,600 miles of aging water mains
When 40% of Your Pipe Network Is Past Its Service Life, Age-Based Capital Planning Is Not Conservative — It Is Wasteful. AI Investment Optimization Finds the Pipes That Actually Need Replacement.
iFactory's AI capital planning platform transforms infrastructure investment from age-based guesswork to condition-based optimisation — using machine learning to predict remaining useful life, rank replacement priorities by risk, and generate multi-year CIP projections that maximise failure prevention per dollar invested.
The Asset Manager's Core Problem: You Cannot Prioritise What You Cannot Predict, and You Cannot Defend What You Cannot Evidence
Water infrastructure capital planning operates under a structural information asymmetry: the assets that are most visible — oldest pipes in the GIS, mains under major roadways, segments near known complaint areas — receive disproportionate attention regardless of their actual condition, while the pipes most likely to fail in the next five years remain invisible because age alone is a poor predictor of remaining useful life. A cast iron main installed in 1965 may have 30 more years of service life in a non-corrosive soil environment. A ductile iron main installed in 1995 may be at high risk of failure in aggressive soil with high moisture content and stray currents. The asset manager knows this. The capital planning spreadsheet cannot represent it. The consequence is a capital programme that systematically under-allocates to high-risk assets and over-allocates to low-risk ones — producing a failure rate that remains stubbornly high even as replacement spending increases. The EPA's 2024 enforcement framework and state regulatory pressure for defensible capital plans have elevated this from an operational inefficiency to a compliance and rate-proceeding exposure.
Four Critical Flaws in Traditional Water Capital Planning — and How AI Investment Optimisation Fixes Each One
01
Age-Driven Prioritisation Misses Real Failure Risk
Most utility capital plans rank replacement candidates primarily by installation year — the oldest pipes first. This approach ignores the variables that actually determine pipe deterioration: soil corrosivity, bedding condition, cathodic protection status, pressure zone, traffic loading, water quality chemistry, and the interaction effects among these factors. A pipe that is 80 years old in benign soil may outlast a 30-year-old pipe in corrosive clay with heavy truck traffic. Age-based prioritisation systematically defers high-risk pipes while advancing low-risk ones, producing a CIP that feels methodical but is not predictive.
AI fix: ML models trained on break history, soil data, pressure, and pipe characteristics predict failure probability per segment — not per installation decade.
02
Consequence of Failure Is Estimated, Not Calculated
Capital prioritisation frameworks commonly assess consequence of failure through manual scoring — assigning points for pipe diameter, road classification, and proximity to critical facilities. These scores are typically static, updated only when the CIP is revised, and do not reflect the actual cost of a failure in that location: customer outage hours, traffic disruption costs, property damage exposure, emergency repair premiums, and regulatory reporting requirements. A 12-inch main under a four-lane arterial carries a different consequence than the same pipe under a residential cul-de-sac, but traditional scoring often treats them identically if they share the same point value.
AI fix: Dynamic consequence scoring uses GIS data, traffic volumes, customer impact zones, and emergency repair cost history to assign actual cost-of-failure values per segment.
03
Project Packaging Is Manual and Suboptimal
Even when individual pipe segments are correctly ranked, the process of grouping them into construction packages is typically manual — a planner reviews a ranked list and draws boundaries based on street segments, pressure zones, or administrative convenience. This manual approach misses optimisation opportunities: combining high-risk pipes with adjacent medium-risk pipes that share the same road surface can dramatically reduce per-metre replacement cost, but the manual planner cannot evaluate all possible combinations. The result is a construction programme that replaces more expensive individual segments than an optimised packaging approach would require.
AI fix: Spatial clustering and multi-objective optimisation algorithms group replacement segments into cost-efficient construction packages — balancing risk reduction, project size, and community disruption.
04
Capital Plans Are Static Documents, Not Living Investment Models
A typical CIP is updated annually or biennially through a manual process that takes weeks: collecting new break data, revising condition scores, adjusting project boundaries, and recalculating budgets. In the intervening months, new breaks occur, condition data arrives, and budget constraints shift — but the capital plan does not reflect these changes until the next revision cycle. The asset manager makes decisions on data that is 6 to 18 months old, while the network deteriorates continuously. When a rate board or regulator asks why a high-risk pipe was not in the current year's programme, the answer is that the data that would have revealed its priority was not available at the last plan revision.
AI fix: Continuous data ingestion updates risk scores, replacement priority, and CIP projections in near-real time — the capital plan reflects current network condition, not last year's assumptions.
Short-Term CIP That Redesigns the same Pipes Every Year Is Not Capital Planning. AI Investment Optimization Builds a Defensible, Multi-Year Programme That Maximises Failure Prevention Per Dollar.
iFactory's AI capital planning engine integrates GIS, break history, soil data, and operational records to produce risk-ranked replacement priorities with projected failure reduction — enabling asset managers to defend every capital dollar with data, not assumptions.
The iFactory AI Capital Planning Platform for Water Infrastructure Asset Managers
iFactory's AI capital planning platform operates as a three-layer investment intelligence system — risk-based asset scoring at the pipe level, spatial optimisation at the project level, and multi-year CIP modelling at the strategic level. Each layer serves a different capital planning function, and all three work together to transform raw asset data into a defensible, auditable capital investment programme.
Layer 01
Risk-Based Pipe Condition Scoring
ML models assign failure probability and consequence score to every pipe segment
The condition scoring layer ingests pipe attribute data from GIS — material, diameter, installation year, length — and enriches it with break history from the CMMS, soil corrosivity data from public or proprietary sources, pressure zone information from SCADA, traffic loading data from road classification layers, and water quality chemistry records. ML models are trained on historical break patterns to predict the probability of failure for each pipe segment over configurable time horizons — 1 year, 5 years, 10 years, 15 years. Consequence of failure is calculated dynamically using GIS-derived customer impact counts, traffic disruption costs, emergency repair cost history, and critical facility proximity. Every segment receives a combined risk score that updates automatically as new data arrives — a pipe that was low-risk last quarter becomes medium-risk after a nearby break suggests deteriorating soil conditions.
The optimisation layer applies spatial clustering algorithms to group high-risk pipe segments into construction packages that balance multiple competing objectives: maximising risk reduction, minimising per-metre replacement cost, aligning with pavement condition cycles to avoid rework, respecting project size constraints, and minimising community disruption. The platform evaluates combinations that a manual planner cannot — clustering a high-risk segment with an adjacent medium-risk segment on the same street may increase project length by 20% but reduce per-metre cost by 40%, freeing budget for additional projects elsewhere in the programme. The optimisation engine presents a ranked set of project packages with projected risk reduction, cost, and disruption metrics, enabling the asset manager to select the portfolio that best matches the available budget and board-level risk tolerance.
Spatial clustering algorithms
Multi-objective cost optimisation
Pavement cycle alignment
Layer 03
Multi-Year CIP Modelling and Scenario Analysis
What-if projections show risk reduction at every budget level
The strategic modelling layer takes the optimised project portfolio and projects it across multiple budget scenarios — showing the asset manager exactly how different annual investment levels affect system-wide failure risk over 5, 10, and 15 year horizons. A baseline scenario at current budget shows which pipes will fail and what the repair costs will be. An increased budget scenario shows the additional failures prevented and the net present value of avoided emergency repairs. A reduced budget scenario quantifies the increased risk exposure for council and rate board decision-making. Each scenario produces a defensible capital programme with projected risk reduction metrics, enabling the asset manager to answer the question that every board and regulator asks: if we approve this budget, what do we get for it? The platform integrates with long-range financial planning models to ensure the CIP is connected to rate structures, debt capacity, and funding sources — transforming the capital plan from an engineering document into a decision-making tool.
Every Capital Dollar Should Prevent the Maximum Number of Failures. AI Investment Modeling Ensures That Yours Do — and That the Data to Prove It Exists Before the Rate Hearing Starts.
iFactory's platform takes your existing GIS, break history, and operational data and produces a risk-ranked, spatially optimised, multi-year capital programme that maximises failure prevention per dollar invested — with audit-ready documentation for rate proceedings, board presentations, and regulatory reviews.
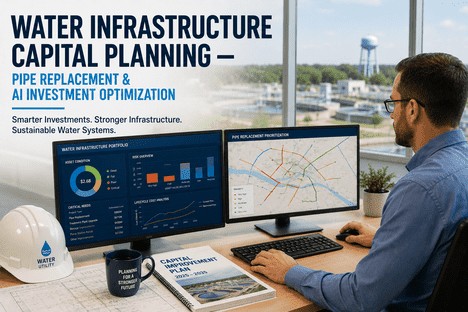
What the Capital Planning Dashboard Shows the Asset Manager
The asset manager's dashboard is designed to answer the questions that matter most for capital investment decisions: Which pipes are at highest risk and why? What is the projected failure rate at current budget levels? Which replacement projects deliver the most risk reduction per dollar? And what is the defensible capital plan for the next board presentation?
Capital View 01
Network Risk Heat Map — Probability and Consequence Combined
A GIS-integrated heat map that colour-codes every pipe segment by combined risk score — the product of ML-predicted failure probability and dynamically calculated consequence of failure. The view enables asset managers to see at a glance which zones of the network carry the highest risk, which pipes are driving that risk, and whether the dominant factor is high failure probability, high consequence, or both. Each segment is clickable for the full risk profile — break history, soil data, remaining useful life estimate, and the factors contributing to both probability and consequence scores.
Manager action: Identify high-risk zones for the next CIP cycle. Validate risk scores against operational knowledge during annual planning review.
Capital View 02
Replacement Priority Ranking — Optimised by Risk and Cost
Every pipe segment in the network is ranked by a composite score that combines failure risk with replacement cost efficiency — replacing the highest-risk pipe is always a priority, but a segment that can be bundled with adjacent high-risk pipes on the same street may deliver more total risk reduction per dollar than an isolated high-risk segment. The ranking view shows the priority order, the projected cost, the risk reduction achieved, and the optimal packaging recommendation for each segment. Asset managers can override rankings based on operational knowledge, and the override is logged with the rationale for audit trail completeness.
Manager action: Review the top-ranked replacement candidates. Adjust priorities based on coordination with planned roadwork or development projects.
The CIP projection view shows the system-wide failure rate and risk exposure over 5, 10, and 15 year horizons under different budget scenarios — current budget, increased budget, and reduced budget. Each scenario shows the projected number of failures, the total cost of emergency repairs avoided, the remaining system risk after planned replacements, and the net present value of the investment. The asset manager presents these projections to the board or rate council with the confidence that every scenario is data-backed and reproducible — the question is not whether the budget is sufficient, but what level of system risk the community is willing to accept at each investment level.
Manager action: Use scenario comparison to build the budget recommendation case. Present risk reduction trade-offs to board with quantified outcomes.
Capital View 04
Remaining Useful Life Forecast — Deterioration Trends by Cohort
The RUL view segments the pipe inventory by material, installation decade, soil corrosivity zone, and pressure class, and projects the deterioration trajectory for each cohort. Asset managers see not just which pipes are at risk today, but which cohorts will cross the risk threshold in the next planning cycle — enabling proactive CIP programming rather than reactive replacement. The cohort view is particularly valuable for strategic financial planning: when the board asks what the replacement liability will be in 10 years, the asset manager presents a data-driven forecast, not a straight-line depreciation estimate.
Manager action: Review cohort deterioration trends. Program condition assessment campaigns for cohorts approaching the risk threshold.
Capital View 05
What-If Scenario Modelling — Budget, Policy, and Timing Sensitivity
The what-if modelling view allows asset managers to adjust key planning variables — annual budget, replacement trigger risk threshold, minimum project size, maximum project cost — and see the impact on system risk, failure rate, and total investment requirement in real time. What happens if the budget is cut by 10%? Which projects fall out of the programme and what risk do they represent? What happens if the trigger threshold is lowered to include more medium-risk pipes? Each scenario generates a report that can be exported directly for board presentation or rate case documentation.
Manager action: Run what-if scenarios before budget meetings. Prepare responses for likely board questions about funding level trade-offs.
Capital View 06
Capital Plan Audit Export — Defensible Documentation for Rate Proceedings
Every element of the capital planning process — the raw pipe data, the risk model methodology, the spatial clustering logic, the scenario assumptions, and the final project portfolio — is documented and exportable in a structured format that rate boards, regulators, and auditors can review. The export includes the risk methodology documentation showing how probability and consequence scores are calculated, the data provenance for every variable, and the optimisation parameters used for project packaging. When an auditor asks why a specific pipe was or was not included in a given year's programme, the asset manager can trace the decision back to the risk score, the budget scenario, and the optimisation constraints that produced it.
Manager action: Export full audit package annually. Include risk methodology documentation with every CIP submission for full defensibility.
We were replacing about 8 miles of main per year based on an age-ranked list that had not changed substantially in five years. Our break rate was flat — we were spending the same money every year and getting the same number of failures. When we deployed the AI risk model, the first output showed that three of the five projects in our current year CIP were on pipes that the model ranked in the lowest risk quartile. The pipes that were actually failing were in a different part of the system entirely — younger pipes but in aggressive soil conditions we had never systematically mapped. We restructured the entire five-year programme around the risk model. Within two years, we reduced main breaks by 40% at the same annual budget. The board presentation that year was the easiest I have ever delivered because every project had a data-backed justification that even the most sceptical council member could follow.
— Asset Manager, Municipal Water Utility — 75,000 Service Connections, 1,200 Miles of Main, 14,000 Valves
Conclusion
Water infrastructure capital planning is not a scheduling problem that can be solved with age-ranked spreadsheets and annual revision cycles. It is an investment optimisation problem that requires continuous risk assessment, spatial optimisation, and multi-year scenario modelling to ensure that every capital dollar is allocated where it prevents the most failures, reduces the most risk, and delivers the highest return to the community. When 40% of pipe networks are past expected service life, when traditional age-based programmes replace low-risk pipes while high-risk pipes remain in the ground, and when capital plans are updated only annually while the network deteriorates continuously, the gap between the asset register and the investment programme widens with every budget cycle.
AI-powered capital planning addresses this structural gap across three dimensions simultaneously: ML-based failure probability prediction that accounts for material, soil, pressure, and break history rather than installation year alone; spatial optimisation and clustering algorithms that build cost-efficient replacement projects maximising risk reduction per dollar; and multi-year CIP scenario modelling that shows decision makers exactly what level of system risk each budget delivers. The documented outcomes across utilities of all sizes — 77% reduction in annual replacement costs, 75% reduction in planning time, 55% of failures concentrated in just 1% of the network identified by ML models, and 34% more effective capital allocation — are not projections. They are the documented results of moving from age-based capital planning to AI-driven investment optimisation.
iFactory's AI capital planning platform is built for water utility asset managers who need to defend every capital dollar with data, maximise failure prevention within constrained budgets, and generate audit-ready CIP documentation for rate proceedings, board presentations, and regulatory reviews. Book a Demo to see the platform configured for your pipe network GIS data and budget constraints, or talk to an expert about a free capital planning effectiveness assessment and risk model pilot for your utility.
Frequently Asked Questions
The minimum data requirement is pipe attribute data from GIS — material, diameter, installation year, and length — combined with historical break records from the CMMS or work order system. With these four data sets, the ML model can begin generating statistically significant failure probability predictions. Accuracy improves significantly when additional data is available: soil corrosivity data (from public sources or utility records), pressure zone information, water quality chemistry records, traffic loading classifications, and condition assessment results. A model initialised with GIS and break data typically produces useful risk rankings within 2 to 4 weeks of data ingestion. Full multi-factor models incorporating soil, pressure, and water quality data reach production reliability within the first 12 months as the model learns utility-specific failure patterns and the data integration pipeline matures. Talk to an expert about a data readiness assessment for your utility's GIS and break history records.
The spatial optimisation engine uses clustering algorithms that evaluate all possible combinations of high-risk pipe segments and group them into construction packages based on proximity, connectivity, size compatibility, and shared street segments. The optimisation balances multiple competing objectives simultaneously: maximising total risk reduction, minimising per-metre replacement cost, aligning with pavement condition data to avoid cutting into recently resurfaced roads, respecting maximum project size and budget constraints, and minimising community disruption by grouping work geographically. The pavement cycle integration is particularly valuable: the platform ingests the street resurfacing schedule and prioritises pipe replacements on streets that are due for repaving within the CIP window, eliminating the cost and customer frustration of replacing a pipe under a brand-new road surface. Book a Demo to see the spatial optimisation engine configured for your GIS network data and street resurfacing schedule.
The platform is designed to integrate with existing utility systems rather than replace them. GIS data is ingested via standard formats — shapefiles, geodatabases, or REST API — and the risk model results are written back as GIS layers that can be viewed in the utility's existing Esri or QGIS environment. Break and work order history is imported from the CMMS via API or batch export. Financial planning data — annual budgets, debt capacity, rate projections — can be integrated from Excel or financial modelling systems to connect the CIP with the long-range financial plan. The platform uses the utility's existing data environment as the source of truth and adds the predictive analytics and optimisation layer on top. The risk model outputs update automatically as new data arrives from any integrated source, ensuring the capital plan reflects current network conditions without requiring manual data reconciliation across systems. Talk to an expert about integration timelines for your existing GIS, CMMS, and financial planning platforms.
Defensibility is built into every layer of the platform. The risk model methodology — including every variable used for failure probability prediction, every factor in consequence scoring, and every optimisation parameter — is documented and exportable in a structured format. Each pipe segment's risk score can be traced back to the specific data inputs that produced it: break history, soil corrosivity, pressure zone, traffic loading, and the algorithm version applied. Every budget scenario is reproducible — the same input data and parameters produce the same CIP output, enabling independent verification. For rate proceedings, the platform generates a capital planning evidence package that includes the complete methodology documentation, the data provenance for all risk scores, the scenario assumptions for the recommended budget, and the projected risk reduction outcomes. When a rate board member asks why a specific pipe was included or excluded from the programme, the asset manager can trace the decision through the risk score, the optimisation constraints, and the budget scenario that produced it — answering with data rather than judgement. Book a Demo to review sample rate proceeding evidence packages generated for comparable utilities.
Forty Percent of Your Pipe Network Is Past Its Expected Service Life. Age-Based Capital Plans Are Not Replacing the Right Pipes. Get a Free Capital Planning Effectiveness Assessment and Risk Model Pilot for Your Utility.
iFactory's AI capital planning platform for water infrastructure asset managers — ML-based failure probability prediction, spatial optimisation for cost-efficient replacement packaging, multi-year CIP scenario modelling, and defensible audit documentation for rate proceedings, board presentations, and regulatory reviews — built on your existing GIS, CMMS, and financial planning data.