For a Digital Manufacturing Director running a mining conveyor operation, cycle time is the one metric that ties almost everything else together — throughput, cost per tonne moved, energy intensity, and equipment utilisation all shift when cycle time shifts. Yet in most operations, a meaningful share of cycle time has nothing to do with belt speed, motor capacity, or material throughput design. It is consumed by quality-related interruptions: inspection checkpoints that hold the line, rework loops that re-run material through a circuit, and unplanned micro-stoppages triggered by conditions that were visible in the process data minutes — sometimes hours — before the stop occurred. AI Vision Quality targets exactly this category of lost time, and for digital manufacturing directors building a cycle-time reduction case, it has become the highest-leverage place to start.
Machine Vision · Edge AI Inference · MES/ERP Integration · Real-Time Cycle Analytics
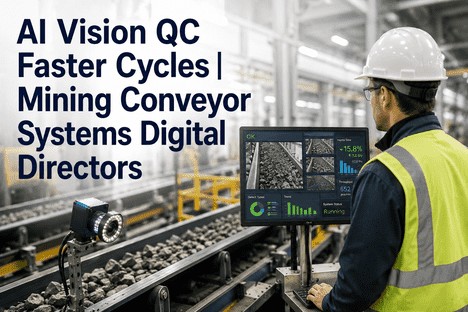
Digital Manufacturing Directors Cutting Cycle Time 10–20% Are Running AI Vision QC Across Their Conveyor Systems — Not Adding More Inspection Checkpoints.
iFactory's AI Vision Quality platform gives mining conveyor operations continuous belt monitoring, sub-20-millisecond defect classification, and a direct data path into the MES, ERP, and digital twin systems that drive cycle-time decisions — without replacing the SCADA or historian infrastructure already in place.
10–20%
Cycle time reduction reported by mining conveyor operations within the first two quarters of AI Vision Quality deployment
<20ms
Time for the deep-learning vision model to classify a defect and push the signal into the cycle-time control loop
30–40%
Reduction in inspection-driven micro-stops once continuous vision coverage replaces scheduled checkpoint inspections
7 weeks
Typical time from first sensor connection to a live cycle-time dashboard integrated with existing MES and ERP systems
Where Mining Conveyor Cycle Time Actually Disappears
Ask a plant team where cycle time is lost and the answer is usually framed around the conveyor itself — belt speed, drive capacity, transfer point design. But when digital manufacturing directors map cycle time against a full shift of process and quality data, a different picture emerges. The largest share of recoverable time sits in categories that are easy to overlook precisely because no single event is large enough to register on a downtime report: a checkpoint inspection that holds material for fifteen minutes here, a rework loop that re-runs a batch through the circuit there, a micro-stoppage triggered by a quality alarm that could have been pre-empted hours earlier.
Cycle Time Loss Breakdown — A Typical Shift
Inspection holds. Material waiting at a scheduled checkpoint for a manual pass/fail decision.
Rework loops. Out-of-spec material re-routed and re-processed through the same circuit.
Unplanned micro-stops. Short, quality-triggered stoppages with no advance warning.
Manual recalibration. Time spent adjusting SPC limits and process setpoints by hand.
None of these categories require a mechanical redesign to address. Each one is a function of how quickly a quality signal converts into a decision — and that is precisely the gap that ai vision quality for mining conveyor systems is built to close. When the detection-to-decision time drops from hours to milliseconds, the time previously spent waiting, re-processing, and recalibrating is returned directly to the production cycle.
Three Cycle-Time Levers AI Vision Quality Pulls on a Conveyor System
Compressing cycle time on a mining conveyor system comes down to three mechanisms, each addressing one of the loss categories above. Together, they form the basis of the 10–20% cycle time reduction that digital manufacturing directors report after deployment — and each one is achievable on existing infrastructure.
Lever 1
Eliminate Inspection-Driven Stops
Continuous deep-learning vision coverage replaces the scheduled checkpoint stop entirely. Every metre of belt is classified in real time, so material no longer waits in a queue for a manual pass/fail decision. The checkpoint becomes a logged data point instead of a physical hold, removing one of the largest fixed components of cycle time without changing belt speed or layout.
100% continuous coverage
No scheduled checkpoint holds
Real-time pass/fail logging
Lever 2
Close the Rework Loop Before It Opens
Root-cause ML models forecast quality outcomes before a batch is committed, using the same process variables that historically preceded an off-spec result. When the forecast crosses a risk threshold, the operator adjusts the process or isolates the batch before it enters the circuit — removing the re-processing cycle that would otherwise have followed.
Pre-batch quality forecasting
Root-cause variable ranking
Fewer re-processing cycles
Lever 3
Convert Unplanned Stoppages Into Scheduled Micro-Adjustments
Thermal, vibration, and vision data are fused into a single early-warning signal for idler, pulley, and splice conditions. Instead of an emergency stop when a component fails, the system flags the developing condition days in advance — turning what would have been an unplanned production-stopping event into a short, scheduled adjustment during a planned window.
Thermal + vibration + vision fusion
Early-warning maintenance windows
Fewer emergency stops
OPC-UA · Modbus · OSIsoft PI · Digital Twin Ready
Cycle Time Data That Speaks Your Architecture's Language — Not a New Dashboard to Check Separately.
iFactory writes cycle-time-relevant alerts and metrics directly into the MES, ERP, and digital twin systems your digital manufacturing programme already runs on, through standard industrial protocols.
From Vision Data to Closed-Loop Cycle Adjustment: The Architecture Behind the Number
A 10–20% cycle time figure is only as credible as the data path behind it. For a digital manufacturing director, the relevant question is not whether the vision model is accurate in isolation, but whether its output reaches the systems that make cycle-time decisions — the MES that schedules production, the ERP that reports throughput, and the digital twin that simulates downstream effects. AI Vision Quality is structured as four layers, each handing off to the next without manual intervention.
Layer 1 — Vision & Sensor Layer
Visible-light and infrared cameras, magnetic cord sensors, and thermal and vibration sensors positioned along the conveyor route capture a continuous physical record of belt condition, material flow, and component health.
↓
Layer 2 — Edge AI Processing Layer
Deep-learning inference runs at the edge, classifying defects and conditions in under 20 milliseconds — fast enough that the result is available before the next frame is captured, not in a batch processed later.
↓
Layer 3 — Integration Layer
Classified results and risk scores are written into existing SCADA, historian, MES, and ERP systems through OPC-UA, Modbus, and OSIsoft PI connectors — appearing as additional tags and events inside the interfaces operators already use.
↓
Layer 4 — Cycle Time Command Layer
Cycle time dashboards, threshold alerts, and parameter-adjustment recommendations are generated from the integrated data — giving digital manufacturing directors a single view of where cycle time is being gained or lost across every conveyor zone.
The Cycle Time Dashboard: What Digital Manufacturing Directors Track Daily
Once the integration layer is live, cycle time stops being a monthly report and becomes a metric that moves throughout the shift. The dashboard is built around four core measures — each one a direct output of the vision, SPC, and forecasting layers working together across the conveyor network.
Live
Cycle Time Variance by Zone
Where actual cycle time deviates from baseline, broken down by conveyor zone, updated continuously.
Per Shift
First-Pass Yield Trend
The share of material that proceeds through the circuit without a rework loop, tracked shift over shift.
Rolling 30-Day
Mean Time Between Quality Stops
The interval between unplanned, quality-triggered stoppages — the metric most directly tied to lever three.
Daily
Quality Component of OEE
The portion of overall equipment effectiveness attributable to quality, isolated from availability and performance.
"
Cycle time was a metric we reported monthly, calculated from production totals. We could see that it had moved, but never why, until well after the fact. After connecting the vision and SPC layers into our MES, cycle time became something we could see move in real time — and trace back to a specific zone, a specific variable, a specific shift. The checkpoint inspections that used to add roughly twenty minutes per batch are now continuous background classification. Within the first two quarters, our average cycle time across the main overland conveyor dropped by just over fifteen percent, and we can now attribute exactly which lever delivered which portion of that.
— Digital Manufacturing Director, Iron Ore Beneficiation Plant, 8 Mtpa Conveyor Network
Implementation Roadmap: From Pilot Zone to Plant-Wide Cycle Time Gains
Cycle time programmes succeed when they start narrow and prove the integration before scaling. The roadmap below reflects how digital manufacturing directors typically sequence a rollout — starting with a single conveyor zone and expanding once the data path into MES and ERP is validated.
Weeks 1–3
Pilot Zone Integration
Vision cameras, thermal sensors, and magnetic cord sensors are commissioned on one conveyor zone. The integration layer is connected to the existing historian via OPC-UA, and current cycle time for that zone is baselined against six to twelve months of historical data.
Weeks 4–6
Shadow-Mode Baseline & Validation
The system runs alongside existing inspection and SPC processes without altering production decisions. Forecasted scrap risk and cycle time impact are compared against actual outcomes, producing a site-specific accuracy report for the pilot zone.
Week 7+
Live Cycle Time Dashboard & Closed-Loop Alerts
Cycle time metrics, alerts, and root-cause rankings begin writing into the MES and ERP for the pilot zone. Operators receive lever-specific alerts — inspection bypass, forecast-driven batch isolation, and early-warning maintenance flags — inside their existing interfaces.
Month 3 Onward
Plant-Wide Rollout & Continuous Refinement
Validated configuration is extended to remaining conveyor zones. Models continue refining as they accumulate data across ore blends and seasonal conditions, with cycle time gains tracked cumulatively against the original plant-wide baseline.
Pilot in One Zone · Scale on Validated Data
Map Your Current Cycle Time Against the Three Levers Before You Commit to a Plant-Wide Rollout.
iFactory's pre-deployment assessment uses your existing process and quality records to estimate which lever — inspection elimination, rework reduction, or stoppage prevention — carries the largest share of your recoverable cycle time.
Conclusion
Cycle time on a mining conveyor system is rarely limited by the conveyor itself. It is limited by how long it takes a quality signal — a surface defect, a process drift, a developing thermal anomaly — to become a production decision. Scheduled inspections, static SPC limits, and manual recalibration all introduce delay into that conversion, and the cumulative effect of that delay is the 10–20% of cycle time that AI Vision Quality is designed to recover.
For digital manufacturing directors, the value of this approach extends beyond the cycle time figure itself. Because the platform integrates through standard protocols into existing SCADA, MES, ERP, and digital twin systems, the data generated by vision, SPC, and forecasting layers becomes part of the broader digital infrastructure — feeding the same systems used for production scheduling, OEE reporting, and Industry 4.0 initiatives already underway. Book a demo to see the architecture mapped against your current MES and ERP environment, or talk to an expert about a pre-deployment cycle time assessment for your conveyor network.
Frequently Asked Questions
Your Conveyor Already Tells You Where Cycle Time Is Going. Find Out What Recovering It Is Worth to Your Operation.
iFactory's AI Vision Quality platform for mining conveyor systems — continuous belt monitoring, sub-20-millisecond defect classification, adaptive SPC, root-cause forecasting, and direct MES/ERP integration, all deployed without replacing your existing infrastructure.