Mining conveyor systems generate continuous streams of process data — belt speed, load weight, vibration signatures, thermal readings, material moisture levels — every second of every shift. For most operations, this data goes into a historian and is checked against control limits that were set during a capability study months ago. The ore blend has changed since then. Seasonal moisture has shifted. Feed rates have been adjusted. But the UCL and LCL on the control chart have not moved. Digital Manufacturing Directors running conveyor operations with static SPC are working with a detection system that is structurally misaligned with the reality of their process — and paying for it in false alarms, missed risk signals, and defect rates that refuse to fall below a stubborn baseline.
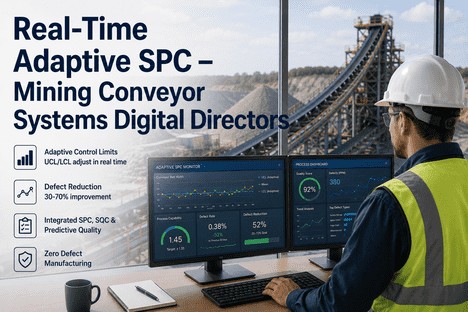
Adaptive SPC limits change the fundamental architecture of that detection system. Instead of a fixed threshold calibrated once and forgotten, dynamic UCL/LCL boundaries update continuously against a rolling model of the current process baseline. Every ore blend transition, every material grade change, every seasonal shift in moisture — the limits absorb it, recalibrate, and continue generating alerts that reflect what out-of-control actually looks like right now, not what it looked like last quarter. This is the quality intelligence shift that digital transformation leaders in mining are executing in 2026 — and the documented outcomes are reshaping what defect elimination means at the plant level.
Adaptive SPC · Dynamic UCL/LCL · AI Scrap Forecasting · Zero Defect Mining
Your Control Limits Are Set for a Process That No Longer Exists. Adaptive SPC Fixes That — in Real Time, Across Every Conveyor Zone.
iFactory's Predictive Quality platform gives Digital Manufacturing Directors self-tuning UCL/LCL boundaries that adapt to material changes, AI scrap forecasts up to 24 hours ahead, and full conveyor belt vision coverage — all from one quality intelligence layer built for mining.
30–70%
Defect reduction achieved when mining conveyor operations switch from static to adaptive SPC control limits
50–70%
Drop in false alarm rates when dynamic UCL/LCL boundaries replace static control limits after ore blend transitions
92%
Forecast accuracy for AI-SPC scrap risk predictions in mineral processing operations — enough to drive primary production decisions
<12 mo
Typical ROI window for adaptive SPC deployments in mining, once the first avoided external failure event is counted in the return
Why Static Control Limits Are a Structural Liability in Mining Conveyor Operations
Static SPC was designed for stable, single-product manufacturing environments where the process baseline does not move between capability studies. Mining conveyor operations are not that environment. A copper flotation circuit processing three ore blends across a quarterly cycle experiences a fundamentally different process baseline with each blend transition. A coal handling conveyor running 24/7 through seasonal moisture swings operates outside the moisture range its control limits were calibrated for more months than it operates inside it. A gold processing operation adjusting belt speed and load weight for different ore hardness grades is, statistically, running a different process every time the grade profile changes.
When these process realities collide with control limits that were set in a different operating regime, two predictable failure modes emerge. The first is alert fatigue: the system generates false alarms as normal variation under the new conditions trips the old thresholds, operators learn to ignore the alerts, and the quality programme loses its credibility as a detection tool. The second is missed detection: a genuine process deviation in the new operating regime looks like nothing unusual against control limits calibrated for conditions that no longer apply, and the scrap signal passes unseen until the downstream quality test confirms it hours later.
Digital Manufacturing Directors who have diagnosed this pattern in their operations consistently describe the same finding: the quality data was there. The problem was that the system was not reading it against the right baseline. Adaptive SPC limits are the architectural fix — not a configuration change or a recalibration cadence, but a fundamentally different model of what a control limit is and how it should behave in a dynamic mining environment.
The Three Failure Modes of Static SPC in Mining — and What Adaptive Limits Do Instead
Alert Fatigue from False Alarms
Static limits generate false alarms every time process conditions shift legitimately. Operators who respond to three false alarms before breakfast stop responding to the fourth alert — which may be the one that matters. Alert credibility collapses over weeks, not months.
Adaptive fix: Limits transition with the process. Regime shifts are absorbed — not alarmed.
Missed Detections in New Regimes
A genuine defect-risk deviation in the current process regime may look like normal variation against a control limit calibrated for the previous regime. The system shows green while the process is building toward a quality failure the downstream test will confirm four hours later.
Adaptive fix: Limits always reflect current baseline. Deviations stand out against what normal looks like now.
Manual Recalibration Gaps
Quarterly capability studies leave a process running against outdated limits for weeks after conditions change. And when recalibrations do happen, documentation is often incomplete — creating audit exposure when the quality record does not support the current control threshold.
Adaptive fix: Continuous recalibration with full audit log — every limit change timestamped automatically.
How Adaptive UCL/LCL Boundaries Work in Practice on Mining Conveyors
The mechanics of adaptive SPC are built on a continuously updated statistical model of the current process rather than a threshold fixed at the last capability study. The system monitors a rolling window of recent process data — configurable from hours to days depending on the operation's blend cycle — and recalculates the UCL and LCL as the process baseline shifts. When an ore blend transition occurs, the platform detects the regime change, enters a managed transition window to prevent false alarms during stabilisation, and then resets to the new baseline before resuming full alert sensitivity.
In practice, this means Digital Manufacturing Directors see control charts that always reflect the real operating envelope of the current process. A belt speed control limit on a system processing high-moisture oxide ore is set differently than the limit for the dry sulphide ore running the following week — and that difference is calculated by the system, not by an engineer submitting a recalibration request. Every recalculation is logged automatically with the triggering condition, the statistical basis, and the timestamp, producing an audit-ready documentation trail with zero manual effort.
Adaptive SPC in Action — The Four-Stage Limit Response Cycle
1
Baseline Monitoring
System continuously monitors a rolling window of process data — belt speed, load, vibration, thermal, moisture — and maintains a live statistical model of what normal looks like in the current ore blend and operating condition.
2
Regime Shift Detection
When ore blend changes, feed rate shifts, or moisture variation moves the baseline, the ML model detects the regime transition — distinguishing it from an actual defect-risk deviation — and initiates a managed transition protocol to prevent false alarms.
3
Limit Recalibration
New UCL and LCL are calculated from the emerging baseline using the same statistical methodology — but against the new operating conditions. The transition window closes and full alert sensitivity resumes once the baseline has stabilised in the new regime.
4
Automatic Documentation
Every limit recalculation is logged automatically — prior limits, new limits, triggering condition, timestamp, and statistical basis — producing the ISO 9001 audit documentation trail with zero manual effort across the full operational history.
The Digital Manufacturing Director's Quality Stack: What iFactory Delivers Across Three Decision Horizons
Digital transformation leaders in mining are not looking for a better control chart. They are looking for a quality intelligence layer that connects real-time belt monitoring, predictive scrap risk signals, and programme-level visibility into one coherent decision architecture — one that makes actionable information available at the right speed for each decision type. iFactory's platform is structured around three decision horizons that match how quality intelligence actually gets used in a mining conveyor operation.
Now
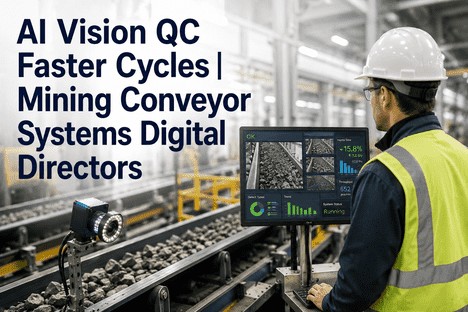
Real-Time Belt and Material Intelligence
Machine vision cameras running the length of the conveyor route deliver 100% belt coverage across every shift — detecting surface cracks, longitudinal tears, splice degradation, foreign object contamination, edge wear, and material segregation in real time. Neural network classification achieves above 98% accuracy in high-dust mining environments, supplemented by infrared imaging in zones where visible-light cameras are degraded. Every detection is timestamped, classified, and logged — creating a complete inspection record for every run, every blend, and every material transition that replaces scheduled manual inspections with continuous automated coverage.
100% belt coverage
98%+ defect detection accuracy
Infrared + visible-light fusion
Foreign object alerts
Next 24 Hours
Predictive Scrap Risk Forecasting
The predictive ML model is trained on historical pairings of conveyor process variable patterns — belt speed, material load, vibration signatures, thermal readings, and vision-detected surface conditions — matched to downstream quality test outcomes. When the current combination of signals matches a historical pattern associated with an off-spec result, the system generates a scrap risk forecast before the quality test is run. For Digital Manufacturing Directors, this creates a decision window of hours, not minutes: time to isolate the at-risk batch, adjust processing parameters for the next run, hold material for additional sampling, or authorise a production change before more product is committed to a failing trajectory. Documented forecast accuracy in comparable mineral processing deployments reaches 92% — a performance level that converts predictive output from an advisory signal into a primary production decision input.
Up to 24-hour lead time
92% forecast accuracy
Batch isolation workflow
Multi-variable signal fusion
Programme Level
Executive Quality Visibility and Audit Documentation
The executive dashboard aggregates defect frequency, scrap rate trends, Cpk performance by conveyor zone, and COPQ financial impact into a single programme-level view — designed for directors who need strategic visibility, not machine-level process data. Scrap rates are displayed against baseline and target, segmented by material grade, ore blend, and time period. CAPA effectiveness tracking links every corrective action to the alert that generated it and monitors subsequent defect rates to confirm recurrence prevention. ISO 9001 audit documentation — control limit histories, defect event logs, CAPA records, and Cpk trend exports — is generated automatically and exportable for any date range with a single click.
COPQ trending by category
Closed-loop CAPA tracking
One-click ISO 9001 export
Cpk by conveyor zone
Your Process Knows When the Next Defect Is Coming. Adaptive SPC Reads the Signal Before It Becomes Scrap.
iFactory fuses adaptive control limits, machine vision, predictive scrap forecasting, and executive-level quality visibility into one platform — deployed without replacing your existing historian, SCADA, or DCS infrastructure.
The COPQ Calculation That Changes the Conversation About Defect Reduction Investment
Most defect reduction conversations in mining operations begin and end with scrap rate percentage. It is a useful metric but a partial view of the cost. The American Society for Quality's Cost of Poor Quality framework documents that COPQ reaches 15–20% of total revenue when all four cost categories are fully accounted for: internal failure costs, external failure costs, appraisal costs, and prevention costs. In a mining conveyor operation generating $100M annually, that represents $15–20M in recoverable margin — not a quality department KPI, but a board-level financial performance metric that is directly attributable to quality failures and the detection systems built to catch them after the fact.
Internal Failure Costs
Scrap material, batch re-processing, rework, conveyor re-inspection, and production hold costs incurred before product leaves the plant. The most visible COPQ category — and the one adaptive SPC most directly reduces by detecting the risk before the defect is produced rather than after the quality test confirms it.
External Failure Costs
Customer rejections, quality claims, contractual penalty clauses, and reputational cost when defects reach the customer. External failure costs typically run 5–10 times higher than the equivalent internal failure — making defect escape prevention the highest-value outcome of the predictive forecast capability.
Appraisal Costs
Manual inspection labour, planned belt shutdowns for inspection, sample testing programme costs, and quality audit preparation time. Vision-based continuous monitoring converts a significant portion of appraisal cost from labour-intensive scheduled activity to automated coverage — with higher detection reliability and a complete record the manual programme could never produce.
Prevention Costs
Quality system maintenance, SPC administration, recalibration activities, and training costs. Adaptive SPC with automated documentation reduces the administrative overhead of running the prevention programme, making the total prevention investment both more efficient and measurably more effective than the static alternative.
We identified a repeating pattern in our conveyor data — a specific combination of belt load increase and speed reduction that preceded downstream quality rejections on three separate production runs over six weeks. Each rejection cost us a full batch hold and retest programme. After deploying adaptive SPC and connecting it to the scrap forecast model, we flagged the pattern in real time on the fourth occurrence, adjusted the operating protocol before the at-risk batch entered the circuit, and recorded zero rejections in that category for the following quarter. The pattern had been in the data every time. We just had not been reading it against the right baseline.
— Digital Manufacturing Director, Hard Rock Mining Operation, Multi-Stage Conveyor System, 6 Mtpa Throughput
What Integration Looks Like: From Existing Historian to Live Adaptive SPC in Three Phases
Digital Manufacturing Directors evaluating adaptive SPC consistently prioritise two questions above all others: how quickly will the system generate forecasts the plant can act on, and what does integration with existing infrastructure require? Both have straightforward answers for operations with standard historian and SCADA environments.
iFactory connects to existing process historians and control systems through standard industrial protocol connectors — OPC-UA, Modbus, and historian APIs including OSIsoft PI and Wonderware — without modifying the existing control architecture. The platform reads process variable streams in real time and writes predictive alerts back to the SCADA operator view through the same protocol layer, so operators see forecast alerts in the interface they already use. LIMS integration follows the same approach: quality test results are read as they are entered, and the platform uses them to continuously update the predictive model, closing the loop between forecast and confirmed outcome automatically.
PHASE 1 — WEEKS 1–3
Data Integration and Vision Commissioning
Process historian connection, LIMS quality record pairing, machine vision commissioning with dust-adaptive image enhancement, and thermal sensor integration. Six months of paired process-to-quality history is sufficient for initial model training; twelve to eighteen months produces stronger forecast accuracy during ore blend transitions.
Output: Full sensor stack live. Baseline quality record established.
PHASE 2 — WEEKS 4–6
Shadow Mode Validation
The adaptive SPC model and predictive scrap forecasts run in parallel with the existing quality programme — generating alerts without driving production decisions. The quality team validates forecast accuracy against actual test outcomes over two to four weeks, producing the documented accuracy data needed to authorise transition to primary decision input status.
Output: Site-specific forecast accuracy report with validated performance data.
PHASE 3 — WEEK 7+
Live Deployment and COPQ Tracking
Adaptive SPC alerts and scrap forecasts become primary production decision inputs. COPQ tracking activates — scrap rate, defect frequency, and financial impact tracked continuously against pre-deployment baseline. Executive dashboard and ISO 9001 documentation are live from day one of this phase.
Output: Live COPQ reduction dashboard with full audit documentation active.
Conclusion
The case for adaptive SPC in mining conveyor operations is not about replacing a working quality programme — it is about resolving the structural mismatch between how mining processes actually behave and what static control limits are capable of detecting. Ore blend transitions, seasonal moisture variation, feed rate changes, and material grade shifts are not edge cases in mining. They are the operating norm. Static UCL/LCL boundaries were never designed to handle them, which is why the false alarm rates and missed detection events that result from deploying them in this environment are so consistent across operations.
Adaptive SPC limits close that gap at the architecture level — not through more frequent recalibrations or more SPC administrators, but through a system that continuously updates its own baseline against the current process reality and generates alerts that always reflect what out-of-control actually looks like right now. The documented outcomes across mineral processing operations deploying this approach — 30–70% defect reduction, 50–70% false alarm reduction, sub-12-month ROI, and ISO 9001 documentation that generates itself — are not projections. They are the reported experience of Digital Manufacturing Directors who have made this transition and measure the difference against the baseline their static systems were producing.
iFactory's Predictive Quality platform is built for mining conveyor operations where defect elimination — not defect management — is the operating standard. Book a Demo to see adaptive SPC configured for your conveyor system and ore profile, or talk to an expert about a free COPQ reduction assessment for your operation.
Frequently Asked Questions
Every Ore Blend Shift Is Rewriting the Boundary Between In-Control and Out-of-Control. Adaptive SPC Reads That Rewrite in Real Time.
iFactory's Predictive Quality platform for mining conveyor systems — adaptive UCL/LCL limits, machine vision belt monitoring, 24-hour scrap forecasting, and ISO 9001 documentation, deployed without replacing your existing control infrastructure.