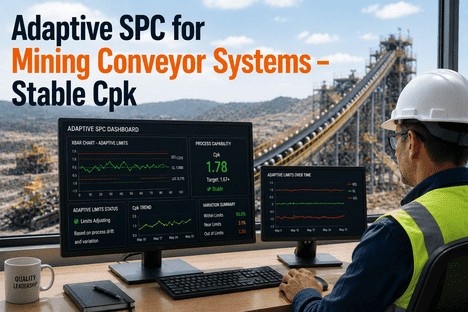
Adaptive SPC for Mining Conveyor Systems – Stable Cpk
By Grace on June 13, 2026
Cpk is the metric that quality leaders trust to measure process capability, but it has a structural vulnerability that most SPC implementations ignore: the calculation is only as current as the control limits it depends on. When a conveyor system's ore feed changes from a hard to a soft stockpile, when a new binder batch arrives with different binding characteristics, or when the belt speed is adjusted for a throughput increase, the normal operating range shifts — but static control limits do not shift with it. The Cpk value that was 1.67 last month drifts to 1.32 this month, then to 1.08 the month after, and the quality leader does not see the degradation because the Cpk report still references the old specification range against a process that is no longer operating in the same regime. Adaptive SPC limits eliminate this vulnerability by recalibrating control boundaries continuously, so Cpk stays stable because the limits reflect what the process is doing right now — not what it was doing when the last capability study was filed. This is the quality leader's guide to deploying adaptive SPC limits for mining conveyor systems and sustaining Cpk 1.67+ through every material change, recipe transition, and process regime shift.
Quality Leaders Who Sustain Cpk 1.67+ Across Ore Changes, Recipe Transitions, and Conveyor Speed Adjustments Have One Thing in Common: Their Control Limits Move With Their Process.
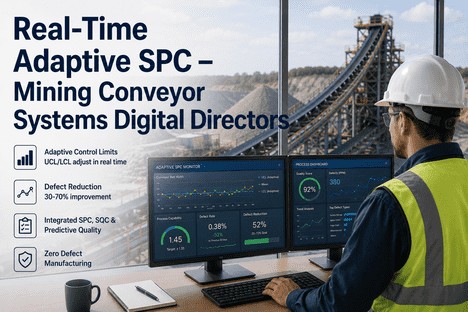
iFactory's adaptive SPC platform gives quality leaders dynamic control limits that recalibrate continuously — maintaining stable Cpk by ensuring every alert reflects a genuine deviation from the current operating norm, not from the norm of three months ago.
The Cpk Decay Problem: How Static Limits Create a False Sense of Stability
Every mining conveyor system experiences process drift. Ore hardness varies between stockpiles. Moisture content shifts with seasonal weather patterns. Belt speed and material loading rates change with production targets. Binder batch efficacy fluctuates with natural deposit variation. Each of these changes alters the statistical distribution of the quality parameters the SPC system monitors — but static control limits do not adjust. The result is a capability report that tells the quality leader the process is performing at Cpk 1.67 when the actual capability against current operating conditions has already fallen to 1.2. The Cpk report is not wrong in isolation — it is calculating against the original specification limits. But it is misleading as a management decision tool because it does not reflect whether those specification limits are still appropriate for the current process regime. Adaptive control limits solve this by recalibrating the UCL and LCL to the current process baseline, so the Cpk value the quality leader sees is the Cpk the process actually delivers.
Cpk Stability Timeline: Static Limits vs. Adaptive Limits Over a 12-Week Ore Blend Transition
Static Limits
1.67
1.52
1.38
1.21
1.08
0.95
Adaptive
1.67
1.65
1.68
1.66
1.67
1.65
Week 1Week 3Week 5Week 7Week 9Week 11
What happened: At week 4, the ore blend shifted from a hard hematite-dominant feed to a softer goethite-dominant feed. Static limits did not adjust. Cpk decayed each week as the process operated under conditions the limits were not calibrated for. Adaptive limits recalibrated within the transition window and maintained Cpk at or above 1.65 throughout.
Three Triggers That Cause Cpk to Drift When Limits Stay Static
A
Ore Blend and Feed Variation
Hardness, moisture, and particle size distribution change with every stockpile transition. The mean and variance of every quality parameter shift. Static limits do not recalibrate, so the Cpk calculated against the original limits becomes progressively less representative of actual process capability.
B
Conveyor Speed and Throughput Changes
When belt speed increases to meet production targets, the residence time on inspection zones changes, material bed depth shifts, and the statistical distribution of weight-per-meter and size segregation patterns all change. Limits calibrated at 3 m/s generate false alarms at 4.5 m/s.
C
Binder and Additive Batch Variability
Bentonite binder efficacy varies between batches. A weak batch requires higher addition rates to achieve the same green strength. Static limits on addition rate see the higher dosage as an outlier when the actual root cause is the binder batch change — which the limits do not account for.
When Cpk Drifts Because Limits Stay Static, the Quality Leader Is Managing a Capability Report That No Longer Reflects the Process. Adaptive Limits Make Every Cpk Calculation Current.
iFactory builds regime change detection directly into the limit calculation engine — so every ore blend transition, conveyor speed adjustment, and binder batch change triggers a controlled limit recalibration that keeps Cpk measurements accurate and actionable.
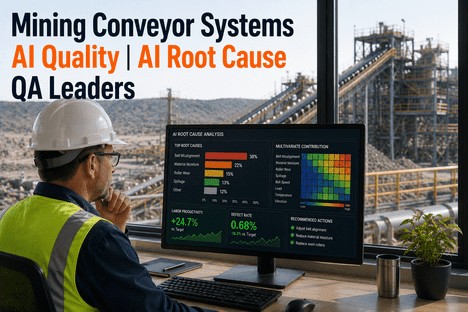
The Adaptive Limit Engine: How Self-Tuning UCL and LCL Maintain Cpk Stability
The iFactory adaptive SPC engine maintains Cpk stability through a four-stage continuous cycle that runs without quality leader intervention. The engine monitors the process baseline in real time, detects regime changes by comparing current parameter distributions against the active model, transitions limits through a controlled window when a new regime is confirmed, and validates that the recalibrated limits maintain Cpk at or above the target threshold. Each stage feeds into the next, creating a closed loop that keeps control limits aligned with current process conditions at all times.
01
Continuous Baseline Monitoring
Rolling statistical model of current process parameters
The engine maintains a rolling window of the last N observations for every monitored parameter — belt speed, motor load, material moisture, binder addition rate, and size distribution. The mean, standard deviation, and distribution shape are recalculated continuously. When the process is stable, limits tighten to increase sensitivity to genuine drift.
02
Regime Change Detection
Statistical comparison against active baseline model
When the current parameter distribution deviates significantly from the rolling baseline — an ore blend change shifts the mean moisture content by 1.2 standard deviations, a conveyor speed increase alters the belt load profile — the engine flags a regime change. It distinguishes between common-cause variation within the current regime and a genuine shift to a new operating state.
03
Controlled Limit Transition
Gradual recalibration over configurable window
When a new regime is confirmed, the engine does not snap limits to the new baseline instantly. Limits transition gradually over a configurable window — typically 30 to 90 minutes for conveyor system transitions — allowing operators to adjust to the new normal without generating false alarms during the transition. The transition rate is calculated to balance responsiveness with stability.
04
Cpk Validation and Reporting
Automatic Cpk recalculation with audit trail
After limits are recalibrated, Cpk is recalculated against the new UCL and LCL. The quality leader sees the current Cpk alongside the previous value and the trend direction. Every recalibration is logged with a timestamp, triggering event, previous and new limit values, and the statistical rationale — creating the audit trail that ISO 9001 requires.
1.67+
Cpk sustained continuously through ore blend transitions, conveyor speed changes, and binder batch variation with adaptive control limits
50–70%
False alarm reduction when adaptive ML control limits replace static limits — restoring operator alert credibility on conveyor quality monitoring
92%
Defect prediction accuracy achieved by AI-powered SPC systems analysing hundreds of conveyor process parameters simultaneously
15%
Overall yield improvement documented when AI-SPC systems predict issues ahead and adaptive limits maintain accurate process baselines
How Adaptive Limits Transform the Quality Leader's Dashboard
Cpk Trend View
Live Cpk by Quality Characteristic With Limit Recalibration History
Every quality parameter displays its current Cpk, the 7-day trend, and the projected Cpk at current trajectory. Each adaptive limit recalibration is marked on the timeline so quality leaders see exactly when limits moved and what triggered the adjustment.
Limit Change Log
Full Audit Trail of Every Limit Adjustment
Every adaptive limit recalculation is recorded with timestamp, trigger event, previous and new UCL/LCL values, data window used, and the statistical algorithm applied. Exportable in structured format for ISO 9001 audit documentation.
Regime Change Alerts
Detected Process Regime Shifts With Transition Status
The dashboard displays each detected regime change — ore blend transition, conveyor speed change, binder batch change — with the current transition window status, the parameters affected, and the time remaining until the new baseline limits are fully active.
False Alarm Rate
Live False Alarm Rate vs. Baseline
A live comparison of false alarm rates before and after adaptive limit deployment. Quality leaders track the reduction in nuisance alerts and the corresponding increase in operator response rates to genuine events.
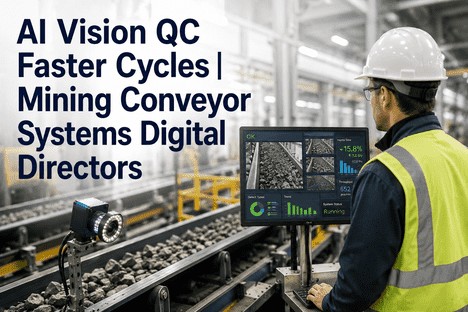
Vision Integration
Machine Vision Data as Adaptive SPC Input
Conveyor vision inspection data — belt surface condition, material flow characteristics, splice integrity scores — feeds directly into the adaptive limit engine as additional quality data streams, enabling limit adjustments based on visual quality indicators alongside process parameters.
CAPA Effectiveness
Closed-Loop Corrective Action Tracking With Limit Context
Every CAPA record is linked to the adaptive limit state at the time of the alert. The system monitors the same parameter combination for recurrence and automatically flags ineffective corrective actions — with the limit recalibration history providing the process context.
Our Cpk reports looked stable because they were calculated against the original specification limits we set during commissioning. What the reports did not show was that the process had shifted significantly over six months of ore blend variation, and our control limits had never been recalibrated. When we deployed adaptive limits, the Cpk on our conveyor discharge quality dropped from a reported 1.72 to an actual 1.21 on day one — because the limits now reflected the process as it was, not as it was at commissioning. Twelve weeks later, after the adaptive system helped us identify and correct the root cause of the drift, the real Cpk was 1.68. We were not managing our process before. We were managing a report that had lost touch with the process.
— Quality Assurance Manager, Iron Ore Conveyor System, Western Australia — Overland Conveyor Network, 45 km Total Length
Conclusion
Cpk stability in mining conveyor quality programmes is not a function of how well the original specification limits were chosen. It is a function of how well the control limits track the process as it evolves. When ore blends change, conveyor speeds adjust, binder batches vary, and seasonal moisture shifts occur, static control limits become progressively less representative of current process conditions — and the Cpk values that quality leaders rely on for decision-making become progressively less accurate. Adaptive SPC limits eliminate this structural vulnerability by recalibrating continuously, maintaining stable Cpk by ensuring that every measurement is calculated against limits that reflect the current process regime.
The evidence from mineral processing operations that have deployed adaptive limits is consistent: Cpk is sustained at or above 1.67 through material changes that would have caused static-limit Cpk to decay to 1.2 or below within weeks. False alarm rates drop by 50 to 70 percent because the limits no longer fire alerts on legitimate process regime shifts. Operator response rates return to near 100 percent because every alert that fires reflects a genuine deviation from the current operating norm. And the audit trail — every limit recalibration logged with its trigger event, statistical rationale, and impact on Cpk — provides the documented evidence that ISO 9001 requires and that customer quality audits demand.
The quality leaders who sustain Cpk 1.67+ through every process transition are not the ones who chose better specification limits at commissioning. They are the ones who deployed control limits that move with the process. iFactory's adaptive SPC platform is designed for quality leaders in mining conveyor operations who need to maintain stable Cpk through every ore blend, conveyor speed, and binder batch change. Book a Demo to see adaptive limits configured for your conveyor system parameters and material profile, or talk to an expert about a free Cpk stability and audit-readiness assessment for your mining conveyor quality programme.
Frequently Asked Questions
The adaptive engine uses a two-stage statistical test to distinguish between common-cause variation within the current regime and a genuine regime shift. The first stage monitors the running mean and standard deviation of each parameter against the active baseline distribution. A deviation beyond a configurable threshold — typically 1.5 to 2.5 sigma — triggers a regime change alert. The second stage evaluates whether the deviation persists across a minimum number of consecutive observations (configurable, typically 5 to 10 data points) to confirm the shift is sustained rather than transient. Until the regime change is confirmed, limits remain at the current baseline to avoid over-responding to random variation. Once confirmed, the transition window opens and limits begin recalibrating at the configured rate. This two-stage approach eliminates the false limit adjustments that simple threshold-based systems generate during normal process fluctuation. Talk to an expert about configuring regime change detection thresholds for your conveyor system parameters.
ISO 9001 Clause 7.5 requires documented information to be controlled and maintained, and Clause 10.2 requires evidence of corrective action effectiveness. Every adaptive limit recalculation generates a structured record containing the timestamp, the triggering event (ore blend change detected, conveyor speed transition, statistical baseline shift confirmed), the previous UCL and LCL values, the new UCL and LCL values, the data window used for recalculation, and the algorithm applied. This log is searchable by product grade, process zone, parameter name, and date range, and exportable in a structured format suitable for direct inclusion in QMS documentation. The argument that adaptive limits are less defensible than static limits in an ISO 9001 context is backwards: limits calibrated on process data that is three or six months old are demonstrably less defensible than limits that are recalculated continuously from current data with every recalculation fully documented. Auditors reviewing the adaptive limit history see a controlled, transparent, statistically justified process — not a set of limits that may or may not still be appropriate for the current operating regime. Book a Demo to see the adaptive limit change log format and export options.
Adaptive limits can be deployed on a single conveyor line, a single process zone, or a single quality parameter as a pilot deployment before expanding to the full operation. The iFactory platform supports per-parameter adaptive limit configuration — meaning a quality leader can enable adaptive UCL and LCL on conveyor belt speed and material moisture while keeping static limits on all other parameters, then expand adaptive coverage line by line as confidence in the system grows. The typical deployment sequence is: pilot on one conveyor line with two to three quality-critical parameters for four to six weeks, validate Cpk stability and false alarm reduction against the baseline, then expand to additional lines and parameters in phased rollouts. Shadow mode deployment — where adaptive limits run in parallel with existing static limits without driving alerts — provides comparison data that quality leaders can use to demonstrate the improvement before committing to the transition. Talk to an expert about structuring a phased adaptive limit deployment for your conveyor system network.
Machine vision inspection data integrates into the adaptive limit engine as an additional quality data stream alongside process parameters and LIMS test results. Vision-detected defects — belt surface cracks, edge wear, splice deterioration, material carryback, and flow anomalies — are logged with timestamps and severity scores, and the adaptive engine calculates separate control limits for each vision metric. When vision defect frequency trends upward, the adaptive limits tighten on the relevant process parameters — belt tension, speed, or material loading rate — before the physical defect occurs. This creates a cross-modal control loop where the vision system detects surface-level indicators of developing problems, and the adaptive limit engine adjusts process parameter limits to prevent the defect from reaching the quality threshold. For quality leaders deploying conveyor vision inspection, this integration eliminates the common problem of managing vision data and SPC data as separate systems with separate alerting protocols. Book a Demo to see vision-integrated adaptive SPC configured for conveyor belt surface quality monitoring.
When Cpk Drifts Because Limits Stay Static, the Quality Leader Is Flying Blind. Adaptive Limits Keep Every Capability Calculation Current. Get a Free Cpk Stability and Audit-Readiness Assessment.
iFactory's adaptive SPC platform for mining conveyor quality leaders — dynamic UCL and LCL that recalibrate continuously, regime change detection that distinguishes process shift from random variation, controlled transition windows that eliminate false alarms during changeovers, and ISO 9001-aligned audit documentation generated automatically from every limit recalculation.