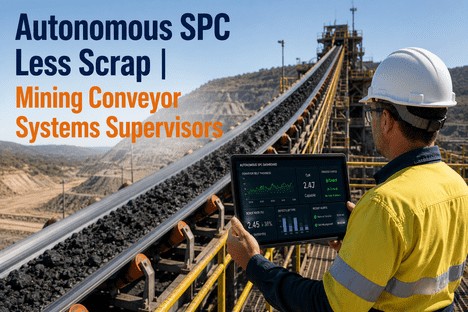
The control chart on the supervisor's screen shows every parameter inside the green zone. Motor current is within UCL and above LCL. Belt speed is centred. Load distribution looks stable. The process appears to be in control. Three hours later, an idler seizes, the belt tracks off, and the scrap event is logged. The post-event investigation reveals that motor current had been drifting upward for 18 hours — but each individual reading stayed inside the static control limits that were calibrated during last quarter's capability study. The limits did not move because static SPC cannot distinguish between a process that has shifted and a process that is degrading within outdated boundaries. This is the defining limitation of static SPC on mining conveyor systems: control limits that were set weeks or months ago do not reflect what the belt is doing today. When material hardness changes, load distribution shifts, or idler degradation begins, the normal operating range for motor current, belt speed, and vibration amplitude all change simultaneously. Static limits stay fixed. They fire false alarms on parameters that are legitimately operating at new setpoints, and they miss genuine drift because the belt has entered a new regime where the old limits no longer bound the actual risk zone. Adaptive SPC limits close this gap. They move with the process — recalculating UCL and LCL continuously against a rolling baseline — so the supervisor sees alerts that reflect what the conveyor is doing right now, not what it was doing three months ago. This is the shift supervisor's practical guide to deploying adaptive SPC limits on mining conveyor systems and sustaining Cpk at 1.67 or above.
Dynamic UCL/LCL · Rolling Baseline · Regime Change Detection · Live Cpk Trending
Supervisors Who Sustain Cpk 1.67+ Do Not Use Limits From Last Quarter. They Use Limits From This Shift.
iFactory's adaptive SPC platform recalculates UCL and LCL continuously against a rolling process baseline — so control limits reflect the conveyor as it is running right now, with every alert representing genuine deviation from the current operating norm.
1.67+
Cpk sustained continuously when adaptive control limits replace static limits on monitored conveyor parameters — with limits that tighten and widen as process conditions change
50-70%
False alarm reduction when adaptive ML control limits replace static limits — restoring operator alert credibility and ensuring every alert reflects a genuine event
3-5x
More out-of-control signals generated by standard control charts on mineral processing data versus adaptive methods — because static limits react to autocorrelation, not real drift
The Three Failure Modes of Static SPC Limits on Mining Conveyors
Static control limits on conveyor systems fail in three distinct ways. Each failure mode produces a different kind of quality blind spot, and all three operate simultaneously on every belt segment where limits were set during a capability study that no longer reflects current operating conditions. Understanding these failure modes is the first step in building the case for adaptive limits.
F1
False Alarms During Material Transitions
The conveyor feed changes from a hard ore seam to a softer one. Motor current drops 8 percent. Belt speed remains constant. The static UCL and LCL, set when the belt was running harder ore, now show the motor current as running near the LCL. The control chart generates a Zone C violation. The operator investigates, finds nothing wrong, and clears the alarm. Over three material transitions, the same pattern repeats. The operator learns to ignore the control chart. The static limit created a false alarm because it could not distinguish between a feed change that legitimately shifts the motor current baseline and a process deviation that represents genuine risk.
Adaptive fix: Limits recalibrate to new motor current baseline when material change is detected.
F2
Missed Drift From Gradual Degradation
An idler begins to seize. Motor current rises 0.3 percent per hour. Belt speed drops 0.1 percent per hour. Each individual reading stays inside the static control limits because the limits were set wide enough to accommodate the full range of operating conditions. The drift continues for 36 hours. By the time the motor current finally breaches the static UCL, the idler has already caused secondary damage to the belt bottom cover, the adjacent idlers are overheating, and the scrap event requires a belt section replacement. The static limit detected the breach — but only after the damage was done. The drift was visible in the data for 36 hours. The static limit had no mechanism to detect a trend.
Adaptive fix: Western Electric Rules detect trending parameters against adaptive limits on reading three or four.
F3
Cpk Reported Against the Wrong Baseline
The Cpk number on the daily report is 1.42. It looks acceptable. But the Cpk was calculated against the specification range using a process mean and standard deviation from last quarter's capability study. The process mean has shifted 6 percent since then because of liner wear and a change in feed material. The actual Cpk against the current process distribution is 1.08 — below the 1.33 warning threshold — but the reported number does not reflect it. The supervisor sees Cpk in the acceptable range and does not investigate. The scrap rate climbs for three weeks before a manual investigation identifies the root cause that the Cpk number should have flagged on day one.
Adaptive fix: Cpk calculated continuously against rolling baseline. True capability visible in real time.
F4
Operator Alert Desensitisation
The accumulated effect of failure modes one through three is an operator team that has learned to treat SPC alerts as noise. When 60 to 80 percent of alerts during material transitions, degradation periods, and baseline shifts are false positives, the credibility of the alert system is destroyed. The one genuine drift event that fires during a shift looks identical to the twelve false alarms that preceded it. The operator clears it without investigating. The scrap event that follows is classified as unpredictable, but it was not. The alert system predicted it. The operator had learned not to respond.
Adaptive fix: False alarm rate drops 50-70%. Every alert that fires reflects a genuine process event requiring response.
How Adaptive SPC Limits Work: The Three-Step Recalculation Cycle
Adaptive SPC does not replace the Shewhart control chart. It replaces the static UCL and LCL calculation with a dynamic model that updates as process conditions change. From the supervisor's perspective, the chart still looks the same. What changes is that the limits actually reflect the current process state rather than a months-old baseline. The recalibration happens continuously through a three-step cycle that executes on every monitored parameter.
Step 01
Rolling Baseline Estimation
The system maintains a rolling statistical model for every monitored parameter on every belt segment. The baseline window is configurable — typically 4 to 8 hours of recent production data — and advances continuously as new data points arrive. For each parameter, the rolling mean and rolling standard deviation are recalculated with every new reading, giving the system an accurate picture of where the process is operating right now. The rolling baseline automatically accounts for material changes, load shifts, and degradation patterns that would distort a static baseline.
The baseline moves with the process. Static limits cannot do this.
Step 02
Dynamic UCL/LCL Recalculation
UCL and LCL are recalculated at plus or minus three sigma from the rolling mean. When the process is stable and variability is low, sigma shrinks and the limits tighten — giving the supervisor earlier warning of any deviation. When a known high-variability period occurs — material change, start-up after maintenance, blend transition — sigma widens appropriately and the limits adjust to accommodate the legitimately wider distribution without generating false alarms. The result is a control chart where the limits are never wider than they need to be and never narrower than the process requires. Western Electric Rules run against these adaptive limits to detect trending patterns before individual readings breach any boundary.
Limits tighten when stable. Limits widen when variability increases. No manual reconfiguration.
Step 03
Live Cpk Calculation Against Current Limits
Cpk is calculated continuously using the rolling mean and standard deviation against the specification range. The supervisor sees the true Cpk for every parameter on every belt segment — not a number from last week's report, but a live index that reflects the current process capability. When Cpk trends downward from 1.67 toward 1.33, the system generates an investigation alert before capability crosses the warning threshold. The Cpk/Ppk gap is also tracked: when Ppk diverges significantly from Cpk, the system flags instability that short-term analysis would miss — a pattern that typically indicates progressive degradation such as idler wear or belt cover deterioration.
Cpk is a live leading indicator. Falling Cpk triggers investigation before scrap is produced.
Rolling Baseline · Self-Tuning UCL/LCL · Live Cpk · Adaptive Western Electric Rules
Static Limits Tell You What Happened Last Quarter. Adaptive Limits Tell You What the Belt Is Doing Now.
iFactory's adaptive SPC platform recalculates control limits continuously — so every alert on the supervisor's screen reflects a genuine deviation from the current operating norm, not a false alarm from an outdated baseline.
What the Supervisor Sees on the Adaptive SPC Dashboard
The adaptive SPC dashboard is designed around a single objective: show the supervisor whether the process is in control right now, where capability is trending, and which parameter requires attention — in the fewest possible glances.
SPC View 01
Live Control Charts with Adaptive Limits per Belt Segment
Every monitored parameter per belt segment displays a live control chart with UCL and LCL that adjust in real time as the rolling baseline updates. The supervisor sees the current reading, the adaptive limits, and the Western Electric Rules status — which rules are active, which parameters are trending, and how many consecutive readings are approaching a limit. A motor current reading inside the adaptive limits but showing four consecutive readings trending upward generates a rule alert before the limit is approached, let alone breached.
Supervisor action: Investigate parameters with active Western Electric Rule alerts before limits are breached.
SPC View 02
Live Cpk by Parameter With Trend Direction
Cpk is displayed for every parameter with the current value, the 8-hour trajectory, and the projected Cpk at the current rate of change. A motor current Cpk of 1.55 trending downward with a projected 6-hour value of 1.31 generates an investigation alert before the Cpk crosses the 1.33 warning threshold. The supervisor sees which parameter is driving the capability decline and whether the decline is accelerating or stabilising — without opening a single trend chart manually.
Supervisor action: Intervene on parameters with falling Cpk trajectory before capability degrades.
SPC View 03
Limit Change Log With Statistical Rationale
Every adaptive limit recalculation is logged automatically with the timestamp, the triggering event (material change, baseline shift, transition window), the previous limit values, the new values, and the statistical basis for the recalculation. The supervisor can review the limit change history for any parameter on any belt segment. This log serves as the definitive record for quality audits and internal reviews: it demonstrates that the control limits were maintained continuously and that every adjustment was justified by the process data at the time.
Supervisor action: Review limit change history for any parameter. Export audit record on demand.
SPC View 04
Cpk/Ppk Gap Monitor — Leading Indicator of Instability
The system tracks both Cpk (short-term capability calculated within the rolling window) and Ppk (long-term capability calculated over a wider historical window). When Cpk is significantly higher than Ppk, the process performs well in short windows but degrades over longer periods — exactly the pattern produced by progressive idler wear, belt deterioration, or material hardness trends. A Cpk/Ppk gap above 0.25 triggers an investigation alert automatically, allowing the supervisor to address the root cause before it produces a scrap event.
Supervisor action: Investigate Cpk/Ppk divergence as leading indicator of progressive degradation.
The static control limits on our conveyor control charts had not been updated since the last capability study nine months ago. The ore blend had changed three times since then. The belt had worn. The idlers had degraded. But the limits stayed exactly where they were. We were getting false alarms every shift during material transitions, and we were missing real drift because the limits were too wide to detect gradual changes. The operators stopped looking at the charts. They had learned that the alerts meant nothing. Adaptive SPC changed this within the first week. The limits adjusted to the current operating conditions on day one. The false alarms stopped. And on day three, the system detected a motor current trend that was visible in the adaptive chart but invisible in the static one. We replaced a seizing idler before it caused belt damage. That was the moment the operators started trusting the control charts again.
— Shift Supervisor, Copper Mine Conveyor Network — Overland and In-Plant Belt System, 14 km Total Conveyed Length
Conclusion
Cpk instability on mining conveyor systems is not a process problem. It is a control limit methodology problem. When UCL and LCL are set during a quarterly capability study and never updated until the next one, the control chart becomes a historical document rather than a real-time process monitor. The limits reflect what the belt was doing three months ago, not what it is doing now. Material changes, load shifts, and progressive degradation all change the process distribution, but static limits cannot respond. The result is a control chart that generates false alarms during transitions and misses genuine drift during stable operation — the combination that destroys operator trust and allows scrap events to develop undetected.
The documented evidence from industrial applications is consistent. Standard control charts on mineral processing data generate three to five times more out-of-control signals than adaptive or residual-based methods. Adaptive ML control limits reduce false alarm rates by 50 to 70 percent while improving genuine drift detection. Cpk stability at or above 1.67 is achievable continuously when limits adjust to the rolling process baseline. The operations achieving sustained Cpk performance are the ones that deployed adaptive limits across their full conveyor network, configured Western Electric Rules against the adaptive baselines, and used the Cpk/Ppk gap monitor as a leading indicator of degradation before it produces scrap.
iFactory's adaptive SPC platform is purpose-built for shift supervisors and production line leaders in mining conveyor operations who need control limits that reflect the process as it runs today, not as it ran last quarter. Book a Demo to see adaptive control charts configured for your conveyor network parameters and material profile, or talk to an expert about a free Cpk stability and control limit accuracy assessment for your conveyor system.
Frequently Asked Questions
Limits That Do Not Move Cannot Track a Process That Does. Get a Free Cpk Stability and Limit Accuracy Assessment for Your Conveyor System.
iFactory's adaptive SPC platform for mining conveyor supervisors — dynamic UCL/LCL that recalculate continuously, rolling baseline estimation, Western Electric Rules on adaptive boundaries, live Cpk and Cpk/Ppk gap monitoring, and audit-ready limit change logs generated automatically from the data your conveyor system already produces.