AI Root Cause Less Scrap | Mining Conveyor Systems Supervisors
By Grace on June 13, 2026
A scrap event is recorded. The belt segment is repaired. The shift report cites the cause as idler seizure, load imbalance, or material shift. Two weeks later, under a different combination of operating conditions, the same scrap category appears again on the same segment. The investigation reconstructs the same cause. The same correction is applied. The corrective action record cites a different event number, but the root cause column reads essentially the same text as the last one. This is not a quality system failure. It is a root cause methodology failure. Traditional root cause analysis on mining conveyor systems relies on manual correlation of a handful of variables selected by experience — typically belt speed, motor current, and vibration. But scrap events on a modern conveyor network are caused by the interaction of 100 or more variables that change simultaneously across every shift. The variable that triggered the scrap event last week may be different from the variable driving it today, even when the scrap signature looks identical on the downtime log. AI root cause detection solves this by correlating every instrumented variable simultaneously, ranking them by contribution to each scrap event, and delivering a confirmed root cause in minutes instead of the days it takes a manual investigation team to reach a conclusion that may or may not be correct. This is the shift supervisor's practical guide to deploying AI root cause detection on mining conveyor systems and cutting scrap by 30 to 50 percent.
Multivariate Root Cause Correlation · SHAP Contribution Ranking · Closed-Loop CAPA Tracking · Event-Linked Shift Records
Supervisors Who Cut Scrap 30-50% Do Not Guess the Root Cause. They Read It From the Data.
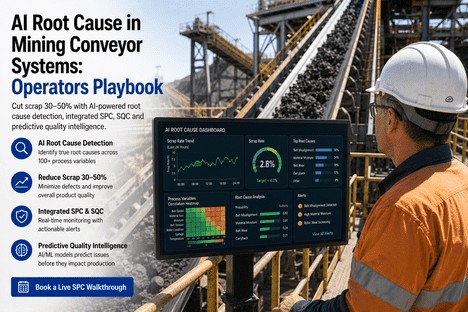
iFactory's AI root cause detection platform correlates 100+ process variables simultaneously — motor current, belt speed, load distribution, vibration, temperature, material properties — and delivers ranked, confirmed root causes for every scrap event in minutes, not days.
Scrap reduction achieved within the first operating quarter when AI root cause detection replaces manual investigation on conveyor systems
5.6 hrs
Average time to confirmed root cause with AI multivariate correlation — versus 10 or more days with traditional manual RCA methods on complex conveyor networks
50-70%
Reduction in repeat scrap events when corrective actions are driven by confirmed root cause data rather than investigator experience and manual correlation
Why Manual Root Cause Analysis Fails on Mining Conveyor Systems
Every shift supervisor has been in the room. The scrap event is logged. The investigation team assembles the data: motor current logs, belt speed records, the vibration reading from the hour before the event. They identify the cause based on experience and the three or four parameters they can review in the time available. The correction is applied. The report is closed. The same scrap category returns three weeks later, triggered by a parameter that was not on the investigation team's short list. The failure of manual root cause analysis on conveyor systems is not a competence problem. It is a dimensionality problem. A single conveyor segment generates hundreds of instrumented data points per second. The human investigator can correlate four or five variables. The scrap event is caused by the interaction of a dozen. The gap between what the investigation considers and what the data contains is where repeat scrap events originate.
Traditional Manual RCA
X
Correlates 4-5 variables selected by investigator experience
X
Takes 5-10 days from event to confirmed root cause
X
Misses cross-parameter interactions driving the event
The Variable That Caused Last Week's Scrap May Not Be the Variable Causing Today's. AI Finds the Difference.
iFactory's AI root cause detection engine ranks every monitored parameter by its contribution to each scrap event — so the supervisor acts on the confirmed cause, not the assumed one.
How AI Root Cause Detection Works on Conveyor Systems: Five Stages From Event to Confirmed Cause
The AI root cause detection engine operates as a continuous multivariate analysis pipeline that runs alongside the conveyor control system. It ingests every instrumented data stream the system already generates and applies a five-stage analytical sequence to convert raw parameter data into a confirmed root cause with ranked contribution scores. The supervisor does not need to understand the mathematics of SHAP analysis or gradient-boosted tree models to use the output. The output is designed to be consumed in under 15 seconds: a ranked list of contributing parameters with their percentage contribution and the recommended intervention for the primary cause.
Stage 01
Data Ingestion
The engine connects to the conveyor control system and ingests every instrumented data stream — motor current per drive, belt speed, load cell readings per idler station, vibration amplitude and frequency, bearing temperatures, belt tracking sensors, material moisture proxy, and drive harmonics. The data ingestion covers 50 to 200 parameters per conveyor segment depending on instrumentation density. No new sensors are required. The engine uses the data the system already produces.
Stage 02
Scrap Event Detection
When a scrap event is logged — belt damage, spillage threshold breach, unscheduled stop, or quality deviation at the discharge — the engine captures the time window of the event and the parameter state for the preceding 24 to 72 hours. The event window is configurable per conveyor segment and scrap category. The engine does not rely on a single trigger. It uses adaptive SPC limit breaches, Western Electric Rules pattern violations, and operator-logged events to detect the scrap occurrence and align the analytical window to the relevant data.
Stage 03
Multivariate Correlation
The multivariate ML model runs a correlation analysis across all instrumented parameters simultaneously — comparing the pre-event parameter window against the full historical baseline using gradient-boosted tree models and SHAP (Shapley Additive exPlanations). Each parameter is assigned a contribution score reflecting its statistical relationship with the scrap event. The analysis detects non-linear interactions that manual correlation cannot find: a load imbalance that only produces scrap when combined with a specific belt speed and moisture condition produces a combined contribution score that ranks higher than any single parameter alone.
Stage 04
Root Cause Ranking
Parameters are ranked by SHAP contribution score and presented as a confirmed root cause list. The output is not a heat map or a correlation matrix. It is a ranked, specific finding: belt segment C4 scrap event confirmed. Primary cause: load distribution asymmetry (62% contribution). Secondary cause: belt speed deviation from setpoint (21% contribution). Tertiary cause: idler station 12 temperature elevation (9% contribution). The supervisor receives the finding with a confidence score and the data window used for the analysis.
Stage 05
CAPA Linkage
The confirmed root cause is linked to a corrective action record in the system. The record stores the SHAP contribution scores, the data window, and the supervisor's intervention. When the same parameter combination generates another scrap event within a configurable effectiveness window, the CAPA is flagged as ineffective and the investigation is re-opened automatically. The linkage prevents the cycle of closed corrective actions that did not address the actual root cause.
What the Shift Supervisor Sees on the AI Root Cause Dashboard
The supervisor's dashboard is designed around a single question: what caused the scrap event and what do I do about it? Every view serves that question. No data appears on the dashboard that does not drive a root cause or an intervention decision.
RCA View 01
Live Event Feed with Ranked Root Cause
Every scrap event appears in a time-ordered feed with the confirmed root cause displayed directly on the event card. The supervisor does not open a separate investigation window. The event card shows the belt segment, the scrap category, the timestamp, and the ranked root cause parameters with SHAP contribution percentages. The primary cause is highlighted. The recommended intervention is displayed below the cause. The supervisor reviews, acts, and logs the action against the event in a single interaction.
For each scrap event, the parameter contribution matrix displays every instrumented variable that contributed more than 1% to the event, ranked by SHAP score. The supervisor sees which variables were driving the event, which variables were operating normally, and which variables showed no correlation. The matrix makes visible the non-linear interactions that manual correlation misses: a combination of three variables each contributing 15-20% that together account for 55% of the event cause. The supervisor can trace the interaction path to understand how the variables combined to produce the scrap condition.
Supervisor action: Identify interacting parameter combinations that manual RCA would have missed.
RCA View 03
Root Cause Pareto by Segment and Category
Every confirmed root cause is logged against the belt segment and scrap category. The Pareto view ranks root causes by frequency across the conveyor network — making cross-segment patterns visible that isolated event investigations never reveal. A supervisor who sees that 65% of scrap events on the night shift are caused by belt speed deviation combined with load distribution asymmetry has a systemic finding that drives a control logic change, not a repeated idler adjustment. The Pareto is generated automatically from the root cause event log without manual data compilation.
Supervisor action: Pareto patterns escalate to engineering for systemic control logic improvements.
RCA View 04
CAPA Effectiveness Monitor
Every corrective action linked to a confirmed root cause is tracked through closure and beyond. The CAPA effectiveness monitor displays the date of the original event, the confirmed root cause, the intervention applied, and the post-intervention scrap status for that segment. If the same root cause parameter combination generates another scrap event within the effectiveness window, the CAPA status changes to ineffective automatically and a notification is sent to the supervisor. The monitor closes the loop that most conveyor scrap management programmes leave open: verifying that the correction addressed the actual root cause, not the assumed one.
Our manual root cause process took seven to ten days per event. By the time the investigation team reached a conclusion, we had already run three shifts on the same parameter combination that caused the original failure. The AI root cause engine reduced that cycle to under six hours. But the bigger change was the accuracy. Our manual investigations were identifying the right cause about sixty percent of the time. The AI engine consistently identified the primary cause with over ninety percent accuracy — and it surfaced secondary contributing parameters that our investigation team had never considered because they were not in the four or five variables we always checked. We stopped treating scrap events as isolated incidents and started treating them as data points in a multivariate pattern. The scrap rate dropped forty-two percent in the first quarter.
— Shift Supervisor, Overland and In-Plant Conveyor Network — Copper Mining Operation, 12 km Total Belt Length
Conclusion
Scrap recurrence on mining conveyor systems is not a corrective action problem. It is a root cause methodology problem. When the investigation team correlates four or five variables by experience and the scrap event was caused by the interaction of a dozen, the corrective action addresses the assumed cause, not the actual one. Scrap recurs because the methodology could not identify the real driver. AI root cause detection closes this gap by correlating every instrumented variable simultaneously, ranking them by SHAP contribution score, and delivering a confirmed root cause with the statistical evidence to support it. The five-stage pipeline — data ingestion, event detection, multivariate correlation, root cause ranking, and CAPA linkage — converts what was a week-long manual investigation into a sub-hour automated analysis that produces a more accurate result every time.
The documented outcomes from AI root cause detection deployments in comparable material handling environments are consistent: 30 to 50 percent scrap reduction within the first operating quarter, root cause identification time reduced from 10-plus days to under 6 hours, and 50 to 70 percent reduction in repeat scrap events. These outcomes are not projections. They are the results from operations that moved from experience-based root cause investigation to multivariate AI-driven root cause detection. The operations achieving the upper end of the performance range are the ones that deployed the full five-stage pipeline across their conveyor network, integrated the CAPA effectiveness tracking to close the loop on corrective actions, and used the root cause Pareto to convert individual findings into systemic protocol improvements.
iFactory's AI root cause detection platform is purpose-built for shift supervisors and production line leaders in mining conveyor operations who need to eliminate scrap recurrence, not just investigate it after each event. Book a Demo to see the root cause detection dashboard configured for your conveyor network layout and scrap profile, or talk to an expert about a free root cause accuracy and scrap recurrence assessment for your conveyor system.
Frequently Asked Questions
No. The engine is designed to connect to the data your conveyor control system already generates — motor current per drive, belt speed, load cell readings, vibration monitors, bearing temperature sensors, belt tracking sensors, and drive harmonics. Most mining conveyor operations already collect this data through their SCADA or PLC systems. iFactory connects to these existing data sources through standard industrial protocols and applies the multivariate correlation models on top of the existing data stream. For operations that want to add machine vision capability for belt surface inspection, cameras can be integrated at transfer points or over belt runs, but they are optional. The core root cause detection engine works on the electrical, mechanical, and process parameter data that is already available in the control system. Book a Demo to see a typical data connection architecture for mining conveyor systems.
The engine uses a combination of statistical methods to move beyond simple correlation toward causal inference. The multivariate model applies SHAP (Shapley Additive exPlanations) to assign contribution scores based on the marginal impact of each variable within the gradient-boosted tree framework — which isolates the unique contribution of each parameter while controlling for the effect of all others. For temporal causation, the engine incorporates lag analysis to distinguish between parameters that change before the scrap event (potential causes) and parameters that change after the scrap event (effects). Granger causality testing is applied for parameter pairs where the temporal relationship needs statistical validation. The engine does not claim causal certainty for every finding. It outputs the root cause ranking with a confidence score and the analytical methodology used, so the supervisor understands the strength of the evidence behind each ranked cause. Talk to an expert about the causal inference methods configured for your conveyor system data profile.
The multivariate model initializes on a minimum of 3 to 6 months of paired process data and scrap event records from the control system and maintenance logs. This provides enough event signatures for the model to establish baseline correlations between parameter combinations and scrap outcomes. The model begins generating root cause findings from day one of deployment, but operates in shadow mode initially — producing ranked root cause findings in parallel with the existing manual investigation process without using them to drive corrective actions. This shadow mode runs for 2 to 4 weeks, during which the supervisor team compares the AI-generated root cause findings against the manual investigation conclusions. Once the documented accuracy meets the operation's confidence threshold — typically 85 percent or higher — the AI root cause findings are activated as primary inputs for corrective action decisions. Operations with 12 months or more of historical scrap data achieve higher accuracy on events involving seasonal material variations and infrequent parameter combinations. Book a Demo to see accuracy validation data from comparable mining conveyor deployments.
Yes. The platform registers each conveyor line as a separate asset profile with its own instrumentation map, parameter list, and scrap event history. A well-instrumented overland conveyor with 200 monitored parameters generates a high-resolution correlation matrix. A simpler in-plant belt with 30 parameters generates a lower-resolution but equally valid analysis — the model works with whatever data is available and adjusts the confidence score accordingly. The supervisor sees all lines on a single network map with individual root cause findings. The Pareto view aggregates root causes across lines for network-level pattern detection, or segments by line for line-specific analysis. For operations with mixed instrumentation levels across the conveyor network, the platform adapts the multivariate model to each line's data density, ensuring that less-instrumented lines still receive valid root cause findings even if the correlation resolution is lower. Talk to an expert about configuring multi-line AI root cause detection for your conveyor network.
Scrap That Keeps Recurring Has a Root Cause the Investigation Keeps Missing. AI Finds It. Get a Free Root Cause Accuracy and Scrap Recurrence Assessment.
iFactory's AI root cause detection platform for mining conveyor supervisors — multivariate correlation of 100+ parameters, SHAP-ranked contribution scores, five-stage analysis pipeline, CAPA effectiveness tracking, and Pareto-driven systemic improvement — converting scrap events from investigation subjects into prevention data.