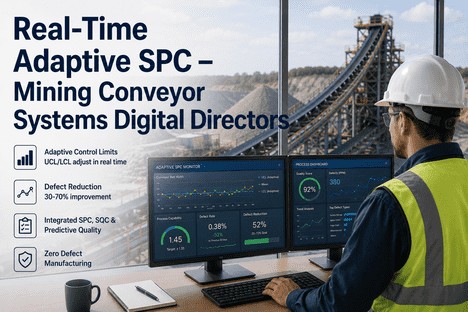
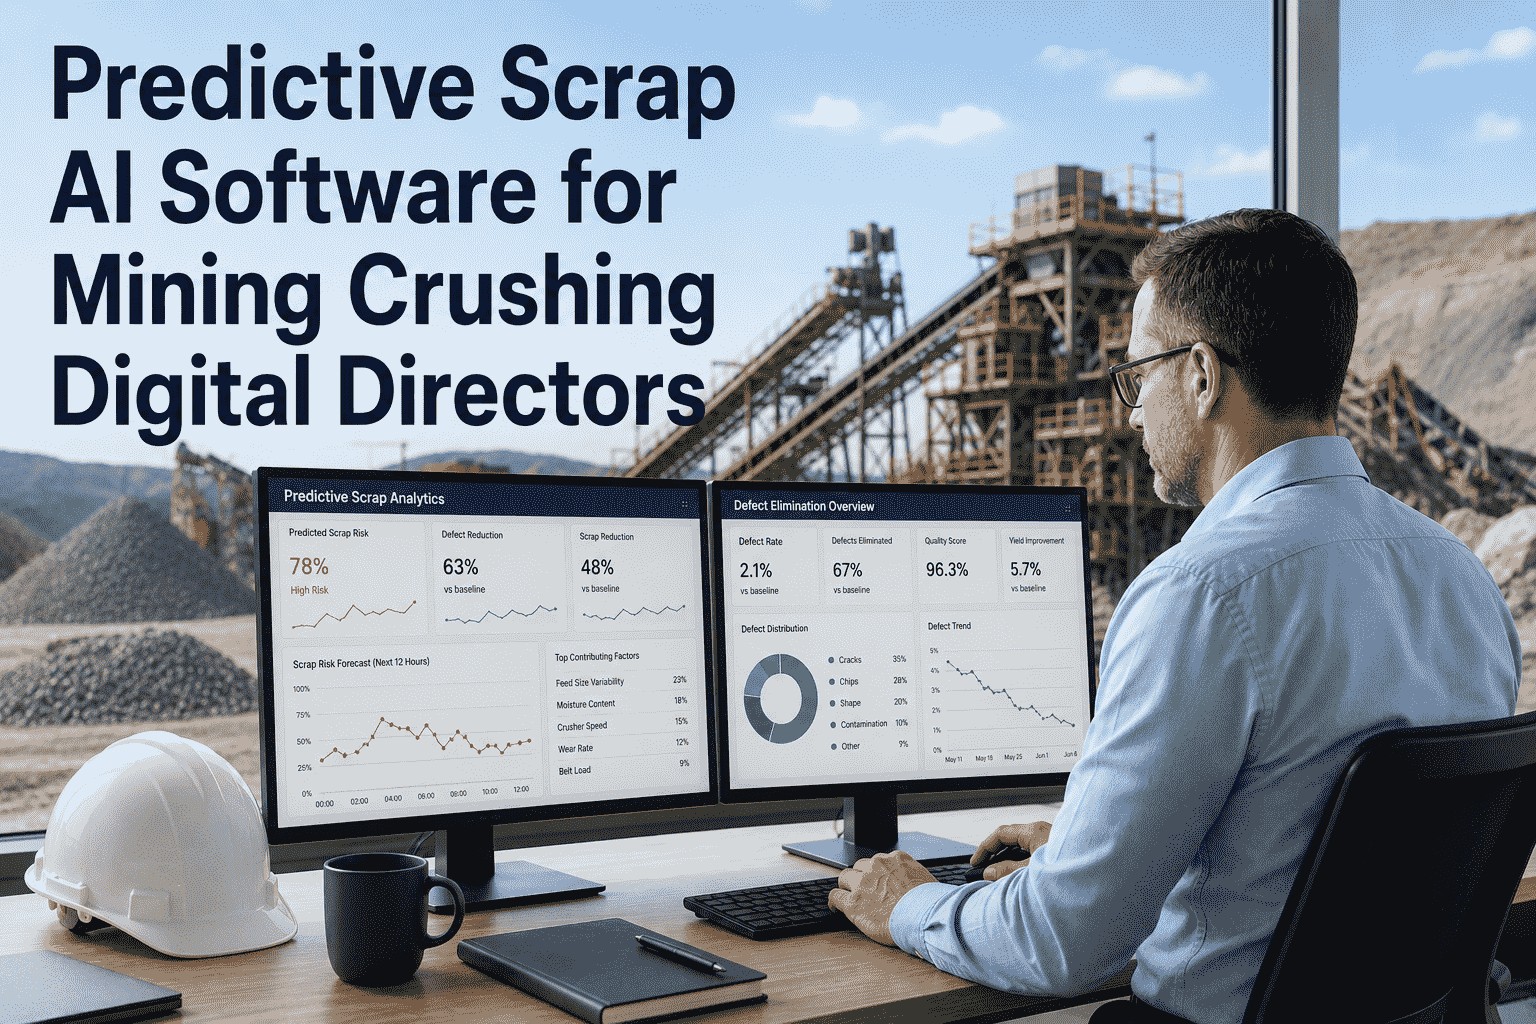
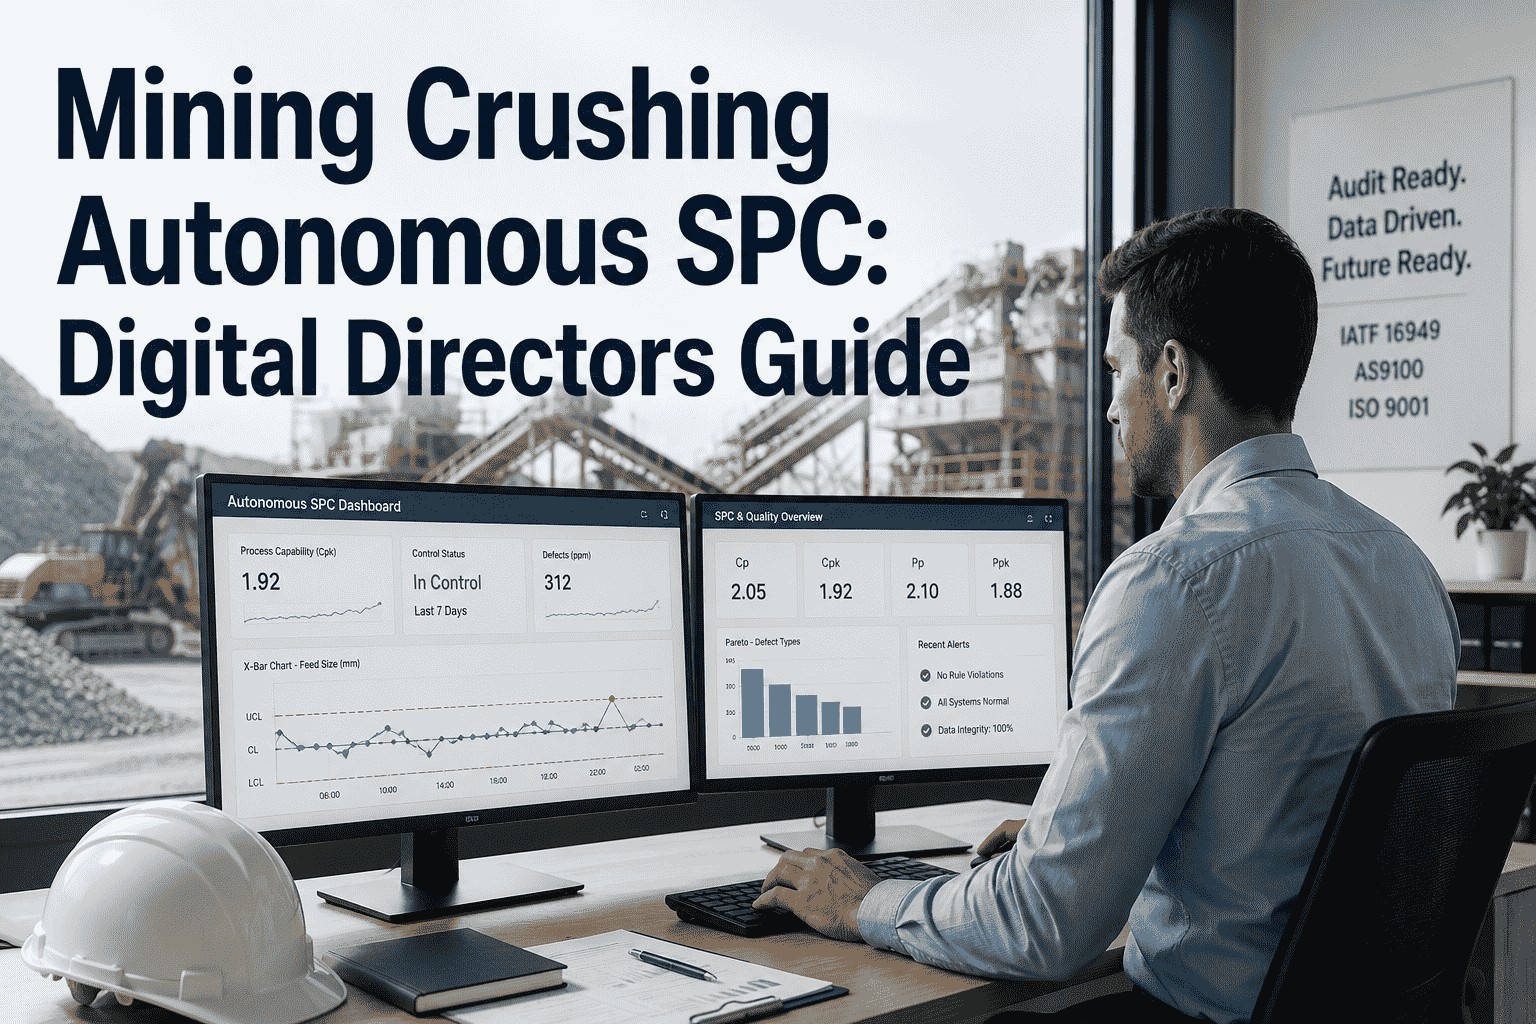
You are 14,000 tons into a copper ore crushing campaign. The cone crusher is drawing 340 kW. Your operator's shift check shows P80 holding at 12.5 mm. Your last lab assay at hour three confirmed product was within spec. What you do not yet know is that your closed-side setting has been drifting 0.3 mm per 1,000 tons since the liner reached 60 percent wear — a trend that will push P80 past the upper tolerance boundary at 19,500 tons, affecting 5,500 tons of crushed material before your end-of-shift lab result catches it. For digital manufacturing directors still relying on static SPC limits and periodic lab sampling in variable feed crushing circuits, this is not a hypothetical. It is a monthly event. Adaptive SPC for mining crushing exists to close this gap — detecting the drift before the breach, quantifying process capability in real time across every ore type, and giving quality leaders the statistical foresight to intervene before the first off-spec ton is produced.
Adaptive SPC · Live Cpk · Scrap Reduction · Mining CNC Quality
AI-Powered Adaptive SPC for Mining Crushing Operations
iFactory gives digital manufacturing directors a live predictive SPC engine for every crushing circuit — tracking Cpk in real time through feed variability, detecting liner wear drift before it becomes a scrap event, and generating compliance-ready quality records on every ton, every shift.
1.67+
Sustained Cpk achieved by crushing plants running AI-native adaptive SPC — the Six Sigma benchmark for consistent product PSD
47%
Fewer false alarms reported by operations replacing static SPC with dynamic UCL/LCL limits that self-tune to ore hardness and feed variation
30-50%
Scrap reduction achieved within the first operating quarter after deploying adaptive limits across cone and impact crushing circuits
72 hrs
Time to first adaptive limit deployment from data connectivity — no new sensors, no control system replacements, no additional headcount
Why Static SPC Limits Are Structurally Broken for Crushing Circuits
Statistical process control has been the quality backbone of mineral processing for decades — and the theory remains sound. The problem is not the mathematics of Shewhart control charts. The problem is that static UCL and LCL boundaries were designed for stable batch manufacturing environments where the process baseline does not shift hourly. A crushing circuit is the opposite of stable batch manufacturing. Feed ore arrives with hardness variability that no blending programme fully smooths out. Liner wear progresses continuously over weeks, shifting the crushing gap and the resulting particle size distribution even when no setting has been touched. Recipe changes between ore types reset the expected PSD range entirely. Static limits calculated during last quarter's capability study are wrong for the process running right now — and they degrade in accuracy with every ton processed.
In a cone crusher circuit processing 5,000 tons per shift, a static SPC limit set during commissioning will fire false alarms every time ore hardness spikes — training operators to ignore the control chart entirely. Simultaneously, real drift from liner wear or CSS creep slides under the fixed detection threshold undetected, producing off-spec material for hours before the next lab sample confirms the failure. The digital manufacturing director sees a Cpk report that averages good hours with bad hours, obscuring the real variance that drives scrap. The Cpk number on the monthly report is accurate for the process as it was configured three months ago. It carries no information about what the crusher is doing right now.
AS9100, ISO 9001, and IATF 16949 quality frameworks increasingly demand continuous process monitoring evidence, live capability indices, and traceability linking every production batch to the exact process state in which it was produced. Static SPC with quarterly capability studies and manual chart reviews cannot generate that evidence. Adaptive SPC, running on an AI-native monitoring platform, can — and does, on every ton, without adding a single headcount to the quality team. For the digital manufacturing director accountable for both scrap reduction and compliance, adaptive SPC is not an upgrade to the existing system. It is the system that replaces it.
The Cpk Gap: What Your Crushing Circuit Is Actually Doing Between Lab Samples
Cpk Level
Defects Per Million Tons
Status in Crushing Context
Cpk 0.9
2,700 ppm
Oversize and fines generated every shift. Downstream mill energy wasted on off-spec feed.
Cpk 1.00
2,700 ppm
At the edge. One harder ore seam or liner wear cycle tips you over.
Cpk 1.33
64 ppm
Industry baseline for most mineral processing applications. Achievable with weekly lab sampling.
Cpk 1.67+
0.6 ppm
Six Sigma target. Where AI-native adaptive SPC consistently delivers across ore variability.
How Adaptive SPC Limits Differ From Everything You Have Used Before
Adaptive SPC is not a faster version of manual SPC running on the same static limits. It is a structurally different approach to process control — one that recalculates UCL and LCL continuously using an Exponentially Weighted Moving Average model, runs all eight Western Electric pattern rules against a moving reference, and surfaces root-cause attributions that tell operators exactly which variable to adjust. The four operational differences that matter most to a digital manufacturing director are these:
01
Dynamic Limits vs Static UCL/LCL
Static control limits set at qualification become progressively less accurate as liner wear, ore hardness, and feed characteristics shift the process distribution. Adaptive limits recalculate against a rolling EWMA window — typically the last 100 to 200 data points — so UCL and LCL always reflect the current process baseline. Limits tighten when the process stabilises. Limits widen appropriately during high-variability feed periods. False alarm rates stay at the theoretical baseline. Real drift remains clearly distinguishable from common-cause noise.
02
Trend Prediction vs Breach Detection
Conventional SPC reacts when a measurement crosses a fixed limit — by which time off-spec material has already been produced. Adaptive SPC projects the current drift trajectory and fires a predictive alert when Western Electric pattern rules indicate a breach is likely within the next 15 to 30 readings. Rules 1-4 catch acute events and mean shifts. Rules 5-8 catch the systematic drift patterns — liner wear progression, feed hardness trends, moisture cycles — that single-point alarms were never designed to see. The distinction between reacting to scrap and preventing it is where the 30-50% reduction is realised.
03
Root-Cause ML Attribution
When an adaptive limit is exceeded or a Western Electric rule triggers, the ML classification layer identifies the contributing variable — feed hardness spike, liner wear progression, CSS drift, feed rate variation, or moisture change — and ranks each by percentage contribution. The operator sees "Liner wear: 62% contribution" with a recommended action, not a red alarm number with six possible causes to investigate manually. For the digital director, this means every alarm carries diagnostic information that was previously only available after a shift review.
04
Live Cpk vs Qualification Snapshot
Cpk in a conventional operation is a number from a quarterly capability study — representing the process as it was configured on a specific day with specific ore and liner condition. Live Cpk is recalculated with every data point, reflecting the actual current capability of the circuit at this moment, with this ore blend, at this point in the liner's life. When Cpk falls below the configured threshold (1.33 for standard, 1.67 for critical), a capability alert fires before the process reaches a specification breach. The digital director sees it on the dashboard while the operator can still correct the run.
Our static SPC programme was generating false alarms every time we changed ore blends on the copper cone crusher circuit. Operators had learned to dismiss them entirely. When we deployed AI-native adaptive SPC, the dynamic limits absorbed the ore-type variance, false alarms dropped below 4%, and we caught a liner wear drift event at day 7 of a 28-day liner run that would have affected 12,000 tons before our end-of-week lab assay found it. Our Cpk on P80 went from 1.18 to 1.64 sustained across the next three production blocks.
— Digital Manufacturing Director, Copper Concentrator, Tier 1 Mining Operation
The Five Process Events That Destroy Cpk in Crushing Circuits Mid-Run
Process capability in a crushing circuit does not degrade uniformly or predictably. There are five identifiable process events that account for the majority of mid-run Cpk collapse — and each produces a signature in the data stream that adaptive SPC can detect before the off-spec ton is produced. Understanding these signatures is the difference between a reactive scrap investigation and a predictive quality intervention.
01
Progressive Liner Wear
As manganese liners wear, the closed-side setting increases and the crushing chamber geometry changes, producing a gradual upward drift in P80 that is invisible on any individual sample but clearly detectable as a trend across 100 to 200 tons. Adaptive SPC detects the Rule 4 or Rule 5 pattern signature and flags liner wear as the primary contributor — typically at day 5 to 7 of a 28-day liner run — before the PSD crosses the upper spec limit.
02
Ore Hardness Seam Transition
When the mining face moves through a harder ore seam, the crusher power draw spikes, reduction ratio changes, and PSD shifts coarser. Static SPC misreads this as a special-cause event and fires Zone A alarms. Adaptive SPC recognises the regime change, widens limits to accommodate the increased natural variance, and prevents false alarms. If the hardness change is extreme enough to produce assignable-cause drift, the ML layer identifies ore hardness as the dominant contributor and recommends feed blend adjustment.
03
Closed-Side Setting Drift
Hydraulic system creep, temperature-induced frame expansion, and pressure fluctuations cause the closed-side setting to drift from its setpoint over hours of continuous operation. This drift produces a systematic bias in every product size fraction that static SPC cannot distinguish from normal process variation. Adaptive SPC detects the CSS drift trend through multivariate monitoring of power draw, hydraulic pressure, and PSD — and triggers an alert when the combined signature indicates CSS has moved beyond the acceptable band.
04
Moisture Content and Material Handling Variation
Seasonal rainfall and ore body moisture variation change how material flows through the crushing chamber, affecting packing density, power draw, and the resulting particle size distribution. This process event appears in the data as a sudden increase in variance with no shift in mean — invisible to a chart watching for mean drift alone. Adaptive SPC monitors variance alongside mean and identifies moisture-driven events by their characteristic signature of widening distribution without mean shift.
05
Feed Rate and Segregation Events
Surge loading from upstream conveyors or segregation in the feed bin changes the material profile entering the crusher, momentarily altering the crushing dynamics and product PSD. These events are transient but can produce off-spec material for 10 to 30 minutes at a time. Adaptive SPC with a 100-sample rolling window classifies these as transient common-cause events and does not generate alarms — preserving operator trust for the sustained drift patterns that actually require intervention.
Static SPC vs Adaptive SPC: What Actually Happens on Shift
| Situation |
Static SPC |
Adaptive SPC |
| Harder ore seam arrives mid-shift |
Zone A alarm fires. Operator checks, finds nothing wrong, resets alarm. Trust in charts erodes. |
Limits widen to reflect increased variance. No alarm unless a real exceedance occurs within the new context. |
| Liner wear shifts PSD over 3 weeks |
Each individual reading within limits. Drift undetected until downstream screen reports oversize at week 3. |
Rule 4 fires at day 7. Liner wear flagged as primary cause at 62% contribution. Work order generated. |
| Recipe change to new ore blend |
Old limits applied to new material. Continuous false alarms or missed shifts depending on direction. |
Recipe event triggers limit recalculation. New baseline established within first 30 readings automatically. |
| End-of-shift scrap report review |
12% fines generated. Source unclear. Report filed, process unchanged for next shift. |
Fines rate 4-6%. Three Rule 3 alerts caught drift at hour 3. CSS adjusted before damage compounded. |
| Digital director reviews quality KPIs |
Charts show constant alarms. Team appears unresponsive. Limits appear meaningless. Cpk outdated. |
Alarm rate down 47%. Scrap trending down 30-50%. Live Cpk visible per crusher, per parameter, per shift. |
How Adaptive SPC Deploys on a Live Crushing Circuit
The architecture of an adaptive SPC deployment in a mining crushing operation has four integrated layers. Each layer builds on the previous one, and it is the integration of all four that delivers the scrap reduction and capability improvement that digital manufacturing directors need to show measurable return on investment within the first operating quarter.
Layer 1
DCS and Sensor Ingestion
iFactory connects directly to your DCS and historian infrastructure via OPC-UA, MTConnect, or standard SQL data stores — collecting crusher power draw, closed-side setting, feed rate, hydraulic pressure, bearing temperature, and vibration data on every cycle without manual data entry or additional sensors. Particle size analyser outputs, vision inspection results, and conveyor belt scale data feed into the same stream. The result is a complete, automatically populated per-ton quality record with no operator intervention required.
Layer 2
EWMA Adaptive Limit Engine
Every monitored parameter runs a live control chart updated with every data point. The Exponentially Weighted Moving Average model continuously estimates the current process mean and standard deviation from a rolling window of 100 to 200 data points. UCL and LCL are recalculated at plus or minus three sigma from the rolling mean. Limits tighten when the process is stable. Limits widen during known high-variability periods. All eight Western Electric rules are evaluated in real time against the adaptive limits. Every limit change is logged with a timestamp, statistical basis, and the process event that triggered it — creating an auditable record that quality auditors can review without any manual documentation effort.
Layer 3
ML Root-Cause Attribution
When a Western Electric rule triggers against the adaptive limits, a machine learning classification layer analyses the current multivariate process state — comparing it against historical event signatures stored in the model. The ML layer identifies the contributing variable: liner wear progression, CSS drift, feed hardness change, moisture shift, or feed rate variance. It ranks each by percentage contribution to the exceedance. The operator sees "Liner wear: 62% contribution — schedule change within 400 tons" instead of a generic control limit violation. For the digital director, this means every alarm carries diagnostic value that enables data-driven maintenance scheduling and process optimisation decisions.
Layer 4
Live Cpk and Compliance Dashboard
Process capability indices — Cp, Cpk, Pp, Ppk — are recalculated after every data point and displayed on the digital director's dashboard alongside the live control chart. When Cpk falls below the configured threshold (1.33 for standard features, 1.67 for critical), a capability alert fires before the process reaches a specification breach. Simultaneously, every production block generates a complete compliance record: parameter values, per-parameter capability results, control chart state, liner life count, ore type classification, and shift operator ID — available for ISO 9001, AS9100, or IATF 16949 audit submission without any additional assembly effort.
The Digital Director's Real-Time Dashboard
An adaptive SPC platform generates value only if the decision-maker can act on its output in the moment it is produced. The iFactory quality dashboard is structured to answer the five questions that define the digital manufacturing director's decision loop across every shift — without requiring navigation through multiple systems or manual data aggregation.
Which crusher has an active quality risk right now?
Every crusher displayed as green, amber, or red — in control, trending toward a limit, or breached. Plant-wide priority order without physically walking the circuit or waiting for the next lab result.
How many tons before the next intervention?
Predicted intervention point calculated from observed drift rate via Western Electric pattern rules — not a fixed liner life count. Schedule the liner change or CSS adjustment at the data-indicated risk point, before any ton is produced out of spec.
What is the current Cpk for this parameter?
Real-time Cpk for every monitored parameter, updated with every data point, per crusher, per ore type, per shift. Not the quarterly capability snapshot — the actual current capability with this ore, this liner, this moisture level.
Can I pull the quality record for any production block in seconds?
Every production block carries a complete linked record: parameter readings, per-parameter Cpk, SPC state at production, ore type, liner life count, and operator ID — searchable and exportable before the material leaves the stockpile.
Before Adaptive SPC
Cpk from quarterly study, 90+ days old. False alarms every ore change. Scrap detected by end-of-shift lab. Compliance evidence assembled manually from disconnected systems.
The Difference
Live capability evidence vs historical snapshot. Automatic root-cause attribution vs manual investigation. Predictive alerts vs reactive scrap reporting. 30-50% scrap reduction vs static defect rates.
With Adaptive SPC
Cpk updated after every data point. False alarms below 4%. Scrap reduced 30-50%. Compliance record generated automatically. Root-cause ML attribution on every alert.
Deployment Timeline: From Static to Adaptive SPC in 90 Days
Transitioning from static to adaptive SPC limits does not require replacing instrumentation, upgrading the DCS, or retraining operators. The adaptive model runs as a software layer on top of your existing data infrastructure, ingesting live data from standard historians and calculating dynamic limits that feed back to the same operator dashboards. With 30 days of clean historical data available, the initial adaptive limits are deployable within 24 to 72 hours after data connectivity is established.
Days 1-30
1
Connectivity and baseline establishment. iFactory connects to your DCS and historian. Adaptive limits initialised in shadow mode. No operator impact. Baseline Cpk and scrap rate documented for before/after comparison.
Days 31-60
2
Validated shadow operation. Adaptive limits run alongside static SPC. Supervisors compare performance. False alarm rate drops 40-60% within first week. Root-cause ML attribution validated against operator observations.
Days 61-90
3
Live adaptive production. Static SPC retired. All eight Western Electric rules active against adaptive limits. Live Cpk visible per crusher. Scrap reduction tracking online. Compliance record generation active.
Get a Free Cpk and Scrap Reduction Audit for Your Crushing Circuit
iFactory's quality engineers review your current Cpk data, SPC configuration, and scrap records — and identify exactly where adaptive SPC would close the capability and waste gap in your operation.
Conclusion
The digital manufacturing director running a conventional SPC programme in a crushing circuit is doing the right thing with the wrong tool for the current operating reality. Static limits set at qualification, lab sampling intervals that leave 95% of production uninspected, and Cpk snapshots that age from the moment they are calculated — these are not quality control failures. They are the correct outputs of a system designed for stable batch manufacturing environments that bear no resemblance to a live crushing circuit processing variable ore through wearing liners across changing feed conditions.
Adaptive SPC running on an AI-native platform changes the fundamental economics of the quality problem in mining crushing. The process running at Cpk 0.9 generating 2,700 defects per million tons is not a process that needs better lab technicians or more frequent sampling — it is a process that needs control limits that reflect what the crusher is actually doing right now. Moving from Cpk 1.0 to Cpk 1.67 cuts the defect rate by 4,500 times. That improvement does not come from sampling more frequently against the same outdated limits. It comes from monitoring every data point, updating capability in real time, and predicting the drift events that static SPC only discovers after they have already created off-spec material that consumed energy, liner life, and downstream processing capacity.
The compliance outcome is equally concrete. The ISO 9001 or AS9100 traceability record that currently requires manual assembly across the DCS, laboratory information system, and maintenance logs is generated automatically at the time of production. The shift quality report that takes 30 minutes to compile is available in seconds. The audit finding about outdated control limits is eliminated because every limit is current, logged with its statistical basis, and justified by the actual process data that produced it. iFactory deploys in 90 days, validates against your own production data in shadow mode, and delivers sustained Cpk 1.67+ capability before the end of the first production quarter. The gap between operations running adaptive SPC and those still relying on static limits and periodic lab sampling widens with every shift.
Adaptive SPC does not replace the Shewhart control chart. It replaces the static UCL and LCL calculation with a dynamic model that updates as process conditions change. The control chart still looks the same. What changes is that the limits now reflect the current process state — and every alarm that fires is a signal worth acting on.
Frequently Asked Questions
Your Crushing Circuit Is Already Generating the Data to Prevent the Next Scrap Event. iFactory Makes It Predictive.
iFactory's adaptive SPC platform gives digital manufacturing directors live Cpk monitoring, dynamic UCL/LCL limits, Western Electric pattern rule detection with root-cause ML attribution, and compliance-ready quality records on every ton — deployed in 90 days, validated against your own production data before it generates a single scrap-reduction report.