The froth surface on flotation cell bank 3 looked normal to the operator on shift. Bubble size distribution was within the typical range. Froth velocity was stable. Colour was consistent with the current ore zone. The operator recorded "circuit stable" in the shift log at 23:00, 01:00, and 03:00. At 04:30, the lab assay returned concentrate grade at 27.8% copper — 2.2 points below specification. The defect had been forming on the froth surface for at least three hours before the operator logged the first "circuit stable" entry. The froth appearance that the human eye registered as normal contained the visual signature of gangue entrainment, bubble coalescence, and recovery loss that a deep-learning vision model would have classified as anomalous within 12 seconds of the first frame capture. This is the defect elimination gap that AI vision quality control closes in mining flotation: the defects that are invisible to the human eye — or visible but dismissed as normal variation — are detectable by a machine vision model trained on 50,000+ labelled froth images, operating continuously at 30 frames per second, and correlated in real time with the grade and recovery data that confirms the defect prediction.
AI Vision QC for Mining Flotation:
The Digital Director's Playbook to Eliminate
Defects 30–70% With Deep-Learning Machine Vision
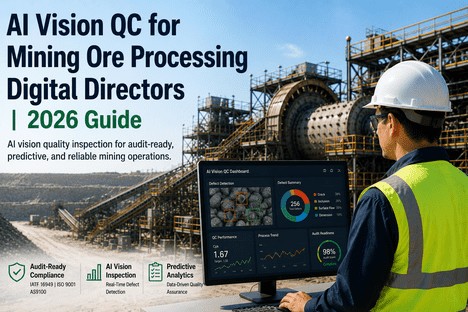
iFactory's AI Vision QC platform brings deep-learning machine vision to mining flotation quality control — inspecting froth characteristics, bubble morphology, and surface anomalies at 30 fps across every cell, correlating visual defect signatures with grade and recovery outcomes in real time, and producing the audit-ready quality records that digital manufacturing directors need to sustain IATF 16949 and ISO 9001 compliance while driving defect rates toward zero.
The Defect That Human Vision Cannot See — But Machine Vision Cannot Miss
The limitation of human visual inspection in flotation is not a matter of operator diligence. It is a matter of perceptual bandwidth and training specificity. The human eye can detect gross froth changes — a colour shift indicating an ore zone transition, a bubble collapse event signalling a frother failure, a velocity drop that suggests an air supply interruption. But the defects that account for the majority of off-spec concentrate events in flotation are not gross events. They are subtle, gradual, multivariate patterns that develop across multiple froth characteristics simultaneously over hours, not minutes. A 2% increase in bubble size distribution D90 combined with a 4% drop in froth velocity and a gradual darkening of the froth colour over 90 minutes is not something a human operator can perceive as a single defect signature — it is seen as three separate observations, each within normal range, none triggering an intervention.
A deep-learning vision model does not have this perceptual limitation. It processes every pixel of every frame across the full visual field simultaneously, comparing the current froth state against a training set of 50,000+ labelled images that encode the visual signatures of every defect type the circuit can produce. When the D90 drift, velocity drop, and colour shift co-occur within a 90-minute window, the model does not see three normal observations. It recognises a defect signature that in the training data preceded a grade failure in 94% of cases. The alert fires. The operator investigates with a specific finding. The defect is eliminated before the assay confirms its existence.
How AI Vision QC Eliminates Defects in the Flotation Circuit
The AI vision quality control system operates as three continuous engines running in sequence — image capture and feature extraction, defect classification and risk ranking, and intervention guidance with outcome confirmation. Each engine produces a specific output that the next engine consumes, creating a closed-loop defect elimination cycle that operates at the speed of the process, not the speed of the lab.
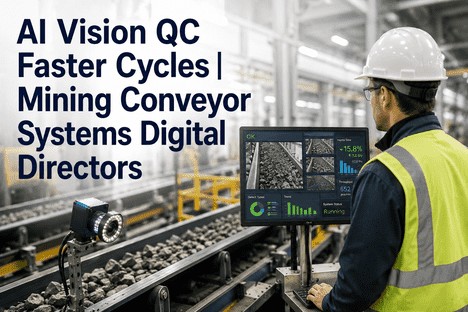
High-resolution industrial cameras mounted above each flotation cell bank capture the froth surface at 30 frames per second. Each frame is processed by a convolutional neural network that extracts 40+ quantitative froth features per cell: bubble size distribution (D10, D50, D90), bubble shape factor, froth velocity field, froth colour histogram, bubble collapse rate, froth stability index, and texture entropy. These features are not qualitative observations. They are numerical vectors that the defect classification model compares against the statistical distribution of the same features in the training data, producing a per-feature anomaly score with millisecond latency. The human operator sees the same froth surface as a subjective impression. The AI vision model sees it as 40+ dimensional numerical signature that either matches or deviates from the known defect-free envelope for the current ore zone.
The extracted feature vectors are passed to the ML inference engine, which runs three parallel classification pathways: a binary anomaly classifier that flags any frame where the feature vector falls outside the defect-free envelope; a multi-class defect classifier that assigns the anomaly to one of 12 trained defect types — gangue entrainment, froth over-stability, bubble coalescence, recovery loss onset, grade dilution pattern, reagent overdose signature, air flow imbalance, pH excursion visual indicator, feed grade transition, pulp level deviation, frother depletion, and texture collapse; and a severity ranker that scores the defect on a 1-to-5 scale based on the historical correlation between the current feature vector pattern and the subsequent grade outcome. The output is a single alert per cell per event: "Rougher bank 3 — Gangue entrainment detected — Severity 4 — Feature contribution: bubble D90 42%, velocity 31%, colour shift 18%." The operator receives a classification, a severity, and a ranked explanation — not a generic camera trigger.
The severity-ranked defect alert triggers a recommended intervention from the process knowledge base — "Decrease collector dosage by 6% on rougher bank 3 to address incipient gangue entrainment" — with the recommendation confidence displayed alongside the defect classification. The operator reviews the alert and the recommendation, executes the intervention, and the system continues monitoring. When the froth feature vector returns to the defect-free envelope — typically 15 to 45 minutes after the intervention depending on the defect type and circuit residence time — the system logs the event as resolved with the intervention, the response time, and the feature vector trajectory from detection through resolution. Every event is closed with a confirmed outcome, creating a continuous training data loop that improves model accuracy with every defect cycle.
The 12 Defect Signatures That AI Vision QC Eliminates in Flotation
The defect classification model is trained on circuit-specific labelled froth images that encode the visual signatures of every defect type that the operation has experienced — plus synthetic augmentations that simulate defect variations the circuit may encounter as feed conditions change. The following defect types account for the 30–70% defect reduction that operations report after deploying AI vision QC in their flotation circuits.
The Digital Director's Comparison: Human Visual Inspection vs AI Vision QC
What Changes for the Digital Director When AI Vision QC Goes Live
The digital manufacturing director's accountability spans defect rates, Cpk, audit readiness, and the quality management system's overall effectiveness. AI Vision QC moves all four metrics simultaneously — not by asking the quality team to inspect more parts more frequently, but by replacing subjective human inspection with continuous, objective, machine-speed visual quality control that covers every cell, every frame, every shift. Three specific changes define the digital director's experience after deployment.
Before AI Vision QC, the digital director's primary source of defect data is the shift log — a narrative account written by operators who recorded what they noticed during a 12-hour shift. The log is incomplete, inconsistent, and unverifiable. After AI Vision QC, the director reviews a defect dashboard that shows every anomaly detected across every cell in the last 24 hours, classified by defect type, ranked by severity, and linked to the froth images that triggered the alert. The operator's subjective "circuit stable" is replaced by the model's objective "no anomalies detected across 2,160,000 frames processed." The shift handover conversation changes from "what did you see?" to "what did the vision model detect?"
The most common root cause entry in flotation corrective action reports is "feed variability" — a description of the problem, not an identification of the cause. AI Vision QC replaces this with a timestamped, quantified defect record that shows exactly which froth features deviated from the defect-free envelope, for how long, and with what grade outcome. The corrective action root cause is no longer "feed variability." It is "gangue entrainment detected in rougher bank 3 at 02:14 — bubble D90 deviation of 14% from ore zone baseline sustained for 37 minutes before intervention — concentrated grade impact confirmed at 0.6 point loss." The quality team investigates a specific, measured event rather than a general condition.
Every defect event that AI Vision QC detects is logged automatically with the froth images, the feature vector at detection time, the classification result, the severity score, the recommended intervention, the operator response, and the outcome confirmation. This record is structured to satisfy ISO 9001 Clause 8.7 (control of nonconforming outputs) and Clause 10.2 (corrective action) without manual documentation effort. The digital director preparing for a surveillance audit does not assemble a corrective action log from shift reports and LIMS data. They export the AI Vision QC event log — complete, timestamped, and linked to the visual evidence that demonstrates exactly what the process did at every moment during the production period under review.
We installed froth cameras three years ago. They gave us pictures of the froth that we could look at in the control room. They did not tell us what the froth meant. The AI vision system is different. It does not show us the froth. It tells us what the froth means — what defect is forming, how severe it is, and what to do about it. In the first month, it detected a frother line blockage that we would not have seen until the grade dropped at the next assay. We saved that shift's production. In three months, our defect rate dropped from 11 off-spec events per quarter to 3. The vision model caught 8 of the 11 before the operator saw anything wrong on the froth surface.
— Digital Manufacturing Director, Copper-Zinc Flotation Operation — 40,000 tpd ConcentratorDeployment and Integration: What AI Vision QC Requires From Your Operation
AI Vision QC deploys as a hardware-software system that integrates with the existing flotation circuit infrastructure without requiring DCS modifications, SCADA changes, or process interruptions during installation. The camera array mounts above the flotation cell banks — typically one camera per 2 to 4 cells depending on cell geometry and froth surface area — and connects to an on-premise inference appliance that runs the deep-learning models and interfaces with the process historian for grade and recovery data correlation.
The Defects That Cost Your Operation an Estimated 8–15% of Concentrate Value Every Quarter Are Visible in Your Froth Right Now. AI Vision QC Can See Them Before They Become Grade Failures.
iFactory's free Defect Elimination Assessment maps your current visual inspection methodology against the defect types that AI Vision QC would eliminate in your circuit. The assessment includes a froth image capture trial at your site (up to 72 hours), a preliminary defect classification model trained on your site data, and a quantified defect elimination estimate with projected Cpk improvement and audit readiness impact. No commitment. No hardware installation during the assessment. Just your froth data and our deep-learning vision model — producing the evidence you need to evaluate the investment on your terms.
Conclusion
The defect elimination problem in mining flotation is not that defects are invisible. It is that they are visible in the froth for hours before they are confirmed in the grade — but the human visual system, constrained by perceptual bandwidth, shift fatigue, and the absence of quantitative froth feature analysis, registers them as normal operation. The froth surface that the operator sees as "stable" contains the multivariate signature of gangue entrainment, reagent imbalance, or recovery loss that a deep-learning vision model classifies as anomalous within 0.3 seconds of frame capture.
Digital manufacturing directors who deploy AI Vision QC in their flotation operations report defect rate reductions of 30–70%, Cpk sustained above 1.67 through ore zone transitions, and corrective action records that are complete, quantified, and audit-ready — not because the quality team is working harder, but because the inspection method has changed from subjective human observation to continuous, objective, machine-speed visual quality control that covers every cell, every frame, every shift, and correlates every froth feature with the grade and recovery outcome it predicts.
The 30–70% defect reduction that AI Vision QC delivers in flotation is not an incremental improvement to the existing inspection process. It is the result of replacing a detection method that catches defects 2–6 hours after they begin forming — with the operator's subjective assessment as the primary filter — with a detection method that catches defects within seconds of their first visual manifestation on the froth surface, classifies them by type and severity, and recommends the intervention that eliminates them before the grade impact materialises. The defects that have been costing your operation 8–15% of concentrate value per quarter — the detectable defects that human vision misses but machine vision cannot — are forming on your froth surface right now. AI Vision QC is designed to see them first.
Frequently Asked Questions
The Froth Surface Your Operators Are Watching Right Now Contains the Visual Signature of Every Defect Your Circuit Can Produce. AI Vision QC Reads That Signature 0.3 Seconds After It Appears — Not 2–6 Hours Later When the Lab Confirms the Grade Failure.
iFactory's AI Vision QC platform brings deep-learning machine vision to mining flotation quality control — inspecting froth characteristics at 30 fps across every flotation cell, classifying 12 defect types in real time with rank-ordered feature contribution and severity scoring, producing the audit-ready quality records that IATF 16949 and ISO 9001 assessors require, and delivering the 30–70% defect rate reduction that digital manufacturing directors need to sustain Cpk 1.67+ across ore zone transitions, reagent regime changes, and seasonal water quality variation. The defects that have been forming on your froth surface — visible but undetected — are about to become the most actionable quality data your operation has ever generated.