Mining Conveyor Systems AI Vision QC: Plant Execs Guide
By Grace on June 15, 2026
Every unplanned conveyor stoppage in a mining operation carries a cost that extends well beyond the tonnage lost in that hour. By the time a belt failure, a quality rejection, or a contamination event surfaces through conventional inspection, the decision window to act has already closed. In 2026, the gap between when a defect signal appears in your conveyor data and when your team acts on it is the gap between a plant that controls its quality costs and one that is managed by them. AI Vision Quality changes that equation — not incrementally, but structurally.
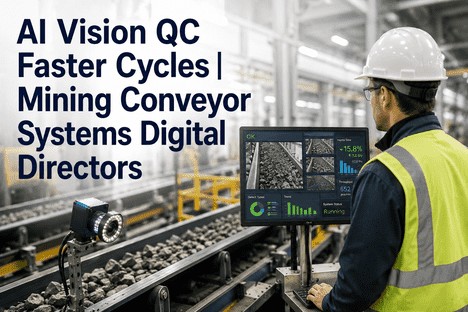
Plant Executives Eliminating 60%+ Quality-Driven Downtime Are Running AI Vision QC — Not Scheduled Inspections.
iFactory's AI Vision Quality platform delivers 100% belt coverage, self-tuning UCL/LCL limits, Western Electric rule monitoring, and scrap forecasts up to 24 hours ahead — built specifically for mining conveyor operations where defect elimination is the standard, not defect management.
Reduction in quality-driven downtime reported by mining operations deploying AI Vision QC on conveyor systems
98.8%
Defect classification accuracy achieved by deep-learning vision systems on mining conveyor belts in under 20 milliseconds
85%
Reduction in unplanned downtime from belt failures when AI vision monitoring replaces manual inspection schedules
24 hrs
Scrap forecast lead time giving plant executives an intervention window before defects reach the processing circuit
The Structural Problem With How Mining Plants Currently Detect Conveyor Quality Failures
Mining conveyor systems are not passive infrastructure. Every belt running ore through a processing circuit is simultaneously producing a continuous, readable signal about material quality, surface integrity, and process deviation. The problem is not that the signal is absent. The problem is that the detection architecture most plants rely on — scheduled manual inspections, static SPC control limits, and post-production quality testing — is structurally too slow to convert that signal into a production decision before the defect is already embedded in the batch.
Consider the sequence: a belt surface crack begins propagating on the night shift. A material load variation pushes belt speed outside the operating range that historically precedes a quality rejection. A foreign object enters the material stream. In a plant without AI vision monitoring, none of these events trigger an alert in real time. The inspection team finds the crack during the next scheduled walkthrough. The quality lab confirms the rejection hours after the batch was committed. The contamination event is traced retroactively from customer feedback. Each outcome shares the same root cause: the detection system is working on a timeline that cannot match the pace at which defects are produced.
The Detection Gap — Visualised
Conventional Detection Timeline
Defect signal appears in belt data
↓ Hours pass
Scheduled inspection locates damage
↓ More hours pass
Quality lab confirms rejection — batch committed, value lost
vs
AI Vision Quality Timeline
Defect signal appears in belt data
↓ Milliseconds
AI vision classifies damage, scrap risk forecast fires
↓ Plant executive acts
Batch isolated or process adjusted — defect eliminated before production
How AI Vision Quality Works on a Mining Conveyor System
The iFactory platform runs three simultaneous intelligence layers across the conveyor route. Each layer addresses a different failure mode and a different decision horizon — together they create a quality control architecture that operates at production speed rather than inspection speed.
Layer 1
Deep-Learning Belt Vision
Neural network vision models analyse continuous camera streams from along the conveyor route — detecting surface cracks, edge wear, splice degradation, material segregation, and foreign object contamination at 98.8% classification accuracy. The system works across dust, variable lighting, and extreme scale variation (5–300 pixel defect sizes) through a combination of visible-light cameras with adaptive image enhancement and infrared imaging in high-dust zones. Every detection is logged with timestamp, belt position, defect class, and severity score — producing a 100% inspection record for every shift.
Surface crack & tear detection
Foreign object classification
Infrared overlay in dust zones
Layer 2
Adaptive SPC with Western Electric Rules
Self-tuning UCL/LCL limits recalibrate continuously against the current process baseline — absorbing ore blend transitions, moisture shifts, and feed rate changes without manual recalibration. Western Electric rules run across all process variables in real time, detecting subtle out-of-control patterns (runs, trends, stratification) that a single-point threshold check misses entirely. False alarm rates drop 50–70% compared to static SPC, restoring operator trust in alerts and ensuring genuine scrap-risk signals stand out rather than being buried in noise.
Self-tuning UCL/LCL limits
Western Electric rules (all 8)
50–70% false alarm reduction
Layer 3
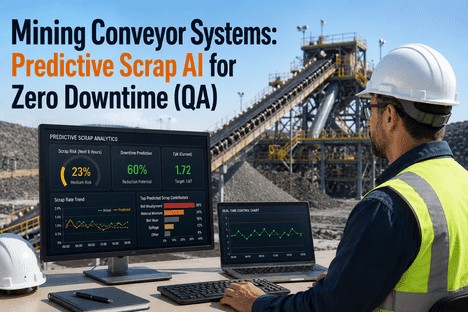
Root-Cause ML & 24-Hour Scrap Forecasting
Predictive ML models trained on historical pairings of conveyor process variables and downstream quality outcomes generate scrap risk forecasts up to 24 hours before a quality test could confirm the risk. When the current combination of belt speed, material load, vibration signature, thermal readings, and vision-detected conditions matches a historical pattern associated with an off-spec result, the system fires an alert with enough lead time for a production decision — not a post-hoc investigation. Root-cause ranking tells operators which variable combination is driving the risk, not just that risk exists.
24-hour scrap forecast
Root-cause variable ranking
92% forecast accuracy
Vision Detection · Adaptive SPC · Root-Cause ML
Three intelligence layers. One quality platform. Every defect signal read before it becomes a production decision you cannot undo.
iFactory fuses deep-learning vision, adaptive statistical process control, and predictive ML into a single quality layer that deploys over your existing SCADA and historian infrastructure without replacement.
The Five Conveyor Failure Modes AI Vision QC Catches Before They Cost You
Mining conveyor quality failures cluster around five predictable patterns. Each one carries a different detection profile and a different cost trajectory — and each one has a point in its development where an AI vision system can intervene before the cost is committed.
Failure Mode → What AI Detects → When It Fires
1
Belt Surface Cracks & Longitudinal Tears
Accumulate over multiple shifts before visible failure. Damage containment and spillage rates degrade progressively.
AI Detection
Frame-by-frame surface crack progression mapped and logged. Severity score updated every scan cycle.
Alert Fires
On threshold approach — hours before failure event, not on catastrophic failure.
2
Splice Degradation & Steel-Cord Damage
Invisible to visual inspection without magnetic sensing. Failure triggers emergency stops measured in hours of lost production.
AI Detection
Magnetic cord sensor integration flags splice changes and degradation patterns weeks before failure threshold.
Alert Fires
Converts unplanned failure into a planned maintenance intervention scheduled for the next available window.
3
Idler & Pulley Thermal Anomalies
Bearing failures rarely announce themselves before becoming a production-stopping event. Early heat signatures are detectable long before seizure.
AI Detection
Thermal sensors monitoring idler and pulley temps continuously. A 15–25°C rise above baseline is consistently present hours to days before seizure.
Alert Fires
Days before bearing failure event — enabling planned maintenance scheduling, not reactive fire-fighting.
4
Material Quality Drift & Contamination
Foreign objects and ore segregation from speed and load variations change the quality profile of what the processing circuit receives.
AI Detection
Vision-plus-process-variable fusion correlates real-time contamination events with historical patterns associated with downstream quality failure.
Alert Fires
Before the processing circuit confirms the rejection — with enough lead time for batch isolation and circuit adjustment.
5
Belt Deviation & Misalignment
Even minor deviations cause material spillage and accelerated edge wear. Severe misalignment causes belt tearing and roller-frame damage.
AI Detection
Attention-mechanism vision models using semantic segmentation detect deviation and measure belt edge position against physical roller reference lines.
Alert Fires
On measurable deviation onset — before spillage escalates and before structural damage to the belt or frame occurs.
Why Western Electric Rules Matter More Than Single-Point UCL/LCL Limits in Mining
Most mining SPC deployments monitor whether a process variable breaches an upper or lower control limit. That is a necessary condition for catching obvious out-of-control events — but it is not sufficient for catching the gradual, systematic patterns that account for the majority of quality-driven conveyor failures. Western Electric rules extend control chart monitoring to detect eight distinct out-of-control patterns that a single-point threshold check misses: runs of points on one side of the centreline, trends of consecutive ascending or descending points, unusual clustering near control limits, and stratification patterns that indicate process stratification rather than random variation.
In a mining conveyor context, these patterns carry specific interpretations. A run of seven consecutive points above the process mean on a material load variable indicates a systematic feed change, not random variation. A trend of six consecutively rising vibration readings on an idler indicates developing bearing wear, not process noise. Catching these patterns requires monitoring all eight rules simultaneously across every process variable — which is computationally practical only when the SPC system is AI-driven rather than manually administered.
Static Single-Point SPC — What It Misses
Control limits calibrated once at the last capability study — every ore blend change since then means the limits no longer reflect the real process.
Only fires when a point breaches UCL or LCL — systematic trends, runs, and patterns inside the limits go undetected.
High false alarm rates during ore blend transitions erode operator trust over weeks — genuine risk signals are ignored alongside false ones.
Manual documentation of limit changes creates audit risk — rationale for current thresholds is often incomplete or unavailable.
Adaptive SPC with Western Electric Rules — iFactory
Limits recalibrate continuously — every ore blend change, moisture shift, and feed rate variation is absorbed into the current baseline automatically.
All eight Western Electric rules run simultaneously across every process variable — detecting trends, runs, stratification, and clustering that signal risk before breach.
Regime transition management holds alert generation during blend changes — false alarms drop 50–70%, genuine risk signals stand out clearly.
Every recalculation auto-logged with timestamp, triggering condition, and prior vs new limit values — audit trail generated with zero manual effort.
What Plant Executives See — and Act On — in the iFactory Dashboard
The executive dashboard aggregates scrap risk, defect frequency, Cpk trends, and COPQ impact across all active conveyor zones into a single management view. It is designed for the plant executive who needs programme-level visibility — not machine-level process data — with the granularity available on demand when a specific alert requires investigation.
Live Scrap Risk Score
Real-time composite risk index across all conveyor zones — ranked, quantified, and colour-coded so the highest-risk zone is always immediately visible.
COPQ Impact Trending
Scrap rate and financial impact tracked against pre-deployment baseline continuously — giving executives a real-time view of COPQ reduction progress.
One-Click ISO 9001 Export
Control limit histories, defect event logs, CAPA records, and Cpk trend exports generated automatically and available for any date range on demand.
"
We were seeing the same quality rejection category appear in our COPQ tracking every four to six weeks. Each time we investigated retroactively — pulled the process historian, reviewed the operator logs, looked at the inspection records. The pattern was consistent: a specific combination of material load increase and belt speed reduction was preceding the rejections every time. But by the time we identified it, the next batch had already been processed under the same conditions. After deploying the AI vision platform and connecting the predictive model to our scrap forecast workflow, that combination now triggers an alert before the batch is committed. We adjusted the operating protocol. The rejection category has not appeared in our COPQ report in five months.
— Operations Director, Hard Rock Mining Operation, 6 Mtpa Overland Conveyor System
The Real Cost of Quality-Driven Downtime: What COPQ Looks Like in a Mining Operation
Plant executives who frame quality improvement conversations around scrap rate percentage are working with the most visible fraction of the actual cost. The American Society for Quality's Cost of Poor Quality framework documents total COPQ reaching 15–20% of revenue when internal failure, external failure, appraisal, and prevention costs are fully accounted for. In a mining operation generating $50M annually, that is $7.5–10M in recoverable margin sitting in the quality cost structure.
Internal Failure
Scrap material, rework, batch re-processing, conveyor re-inspection, and production hold costs. The most visible COPQ category — and the one AI Vision QC targets most directly through scrap forecasting and batch isolation workflows.
External Failure
Customer rejections, quality claims, and penalty clauses triggered when defects escape the operation. External failure costs typically run 5–10× the equivalent internal failure cost — making escape prevention the highest-value application for the predictive ML model.
Appraisal Costs
Manual inspection labour, scheduled belt shutdowns, sample testing, and audit preparation. Machine vision continuous monitoring converts a large portion of appraisal cost from manual labour to automated coverage — at higher detection reliability with a complete inspection record.
Prevention Costs
Quality system maintenance, SPC administration, and process improvement programme costs. Adaptive SPC with automated documentation reduces the administrative cost of the prevention programme — making the total prevention investment more efficient as well as more effective.
From Sensor to Production-Grade Forecast: The Implementation Pathway
The question plant executives ask most consistently when evaluating AI Vision QC: how long before the system is generating forecasts the plant can act on? The implementation follows a consistent three-phase structure regardless of operation size, ore type, or existing infrastructure — and does not require replacing the SCADA, historian, or DCS systems already in place.
WEEKS 1–3
Integration & Vision Commissioning
Process historian connection via OPC-UA or PI, LIMS quality record pairing, vision camera commissioning with dust-adaptive image enhancement, and thermal sensor integration. A minimum of six months of paired process-to-quality history is sufficient for initial model training. Twelve to eighteen months produces stronger forecast accuracy across ore blend transitions.
Deliverable: Full sensor stack live, baseline quality record established.
WEEKS 4–6
Shadow Mode Validation
The predictive model runs in parallel with the existing quality programme — generating scrap risk forecasts without using them to drive production decisions. The quality team validates forecast accuracy against actual test outcomes over two to four weeks. This period generates the documented accuracy data the plant needs to authorise transition to primary decision input status.
Deliverable: Forecast accuracy report with site-specific performance data.
WEEK 7+
Live Deployment & COPQ Tracking
Forecasts become primary decision inputs for batch isolation, production parameter adjustments, and maintenance scheduling. COPQ tracking activates — scrap rate, defect frequency, and financial impact tracked against pre-deployment baselines from day one. ISO 9001 documentation is generated automatically from all platform activity, with audit export available on demand.
Deliverable: Live COPQ reduction dashboard with audit documentation active.
No Infrastructure Replacement Required
Seven weeks from first sensor connection to production-grade scrap forecasts. Calculate what a 24-hour detection lead time is worth to your conveyor operation.
iFactory connects to your existing SCADA, historian, and LIMS through standard industrial protocols — OPC-UA, Modbus, OSIsoft PI, Wonderware — without changing the control architecture your operators already know.
The defect signals in a mining conveyor operation have always been present. Belt surface condition, process variable patterns, material load variations, thermal signatures from idlers and pulleys — the data exists in real time, continuously, across every shift. The obstacle has never been the absence of signal. It has been the absence of a detection architecture fast enough to convert that signal into a production decision before the defect is committed to the batch.
AI Vision Quality for mining conveyor systems closes that gap at every level simultaneously. Deep-learning belt vision provides 100% inspection coverage that no scheduled walkthrough can match. Adaptive SPC with Western Electric rules eliminates the false alarm noise that erodes operator trust in static control charts. Root-cause ML forecasting generates actionable scrap alerts up to 24 hours before a quality test could confirm the risk. The documented outcomes across mineral processing operations that have made this transition are consistent: 60%+ reduction in quality-driven downtime, 85% reduction in unplanned belt failures, and COPQ reduction that typically delivers ROI in under 12 months from first deployment.
For plant executives whose operations are running on scheduled inspections and static control charts, the question is no longer whether AI Vision QC delivers better outcomes — the evidence base is established. The question is how much of the current COPQ figure is recoverable, and how quickly the platform can be configured to your conveyor system and ore profile. Talk to an expert about a free COPQ reduction assessment, or book a demo to see the platform configured for your operation.
Frequently Asked Questions
High-dust environments are addressed through a multi-modal imaging architecture. Visible-light cameras with adaptive image enhancement algorithms — specifically multi-scale Retinex processing that compensates for dust scatter — are supplemented by infrared cameras operating on wavelengths that maintain detection reliability when visible-light channels are degraded. The two imaging modalities are fused at the classification layer, producing a combined signal that holds above 98% detection accuracy across the dust and lighting variation profiles documented in active iron ore and coal mining environments. Camera positioning, imaging intervals, lighting configuration, and enhancement weights are calibrated to the specific dust profile of each conveyor route during commissioning — not to a generic mine environment standard. Talk to an expert about site-specific vision configuration for your conveyor environment.
The platform is designed to declare regime uncertainty rather than generate inaccurate forecasts during transitions. When a blend change is registered, the system enters a managed transition window — configurable based on the operation's typical blend stabilisation time, usually four to twenty-four hours depending on processing circuit volume. During this window, scrap forecasts are flagged as transitional, alert thresholds are widened to avoid false alarms from the regime shift itself, and the self-tuning limits begin calibrating to the new baseline. Every transition event is automatically logged with a timestamp and blend change code — providing the audit documentation that demonstrates the quality programme actively managed the uncertainty. Book a demo to see transition management configured for a multi-blend production programme.
Yes. iFactory's pre-deployment COPQ assessment uses the operation's existing quality records — defect frequency data, scrap tonnage history, rejection rates by category, and inspection labour costs — to build a site-specific model of current COPQ and estimate the financial impact of moving to predictive detection. The assessment identifies the highest-cost defect categories, estimates what detection lead time those categories require to enable effective intervention, and maps that requirement to what the platform's 24-hour forecast capability would have delivered against the historical record. For most operations, this produces a conservatively estimated COPQ reduction range that can be used directly in an investment case. The assessment is available at no cost as part of the initial engagement. Talk to an expert to request your COPQ reduction assessment.
iFactory connects to existing SCADA and DCS infrastructure through standard industrial protocol connectors — OPC-UA, Modbus, and historian APIs including OSIsoft PI and Wonderware — without requiring changes to the existing control architecture. Predictive alerts write back to the SCADA operator view through the same protocol layer, so operators see risk alerts in the familiar interface rather than navigating a new system. LIMS integration follows the same approach — quality test results read from the LIMS as they are entered, updating the predictive model continuously and closing the loop between forecast and confirmed outcome automatically. No infrastructure replacement is required. The typical integration scope completes within the Phase 1 commissioning window. Book a demo to review the integration architecture for your specific SCADA and historian environment.
All eight Western Electric rules run simultaneously across every monitored process variable — detecting single-point breaches, runs of seven or more consecutive points on one side of the centreline, trends of six consecutively ascending or descending points, two out of three points in the outer third of the control zone, four out of five points beyond one sigma, fifteen consecutive points within one sigma of the centreline (stratification), eight consecutive points beyond one sigma on either side (mixture), and unusual patterns in any combination. In a mining conveyor context, each rule has a specific operational interpretation — a seven-point run on material load indicates a systematic feed change; a six-point trend on vibration indicates developing bearing wear. The rules are applied to the current adaptive baseline rather than a static centreline, so they detect genuine out-of-control conditions even as the process baseline shifts between ore blends. Talk to an expert about how Western Electric rule sensitivity is configured for your specific process variable set.
Your Conveyor Data Already Contains Tomorrow's Defect Signal. Find Out What Catching It 24 Hours Earlier Is Worth to Your Operation.
iFactory's AI Vision Quality platform for mining conveyor systems — deep-learning belt monitoring, adaptive SPC with Western Electric rules, 24-hour scrap forecasting, root-cause ML, and ISO 9001 audit documentation, all running from a single quality intelligence layer that deploys without replacing your existing infrastructure.