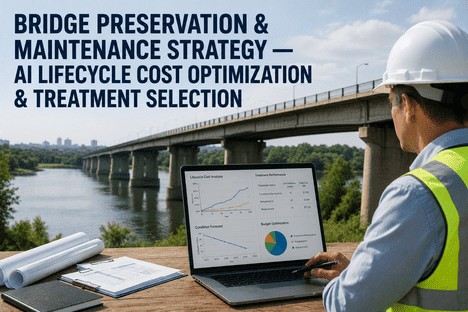
Every bridge asset manager faces the same structural decision problem: when a bridge in the portfolio shows signs of deterioration, the choice between preventive maintenance, rehabilitation, and replacement carries cost implications that compound over decades. The decision is rarely about a single bridge. It is about how to allocate a constrained budget across a portfolio where each asset has a different age, condition rating, traffic loading, environmental exposure, and strategic importance. What most asset management programmes lack is not data — it is a decision framework that translates inspection data, deterioration forecasts, and cost models into a defensible, optimised treatment plan for the full portfolio. AI-powered lifecycle cost optimisation closes this gap. This is the asset manager's guide to deploying it.
Asset Managers Who Minimise Total Cost of Ownership Across Their Bridge Portfolio Share One Capability: Their Treatment Decisions Are Driven by AI-Optimised Lifecycle Cost Models, Not Calendar-Based Schedules.
iFactory's AI bridge asset management platform gives asset managers dynamic lifecycle cost models that evaluate every preservation, rehabilitation, and replacement option against current condition data, deterioration forecasts, and portfolio-level budget constraints — with treatment selection optimisation, CAPEX forecasting, and audit-ready documentation built in from day one.
Reduction in total lifecycle cost achievable when AI-optimised treatment selection replaces calendar-based maintenance scheduling — documented across DOT bridge programmes and international highway agency deployments
94%
Accuracy of AI-powered deterioration forecasting models trained on inspection cycles, environmental exposure, traffic loading, and material-specific degradation curves for steel and concrete bridge assets
3-5x
Cost multiple of reactive bridge repair versus planned preventive preservation — the financial penalty that asset managers absorb when maintenance strategy defaults to run-to-failure due to inadequate decision support tools
$191B
Estimated bridge rehabilitation needs across the United States as documented by the ASCE 2025 Infrastructure Report Card — the portfolio-level funding gap that demands optimal treatment selection for every dollar allocated
A maintenance schedule exists. Inspections are performed on cycle. Condition ratings are recorded in the management system. But at portfolio review time, the asset manager faces a familiar pattern: too many bridges need major rehabilitation simultaneously, the preservation budget is already committed to next year's programme, and the replacement decision for the worst-condition assets keeps getting deferred because the cost profile does not align with the current funding cycle. The schedule looked right on paper. The condition data was accurate. The gap is not in the inspection data — it is in the treatment selection logic that connects condition data to the optimal intervention at the optimal time. When treatment decisions are driven by calendar intervals and historical practice rather than by lifecycle cost optimisation, the portfolio accumulates a structural cost penalty that no amount of inspection accuracy can correct.
The Four Cost Levers That Drive Bridge Portfolio Total Cost of Ownership — and How AI Optimisation Addresses Each One
01
Treatment Timing Mismatch With Deterioration Curve
Every bridge follows a deterioration curve that is unique to its material composition, environmental exposure, traffic loading, and maintenance history. Applying preservation treatments too early wastes budget on assets that still have functional service life. Applying them too late means the asset has crossed the threshold where preservation is feasible and rehabilitation or replacement becomes unavoidable. The industry standard of fixed-interval treatment scheduling ignores the shape of the individual deterioration curve. The result is a systematic misallocation of preservation resources that drives up portfolio-level cost without extending service life proportionally.
AI fix: Deterioration model calibrated per asset -> optimal treatment window identified from the curve shape, not the calendar.
02
Portfolio-Level Budget Fragmentation
When each bridge is evaluated for treatment independently, the portfolio effect is invisible. Three bridges may each independently justify rehabilitation within the same budget year — but the combined cost exceeds the available funding. Without portfolio-level optimisation, the asset manager defers one or two, accepts the condition deterioration that occurs during the deferral period, and pays the cost premium of more extensive intervention later. The independent evaluation logic treats each bridge in isolation. The portfolio cost impact is the cumulative result of dozens of individually rational decisions that produce a suboptimal system-level outcome.
AI fix: Portfolio optimisation engine evaluates all assets simultaneously -> treatment allocation that minimises total cost across the full programme under budget constraints.
03
Rehabilitation vs Replacement Decision Without Economic Threshold Analysis
The decision to rehabilitate versus replace a bridge is the single highest-impact cost decision in the asset lifecycle. Replacing a bridge that could have been cost-effectively rehabilitated consumes capital that could have served multiple preservation projects across the portfolio. Rehabilitating a bridge that has passed the economic threshold for replacement commits ongoing maintenance expenditure that exceeds the annualised cost of replacement. Most asset managers rely on condition-rating thresholds and engineering judgement for this decision because their decision support tools do not calculate the economic crossover point. The result is a systematic bias toward either over-preservation or premature replacement — both of which increase total portfolio cost over the planning horizon.
AI fix: Lifecycle cost crossover model calculates the economic replacement threshold per asset -> recommendation driven by cost-optimised timing, not condition rating alone.
04
CAPEX Forecasting Without Risk-Adjusted Deterioration Modelling
Capital expenditure forecasts for bridge portfolios are typically based on linear deterioration assumptions and historical spending patterns. Neither reflects the reality that deterioration accelerates as condition declines, that different assets deteriorate at different rates under the same environmental conditions, or that deferring a treatment today changes the cost profile of every future treatment decision in a non-linear way. Asset managers forecast budgets against models that systematically underestimate the cost impact of deferral decisions — producing funding requests that are accurate for the first year but diverge increasingly from reality in years three through ten. The gap between forecast and actual expenditure erodes confidence in the asset management programme and undermines funding requests to decision-makers.
AI fix: Non-linear deterioration models with risk adjustment -> CAPEX forecasts that reflect actual condition trajectories and the compounding cost impact of deferral decisions.
When Treatment Decisions Are Driven by the Calendar, the Portfolio Pays a Cost Penalty That Compounds Every Year. AI Optimisation Eliminates the Structural Gap Between Inspection Data and Treatment Selection.
iFactory builds the bridge between condition data and cost-optimised treatment decisions directly into the portfolio management platform — so asset managers see the total cost impact of every preservation, rehabilitation, and replacement option before the budget is committed, not after.
The AI Lifecycle Cost Optimisation Architecture for Bridge Portfolios
The iFactory AI bridge asset management platform operates as a three-layer decision intelligence system — deterioration forecasting at the asset level, treatment optimisation at the portfolio level, and CAPEX scenario modelling at the programme level. Each layer serves a different asset management function, and all three function continuously without requiring manual recalibration between planning cycles.
Layer 01
AI Deterioration Forecasting
Asset-level condition trajectory prediction using multi-variable ML models
The deterioration forecasting layer ingests all available bridge data — inspection condition ratings, material type and age, environmental exposure zone, traffic loading history, previous treatment records, and any structural health monitoring data — and builds a per-asset machine learning model that predicts the condition trajectory under different treatment scenarios. The model learns the actual deterioration pattern of each bridge rather than applying a generic curve from the management system default library. When new inspection data is entered, the model updates the trajectory immediately. Key outputs include the year each condition rating threshold will be crossed under the current do-nothing scenario, the year under each treatment option, and the confidence interval around each prediction expressed as a probability range. The deterioration forecast is the foundation that every subsequent optimisation decision is built on.
Per-asset ML deterioration model
Condition threshold year prediction
Confidence-interval output per asset
Layer 02
Portfolio Treatment Optimisation
Multi-constraint optimisation engine for treatment selection across the full portfolio
The optimisation layer takes the deterioration forecasts from Layer 01 and runs a multi-constraint optimisation algorithm that evaluates every combination of treatment options across the portfolio simultaneously. The constraints can include total budget per year, minimum condition rating targets for specific asset classes, traffic disruption windows, political or regulatory priorities, and workforce capacity limits. The optimisation output is a treatment schedule that specifies which bridge receives which intervention in which year — selected to minimise total lifecycle cost across the full portfolio over the planning horizon while satisfying all constraints. The asset manager can run scenarios: what happens to portfolio condition and total cost if the budget is reduced by 15 percent, or if a specific bridge must be advanced to the current year due to regulatory requirement. The optimisation recalculates the full schedule for each scenario, showing the cost-condition trade-off in a single comparison view.
Multi-constraint optimisation engine
Scenario comparison modelling
Budget-constrained treatment schedule
Layer 03
CAPEX Scenario & Audit Documentation
Automated capital planning and audit-ready investment rationale
Every optimisation run produces a full investment rationale for each treatment recommendation — the deterioration forecast that drove the timing, the lifecycle cost comparison across treatment options, the constraint that influenced the selection, and the total portfolio cost impact. This documentation is generated automatically in a format suitable for CAPEX approval submissions, funding requests to transportation authorities or governing boards, and audit review. The asset manager does not compile the rationale from multiple data sources. It is produced alongside the treatment schedule as a single exportable package. For audit purposes, the system maintains a complete history of every scenario run, every assumption used, and every treatment recommendation — demonstrating that the portfolio management programme is driven by documented, repeatable, data-informed decision logic rather than ad-hoc judgement.
The core decision that determines bridge portfolio total cost of ownership is the selection among preservation, rehabilitation, and replacement for each asset at each decision point. Each option has a different cost profile, service life extension, and consequence for the rest of the portfolio. AI-driven treatment selection replaces the condition-rating threshold approach with an economic crossover analysis that identifies the optimal decision for each bridge in the context of the full portfolio budget and condition targets.
Treatment Option 01
Preventive Preservation
Applied when the bridge is in good to fair condition and the deterioration curve shows that a relatively low-cost intervention now will extend service life by 10 to 15 years without requiring major structural work. Typical preservation includes deck sealing, joint replacement, concrete patching, and corrosion protection systems. The AI optimisation identifies preservation candidates by detecting bridges whose current condition and deterioration trajectory indicate that a small investment today avoids a rehabilitation need within the next three to five years. Preservation is the highest-ROI treatment category — the cost is typically 5 to 15 percent of replacement cost — but it is also the most commonly underutilised because it requires proactive identification rather than condition-triggered response.
Asset manager action: Run preservation candidate identification quarterly. Capture the cost avoidance in the portfolio performance report.
Treatment Option 02
Structural Rehabilitation
Applied when the bridge has declined beyond the preservation window but the superstructure or substructure retains sufficient capacity that targeted structural intervention can restore condition and extend service life by 20 to 30 years at 30 to 60 percent of replacement cost. Typical rehabilitation includes deck replacement, girder strengthening, bearing replacement, and scour countermeasures. The AI optimisation evaluates rehabilitation against replacement by calculating the economic crossover point — the year at which the annualised cost of keeping the rehabilitated bridge in service exceeds the annualised cost of replacement including all future maintenance. This crossover point is different for every bridge and depends on material type, remaining structural capacity, traffic loading, and environmental exposure. The model identifies bridges where rehabilitation is still economically optimal and those where the crossover has passed and replacement is the lower-cost option over the planning horizon.
Asset manager action: Review economic crossover analysis for all rehabilitation candidates. Distinguish between bridges where rehabilitation is cost-optimal and those where replacement is overdue.
Treatment Option 03
Full Replacement
Applied when the economic crossover analysis shows that the annualised cost of continued rehabilitation and maintenance exceeds the annualised cost of a new structure, or when the bridge has functionally obsolete design features that cannot be cost-effectively addressed through rehabilitation. The AI optimisation does not default to replacement only as a last resort — it calculates the crossover point objectively and schedules replacement at the economically optimal year given the portfolio budget constraints. Replacement candidates are ranked by the cost penalty of deferral: bridges where delaying replacement by one year adds the highest incremental cost to the portfolio receive priority. This prevents the common asset management pattern where replacement decisions are deferred repeatedly based on budget pressure, accumulating a deferral cost penalty that is invisible in the current-year budget but dominates the ten-year cost projection.
Asset manager action: Review replacement deferral cost impact annually. Use the cost-of-delay metric to prioritise replacement candidates against available capital.
Economic Crossover Model
How the AI Determines the Optimal Treatment Year for Each Bridge
The model calculates annualised lifecycle cost for each treatment pathway across the full planning horizon — and identifies the year at which the cumulative cost of one pathway crosses below the alternative.
Preservation Pathway
Annualised cost = preservation cost + future rehabilitation + ongoing maintenance, discounted to present value over expected extended service life
Rehabilitation Pathway
Annualised cost = rehabilitation cost + future maintenance cycles + end-of-life replacement, discounted to present value over remaining service life
Replacement Pathway
Annualised cost = replacement cost + future maintenance over design life of new structure, discounted to present value
Crossover Output
The model recommends the pathway with the lowest annualised cost at the current decision year, recalculated each planning cycle as new inspection data is entered
What the Asset Manager Dashboard Shows
The asset manager's view of the AI lifecycle cost optimisation platform is not a condition reporting interface — it is a portfolio investment management tool. The dashboard is designed around the questions asset managers need to answer continuously: What is the current condition of the portfolio and the trajectory? Which treatment decisions are due this planning cycle and what is the optimal option for each? Is the total cost of ownership trending toward or away from the target? And when the next funding request or audit arrives, is the investment rationale ready to present?
Portfolio View 01
Portfolio Condition Map with Deterioration Trajectory
A single-screen view of the full bridge portfolio displayed as a condition distribution chart with each asset plotted by current condition rating and projected condition at the next planning cycle. The trajectory overlay shows which bridges are stable, declining at expected rate, or declining faster than the deterioration model predicted. Asset managers see the portfolio condition status in one view, with the deterioration trajectory highlighting which assets require attention before the next scheduled inspection cycle.
Asset manager action: Filter by trajectory deviation. Bridges declining faster than predicted receive priority investigation before the next inspection cycle.
Portfolio View 02
Optimal Treatment Schedule by Year and Budget Scenario
The treatment schedule view displays the optimised allocation of preservation, rehabilitation, and replacement across the portfolio for the selected planning horizon and budget scenario. Each asset shows the recommended treatment, the year, the cost, and the lifecycle cost comparison versus the alternative options. Asset managers can toggle between scenarios — current budget, reduced budget, increased budget — and see the impact on portfolio condition trajectory and total cost of ownership. The view answers the single most common asset management question: what do we get for the budget we have, and what would additional funding achieve?
Asset manager action: Run three budget scenarios before the funding request. Present the cost-condition trade-off to decision-makers with quantified impact data.
Portfolio View 03
Total Cost of Ownership Trend and Forecast
The total cost of ownership trend line shows the annualised portfolio cost for each year of the planning horizon under the current optimised treatment schedule, segmented by cost category — preservation, rehabilitation, replacement, and ongoing maintenance. The forecast overlay shows the projected TCO trajectory if the current treatment schedule is fully funded versus the trajectory if budget is constrained and deferrals are required. Asset managers see the precise year when deferred treatment costs begin to compound, and the total cost penalty of underfunding expressed as a single portfolio-level number that can be communicated directly to budget decision-makers.
Asset manager action: Use the TCO forecast as the primary communication tool for funding requests. Show the cost of deferral in the same terms as the budget request.
Portfolio View 04
Deferral Cost Impact — The Cost of Waiting
Every treatment deferral has a measurable cost impact: the asset continues to deteriorate, the future intervention becomes more extensive, and the cost increases. The deferral cost impact view quantifies this for every asset where the optimal treatment year has passed or is approaching. Asset managers see the cost penalty of deferring each treatment by one year, two years, and five years — expressed as both the additional expenditure required and the reduction in remaining service life. This is the metric that transforms deferral from an invisible budget accommodation into a visible cost decision that can be escalated to funding authorities with the financial impact explicitly stated.
Asset manager action: Include deferral cost impact in every funding submission. Make the cost of underfunding visible in the same document as the funding request.
Every treatment recommendation in the optimised schedule includes the full investment rationale — deterioration forecast, lifecycle cost comparison across options, constraint inputs, and portfolio-level cost impact — generated automatically and held in a searchable, exportable format. CAPEX approval package preparation time drops from days of manual data compilation across inspection records, cost databases, and spreadsheet models to a single export covering any date range, asset class, or budget scenario. The optimisation history log — which shows every scenario run, assumption used, and recommendation generated — is the documentation that demonstrates the asset management programme is driven by a repeatable, data-informed decision framework.
Asset manager action: Export the full CAPEX rationale package for the next funding cycle. Present the investment logic alongside the schedule to demonstrate decision rigour.
Portfolio View 06
Preservation ROI — Cost Avoidance Tracking by Asset and Programme
The preservation ROI view tracks the cost avoidance generated by proactive preservation treatments against the counterfactual scenario of deferring treatment until rehabilitation or replacement becomes necessary. Every preservation treatment completed in the portfolio generates a documented cost avoidance — the difference between the preservation cost and the estimated rehabilitation cost that would have been required if the treatment had not been applied. This view aggregates cost avoidance by asset, by treatment type, and across the full programme — giving asset managers the data to demonstrate that the preservation budget is generating measurable returns in terms of avoided future expenditure. The preservation ROI metric is the single most persuasive data point for justifying preservation budget allocation to finance and governance stakeholders.
Asset manager action: Report preservation ROI to governance stakeholders quarterly. Make cost avoidance the primary performance metric for the preservation programme.
"
Our bridge portfolio management system was built around inspection schedules and condition ratings. It told us which bridges were in poor condition, but it could not tell us whether to preserve, rehabilitate, or replace them — and it certainly could not tell us which combination of treatments across the portfolio would minimise total cost. We were making treatment decisions based on the condition threshold each bridge happened to cross in a given year, not based on which decision was optimal for the portfolio. The AI lifecycle cost optimisation platform changed this by calculating the economic crossover for every asset simultaneously. Within the first planning cycle, the optimisation showed us that three bridges we had scheduled for replacement could be cost-effectively rehabilitated for 40 percent of the replacement cost — freeing capital to advance preservation treatments on five other bridges that were approaching the point of no return. The portfolio condition projection improved, and the ten-year total cost of ownership dropped by 22 percent in a single planning cycle. That finding came from the optimisation engine, not from the inspection database.
— Asset Manager, State Department of Transportation — Steel and Concrete Bridge Portfolio, 1,200+ Structures
Conclusion
Total cost of ownership reduction in bridge portfolios is not a maintenance scheduling problem — it is a treatment selection architecture problem. When preservation, rehabilitation, and replacement decisions are driven by condition-rating thresholds and calendar-based schedules rather than by lifecycle cost optimisation, the portfolio accumulates a cost penalty that no amount of inspection accuracy or maintenance efficiency can correct. The gap is structural: the decision framework connects condition data to treatment selection without evaluating the economic crossover between options or the portfolio-level interaction between simultaneous decisions on different assets.
AI lifecycle cost optimisation addresses all three dimensions simultaneously: deterioration models that learn the actual condition trajectory of each asset rather than applying generic curves, portfolio optimisation engines that evaluate every treatment combination across all assets under budget constraints, and economic crossover analysis that distinguishes between bridges where preservation, rehabilitation, or replacement is the genuinely optimal decision at the current point in the lifecycle. The documented outcomes across DOT and international highway agency deployments are consistent: 30 to 50 percent reduction in total lifecycle cost, deterioration forecasting accuracy exceeding 94 percent, and treatment selection logic that produces defensible, audit-ready investment rationale as a byproduct of the optimisation process rather than as a separate manual compilation exercise.
iFactory's AI lifecycle cost optimisation platform is designed for asset managers in bridge and structural programmes who need to move from condition-based treatment selection to cost-optimised portfolio investment management. Book a Demo to see the AI optimisation engine configured for your bridge portfolio, or talk to an expert about a free portfolio cost-optimisation assessment for your bridge asset management programme.
Frequently Asked Questions
The platform initialises using data already held in the bridge management system — inspection condition ratings, asset inventory data including material type and age, traffic loading records, environmental exposure zone classification, and treatment history. A minimum of two complete inspection cycles per asset is sufficient to calibrate the initial deterioration model for the primary material types — steel, reinforced concrete, prestressed concrete, and timber. Three to four inspection cycles provide more accurate trajectory modelling, particularly for assets with non-linear deterioration patterns such as concrete decks with chloride-induced corrosion. The gap between initial deployment and operational treatment recommendations depends on data quality and completeness but typically ranges from four to eight weeks for data ingestion and model training, followed by a two-week validation period where the optimisation outputs are reviewed against historical treatment decisions. During this validation period, the platform runs in scenario mode alongside the existing planning process without replacing it — allowing the asset manager team to compare the AI-optimised treatment schedule against the current planning outcome and validate the logic before transitioning to the optimised schedule for funding submissions. Book a Demo to see validation results from comparable bridge portfolio deployments.
The optimisation engine evaluates functional obsolescence separately from structural condition. Functional obsolescence factors — deck width, vertical clearance, load rating, approach geometry, and hydraulic capacity — are entered as constraints that modify the treatment pathway cost model. A bridge that is structurally sound but functionally obsolete for current traffic demands may still be a replacement candidate if the cost of bringing it to functional adequacy through rehabilitation exceeds the replacement cost. The economic crossover model captures this by calculating two separate cost pathways: rehabilitation to current structural standards without addressing full functional obsolescence, and full replacement to current design standards including all functional requirements. The comparison is not structural condition alone — it is the total cost of achieving functional adequacy through each pathway. For bridges where functional obsolescence is the primary driver, the model can also evaluate the option of targeted rehabilitation combined with operational restrictions, such as load posting or lane-width reduction, and compare the annualised cost of that restricted-service pathway against the full replacement pathway. The output is always the lowest-cost pathway to the required level of service over the planning horizon. Talk to an expert about configuring functional obsolescence constraints for your bridge portfolio profile.
Yes. The scenario modelling engine is designed specifically for the CAPEX planning and funding request workflow. Asset managers define the planning horizon — typically 5, 10, or 20 years — and the platform generates the optimised treatment schedule for the current budget scenario. From this baseline, the asset manager creates alternative scenarios with different budget levels, different condition targets, or different policy constraints, and the platform recalculates the full optimised schedule for each scenario. The comparison view shows the portfolio condition trajectory and total cost of ownership for each scenario side by side, with the difference expressed in both financial terms and condition outcomes. For funding requests to transportation authorities or governing boards, the asset manager can present the baseline scenario showing what the current budget achieves, the reduced-budget scenario showing what programmes would have to be deferred and what the deferral cost penalty would be, and the increased-budget scenario showing the additional condition improvement and cost avoidance achievable with incremental funding. Each scenario export includes the full investment rationale — not just the numbers, but the documented logic connecting each treatment recommendation to the deterioration forecast and economic crossover analysis that drove it. This transforms the CAPEX submission from a spreadsheet of projected expenditures into a documented investment case with quantified trade-offs. Book a Demo to see the scenario comparison view configured for transportation agency CAPEX planning workflows.
For assets with limited inspection history, the deterioration model uses a hierarchical calibration approach. The primary tier uses asset-specific data where available — any existing inspection records, material type, age, environmental exposure, and traffic loading — to build the best-fit model for that specific asset. Where asset-specific data is insufficient to produce a statistically reliable trajectory, the model draws on a peer-group deterioration curve built from similar assets in the portfolio — same material type, similar environmental zone, comparable traffic loading range — and applies a confidence weighting that reflects the data quality difference. As new inspection data is entered for the asset, the model transitions progressively from the peer-group curve to the asset-specific curve, with the confidence interval narrowing with each new data point. This approach ensures that every asset in the portfolio generates a treatment recommendation from the first day of deployment — assets with complete histories produce highly specific recommendations, while assets with limited histories produce recommendations with wider confidence intervals that tighten as inspection data accumulates. The model outputs the confidence level alongside every recommendation, so the asset manager knows which recommendations are based on strong asset-specific data and which carry wider uncertainty bands due to limited inspection history. Talk to an expert about configuring peer-group deterioration curves for your bridge portfolio material types and environmental zones.
Treatment Decisions Driven by the Calendar Miss the Economic Crossover Point. AI Optimisation Finds It for Every Asset in the Portfolio. Get a Free Portfolio Cost-Optimisation Assessment.
iFactory's AI lifecycle cost optimisation platform for bridge and structural asset managers — deterioration models calibrated per asset, portfolio-level optimisation engines that evaluate every treatment combination under budget constraints, economic crossover analysis for preservation versus rehabilitation versus replacement decisions, and audit-ready CAPEX rationale generated automatically from the condition data your programme already collects.