Traffic Signal & Streetlight Maintenance — AI Asset Management & Outage Prevention
By Grace on June 19, 2026
Across the United States, more than 330,000 signalized intersections and an estimated 50 million streetlights form the invisible nervous system of the surface transportation network. Together they manage over 300 billion vehicle movements per year through precise coordination that most road users never notice — until something breaks. When a traffic signal goes dark, crash rates at that intersection increase by nearly 300% within the first hour. When a streetlight fails, the resulting dark corridor creates safety hazards that persist for an average of seven days in reactive maintenance programmes. Maintenance operations directors at state DOTs and municipal public works agencies manage thousands of these assets with systems designed for a different era — paper logs, spreadsheet-based inventory, reactive dispatch triggered by citizen complaints, and preventive maintenance schedules that follow calendar dates rather than actual asset condition. The agencies that consistently achieve the lowest outage rates, the fastest repair times, and the longest asset life have one operational advantage in common: they have replaced calendar-based maintenance with AI-powered predictive asset management that knows what each signal and streetlight needs before it fails. This is the operations director's guide to deploying it.
The Operations Directors Who Maintain 99.8% Signal and Streetlight Availability Have One Thing in Common: Their Maintenance Schedule Is Driven by Asset Condition, Not Calendar Dates.
iFactory's AI-powered asset management platform gives operations directors predictive diagnostics for every signal controller and streetlight in the network — with remaining useful life forecasts, automated work order generation, and compliance-ready maintenance records built in from day one. Deployed by state DOTs and municipal public works departments managing networks from 500 to 50,000 assets.
Reduction in emergency repair dispatches when predictive diagnostics replace reactive citizen-report models — documented across municipal signal and lighting programmes using AI-driven fault detection
297%
Increase in crash rates at signalized intersections within the first hour of a dark-signal outage — making outage prevention a public safety priority, not just a maintenance metric
25-40%
Of signalized intersections in the US currently operating beyond their 15-20 year design life — driving demand for predictive diagnostics that extend serviceable life and prioritize replacement capital
7 Days
Average time from streetlight failure to repair in a reactive maintenance programme — reduced to under 4 hours when AI-powered fault detection and automated work order generation are deployed
The Core Problem in Signal and Lighting Maintenance: Why the Reactive Model Fails Both Safety and Budget
A traffic signal cabinet at a suburban arterial intersection houses 15 to 30 individual components that must function in precise coordination — a controller running timing firmware, a conflict monitor that validates signal states, detector cards processing vehicle presence, LED modules in each signal head, communication modules linking to the central system, and power supply equipment protecting the entire assembly. When one of these components begins to degrade, it rarely fails instantaneously. Voltage drifts. Thermal stress accumulates. Communication errors increase. But in a reactive maintenance programme, no one knows until the intersection goes dark and a citizen calls 311. The same dynamic applies to streetlights: a single LED driver failure takes out an entire fixture, and without telemetry at the fixture level, the operations director learns about it when the night patrol finds it or the complaint log grows. This is the defining failure of the reactive model — not the inability to repair assets, but the inability to know they are failing until the failure is complete. Predictive asset management makes this knowledge continuous and automatic.
The Four Failure Modes That Drive Signal and Lighting Downtime — and How Predictive Asset Management Eliminates Each One
01
Controller Degradation Detected Too Late
Traffic signal controllers have an expected service life of 15 to 20 years, but environmental stress — temperature cycling inside cabinets, voltage surges, humidity ingress — accelerates degradation on a unit-by-unit basis. Two controllers installed on the same date at intersections five miles apart may have dramatically different remaining useful lives. Calendar-based replacement wastes capital on units still in good condition while leaving failing units in service until they cause an outage. Operations directors managing 500+ intersections cannot assess the condition of each controller individually without automated diagnostics.
Predictive fix: Continuous controller health monitoring with remaining useful life forecast — replace based on condition, not age.
02
Lamp and LED Module Failures Are Invisible Until Outage
An LED traffic signal module has a rated life of 7 to 10 years, but individual driver failures, solder joint degradation, and thermal stress cause units to fail at unpredictable intervals. Streetlight LED fixtures experience the same variability. Without telemetry at each fixture or signal head, the first indication of failure is a dark signal face or a streetlight outage. In reactive programmes, the average time from failure to repair is seven days for streetlights and several hours for critical signal outages. The safety and liability implications of a week-long dark street are significant — and entirely preventable.
Predictive fix: Real-time current and voltage monitoring at each fixture — failure alerts generated within seconds, not days.
03
Preventive Maintenance Follows Dates, Not Conditions
Standard preventive maintenance programmes schedule cabinet inspections, detector testing, and lamp replacement at fixed intervals — quarterly, semi-annual, annual. This approach treats all assets identically: an intersection in a corrosive coastal environment with high salt exposure receives the same maintenance interval as a climate-controlled intersection inland. The result is systematic waste — crews inspect assets that do not need inspection while degradation at high-stress intersections proceeds unchecked between scheduled visits. The maintenance budget is fully allocated, but the highest-risk assets are not receiving the attention they require.
The reactive model depends on the public to detect failures. A single intersection knockdown generates an average of 12 to 15 citizen calls before a crew is dispatched — each call logged, triaged, and routed through the system, consuming dispatcher time. Night patrols for streetlight detection consume fuel and labor hours searching for outages that could be identified instantly through telemetry. The cost per reactive truck roll for a single signal or light repair averages $150 to $300 when factoring in labor, travel, and equipment. When the same crew could repair five grouped failures in a single route if they knew the locations in advance, the efficiency loss is substantial and compounding.
Predictive fix: Automated fault detection generates precise work orders — crews repair grouped failures in optimized routes, not single-call dispatches.
Reactive Maintenance
Citizen calls detect failures. Single-truck dispatch per repair. Calendar-based inspections. Unknown asset condition. 7-day average repair time. Spreadsheet inventory. Emergency budgets consumed by overtime.
Predictive AI-Managed
Telemetry detects failures in seconds. Grouped repairs on optimized routes. Condition-based inspections. Live remaining useful life. Under 4-hour repair time. GIS-connected asset registry. Maintenance budget allocated by risk priority.
When Signal and Streetlight Maintenance Is Reactive, the Operations Director Is Always One Failure Behind. Predictive Asset Management Puts Every Asset's Condition on One Screen.
iFactory builds the distinction between calendar-based and condition-based maintenance directly into the asset management engine — so operations directors deploy crews based on what each signal and streetlight actually needs, not what the schedule says.
The iFactory AI Asset Management Architecture: Three Capabilities for Signal and Lighting Operations
The iFactory AI asset management platform operates as a three-capability system for signal and lighting operations — asset-level predictive diagnostics at the component level, network-wide condition monitoring at the system level, and compliance-ready maintenance records at the documentation level. Each capability serves a different operations management function, and all three run continuously without requiring operations director intervention to maintain.
Capability 01
Predictive Diagnostics Per Asset
Remaining useful life and failure probability for every signal controller and streetlight fixture
The predictive diagnostics layer ingests telemetry data from signal controllers and streetlight monitoring nodes — voltage, current, power factor, thermal readings, communication status, and operational cycle counts — and maintains a real-time health model for each individual asset. The model calculates remaining useful life based on actual operating conditions, not manufacturer-rated averages: a traffic signal controller in a coastal cabinet with high thermal stress receives a different life forecast than an identical controller in a climate-controlled interior cabinet. When the model detects parameters trending toward failure thresholds — voltage drift beyond a configurable band, intermittent communication loss exceeding a frequency threshold, current draw deviating from the fixture baseline — it generates a diagnostic alert with the specific component at risk and the estimated time window before failure. The operations director sees not just which assets are at risk, but which component inside each asset is driving the risk.
Per-asset health model
Remaining useful life forecast
Component-level fault isolation
Capability 02
Network-Wide Condition Monitoring
One-screen visibility of every asset's status across the entire service area
The network monitoring layer aggregates per-asset diagnostics into a single geospatial view of the entire signal and streetlight inventory. Each asset is plotted on a map with a status indicator — normal, monitoring, alert, or critical — and the colour transitions automatically as the predictive model updates. The operations director sees which intersections have active diagnostics, which streetlight circuits are drawing abnormal current, and which cabinet environments are accumulating thermal stress, all without navigating individual asset records. Filters allow the view to be segmented by asset type, geographic zone, risk level, or date of last inspection. When an asset enters alert status, the system generates a work order automatically with the location, the specific component requiring attention, the diagnostic data supporting the alert, and a recommended repair action based on the failure mode identified.
Geospatial asset map
Status filtering by risk level
Automated work order generation
Capability 03
Compliance-Ready Maintenance Records
Automated documentation for MUTCD compliance, signal warrants, and asset lifecycle reporting
Every inspection event, diagnostic alert, component replacement, and repair action in the iFactory platform is logged automatically with the asset ID, GPS location, technician identifier, materials used, and the condition data that triggered the action. This creates the documentation chain that MUTCD compliance and asset lifecycle management requirements demand: a complete maintenance history for every signalized intersection and streetlight circuit in the network, searchable by asset, date range, or component type. For agencies managing signal warrant re-evaluations, the platform provides asset condition data that supports warrant analysis — showing that signal equipment was maintained to current standards at the time of the evaluation. Annual maintenance activity reports, component replacement trends, and asset depreciation schedules are generated automatically and exportable for budget justification, capital planning, and regulatory review.
MUTCD compliance records
Asset lifecycle history
Budget and capital planning reports
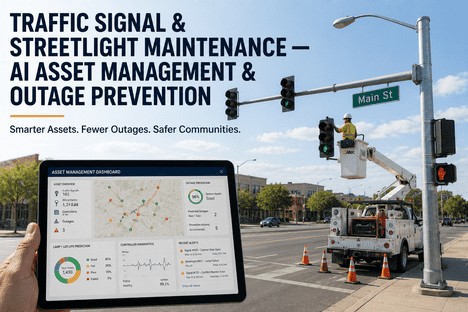
What the Asset Management Dashboard Shows the Operations Director
The operations director's view of the iFactory AI asset management platform is not a work order system — it is an operations intelligence tool. The dashboard is designed around the questions that operations directors need to answer every day: What is the current health of my asset network and where is the next failure likely to occur? Which assets need inspection based on actual condition rather than calendar schedule? Is my maintenance programme extending asset life or just cycling through repairs? And when the budget request arrives, do I have the data to justify every dollar?
Asset View 01
Live Network Health — Signals and Streetlights on One Map
A single geospatial view showing every signalized intersection and streetlight circuit in the network, colour-coded by current health status. Green indicates normal operation with no active diagnostics. Yellow indicates an asset under monitoring with parameters trending outside normal range but not yet at alert threshold. Red indicates an active alert requiring attention. The operations director sees the network-wide status in seconds without scrolling through lists or drilling into individual assets. Clicking any asset opens its full diagnostic history, current telemetry readings, and projected remaining useful life.
Director action: Prioritise crew deployment by map status. Red alerts receive immediate assignment. Yellow assets scheduled for next inspection cycle.
Asset View 02
Remaining Useful Life — Ranked by Asset Class and Zone
The remaining useful life view ranks all assets by projected service life remaining, segmented by asset class — signal controllers, LED modules, streetlight fixtures, detector cards, communication modules. The operations director sees which assets are approaching end-of-life across the entire network, ranked by risk priority. This view drives capital replacement planning: instead of replacing controllers based on a fixed age threshold, replacement is scheduled when the predictive model shows remaining useful life below a configurable threshold, typically 12 to 18 months. The result is a capital plan that allocates replacement budget to the assets that genuinely need it, not the assets that simply reached a calendar anniversary.
Director action: Use RUL rankings to build capital replacement budget. Replace assets that need replacement, not assets that reached a date.
Asset View 03
Diagnostic Event Log — Trend Analysis by Failure Mode
Every diagnostic alert generated by the predictive model is recorded in the event log with the asset ID, the specific component flagged, the telemetry data that triggered the alert, and the recommended repair action. The trend analysis view aggregates events by failure mode — voltage drift, thermal stress, communication loss, current deviation — and displays frequency over time. The operations director who sees that voltage drift events are clustering in a specific geographic zone or cabinet model has a systemic finding that drives a procurement specification change, a cabinet ventilation upgrade, or a targeted inspection programme. Trend analysis converts individual repair actions into fleet-wide improvement decisions.
Director action: Failure mode trends escalate to engineering. Systemic issues addressed at fleet level, not asset by asset.
Asset View 04
Work Order Optimisation — Grouped Repairs on Efficient Routes
When diagnostic alerts generate work orders, the platform groups repair locations by geographic proximity and routes crew assignments to minimise travel time between stops. A crew that would have been dispatched to a single streetlight repair under the reactive model instead receives a route of five grouped repairs in a single shift. The work order optimisation view shows pending repairs, the estimated time for each grouped route, and the resources required. The operations director can adjust the grouping criteria — maximum route time, priority level threshold, geographic boundary — and see the impact on completion time and crew utilisation in real time.
Director action: Grouped repair routes reduce truck rolls. Crews repair more assets per shift with less travel time.
Asset View 05
Maintenance Programme Performance — MTBF and Repair Cost Trends
The performance dashboard tracks mean time between failures, average repair cost per asset class, and maintenance spend trend over time — segmented by asset type, geographic zone, and failure mode. The operations director sees whether the predictive maintenance programme is actually extending asset life and reducing costs, or if intervention is required to adjust the programme. When MTBF is improving across most asset classes but declining for a specific controller model, the data supports a targeted replacement programme rather than a network-wide reaction. Repair cost trends show whether grouped routing and condition-based maintenance are producing the expected cost savings relative to the reactive baseline.
Director action: MTBF trends validate programme effectiveness. Declining performance on specific asset class triggers targeted investigation.
Asset View 06
Capital Planning — Condition-Based Replacement Forecast
The capital planning view projects replacement needs for the next one, three, and five year periods based on the remaining useful life of every asset in the network. Unlike a calendar-based replacement forecast that assumes uniform degradation, the condition-based forecast accounts for the actual operating environment of each asset — a controller that has been operating at elevated cabinet temperature for three years will reach end-of-life before a controller operating within specification, and the forecast reflects this. The operations director can run what-if scenarios: what happens to asset health if replacement budget is reduced by 20 percent? Which geographic zone shows the highest concentration of assets approaching end-of-life? The forecast provides the data that supports capital budget requests with per-asset justification.
Director action: Capital requests backed by per-asset RUL data. Budget decisions informed by actual asset condition, not assumptions.
Before the predictive asset management platform, we managed 1,200 signalized intersections with a reactive system. Citizens reported most of our failures. Our preventive maintenance programme ran quarterly inspections on every cabinet regardless of condition, and our capital replacement budget was allocated based on asset age alone. The first six months of predictive diagnostics showed us something alarming: the controller at the highest-risk intersection in our network had a projected remaining useful life of less than four months — but it was not scheduled for replacement for another three years because it was only 14 years old and our replacement threshold was 20. That single finding changed our entire approach to capital planning. In the first year, emergency dispatches dropped 45%. Our average streetlight repair time went from 6.8 days to 3.2 hours. The maintenance programme cost reduction was 38% against the reactive baseline. The platform paid for itself in the first winter.
— Operations Director, Metropolitan Public Works Department — 1,200 Signalized Intersections, 48,000 Streetlights
Conclusion
Signal and streetlight maintenance improvement is not a staffing problem or a budget problem — it is an asset intelligence problem. When the only way to detect a failure is a citizen phone call, when preventive maintenance schedules treat every intersection identically regardless of operating environment, when replacement capital is allocated based on age rather than actual condition, and when the performance review happens only after a budget cycle closes, outages recur and costs accumulate because the maintenance programme is structurally unable to know what each asset needs. Predictive asset management and AI-powered diagnostics address all four dimensions simultaneously: per-asset condition models that flag degradation before failure, network-wide visibility that prioritises deployment by risk, condition-based maintenance that allocates inspection resources where they are needed, and capital planning that puts replacement budget where it delivers the highest safety and reliability return.
The evidence across state DOT and municipal programmes in 2025 and 2026 is clear: agencies deploying predictive asset diagnostics are achieving 40 to 60 percent reduction in emergency repair dispatches, reducing average streetlight outage time from seven days to under four hours, and extending the serviceable life of signal controller assets by identifying and addressing environmental stress factors before they cause failure. The operations directors achieving these results are the ones who deployed condition-based maintenance early, integrated telemetry data from both signal controllers and streetlight monitoring nodes into single-pane-of-glass visibility, and used the failure mode trend analysis to convert individual repair actions into systemic fleet improvements.
iFactory's AI asset management platform is designed for operations directors at state DOTs, county public works departments, and municipal transportation agencies who need to reduce outages, extend asset life, and control maintenance cost simultaneously. Book a Demo to see the predictive diagnostics and asset management system configured for your signal and lighting network, or talk to an expert about a free asset condition assessment and maintenance programme review for your jurisdiction.
Frequently Asked Questions
The platform is designed to work with the equipment the agency already has deployed. For traffic signals, the predictive diagnostics layer ingests data from NEMA TS2 and ATC controllers using existing communication backhauls — cellular, fiber, or wireless mesh. The primary data inputs include cabinet temperature and humidity, power supply voltage and current, conflict monitor status, communication uptime, and detector channel activity. For streetlights, the platform supports both retrofit monitoring nodes that attach to existing LED fixtures and native integration with NEMA/ANSI C136.41 smart lighting controllers. The minimum viable dataset for signal diagnostics is controller communication status and cabinet environmental readings. The minimum for streetlight diagnostics is fixture on-off status and current draw. Most agencies already have the foundational communications infrastructure in place; the iFactory deployment team configures the data ingestion layer during the standard four to eight week deployment timeline. Talk to an expert about a compatibility assessment for your existing signal and lighting equipment inventory.
The remaining useful life model initialises using manufacturer-rated design life as the baseline and then refines the forecast as real telemetry data accumulates. From day one, the platform provides useful life estimates based on asset class, manufacturer specification, and installation date. After 30 days of telemetry collection, the model begins adjusting individual forecasts based on actual operating conditions — a signal controller running at elevated cabinet temperature receives a shorter life forecast than one operating within specification. After 90 days, the model has sufficient data to produce per-asset forecasts with confidence intervals reflecting the operating environment observed. After one full year, the model incorporates seasonal stress patterns — summer thermal loading, winter humidity ingress, storm-related power events — and the forecast accuracy reaches its steady state. The operations director sees forecast confidence levels displayed with each estimate, so capital planning decisions can be weighted accordingly during the initial deployment phase. Book a Demo to see the RUL forecast accuracy progression from deployment through the first operating year.
Yes. The work order optimisation engine treats all assets in the maintenance programme as addressable points on the same network graph, regardless of asset type. When a diagnostic alert is generated for a signal controller at an intersection and a streetlight failure is detected on the same corridor, the engine groups both repairs into a single crew route if the geographic proximity and skill requirements align. The routing algorithm factors in crew capability (signal technician, lighting technician, or combined), estimated repair time per asset type, priority level of each alert, material requirements, and shift duration constraints. The operations director configures the grouping rules — for example, streetlight repairs more than two miles from the nearest pending signal repair are routed as a separate lighting crew, or high-priority signal knockdown alerts bypass grouping and trigger immediate dispatch. The engine continuously re-evaluates the route assignments as new alerts arrive, allowing the dispatcher to see the optimal route configuration at any point during the shift. Talk to an expert about configuring grouped routing rules for your crew structure and service area geography.
The iFactory platform is designed as an integration layer that connects to existing CMMS and asset management systems rather than requiring replacement. The predictive diagnostics engine generates work orders in the format your CMMS expects and pushes them through a standard API integration. When a diagnostic alert triggers a work order, the asset ID, location, diagnostic summary, and recommended action are populated automatically — the dispatcher reviews and assigns without manual data entry. Completed work order data flows back from the CMMS to the iFactory platform, closing the loop: the system records that the repair was completed and continues monitoring the asset to confirm that the diagnostic parameters have returned to normal range. For agencies using GIS-based asset inventories, the platform synchronises asset location and attribute data to maintain a consistent asset registry across both systems. The typical CMMS integration requires two to four weeks of configuration. Book a Demo to see the integration configured for your existing maintenance management system.
The Next Outage Is Already Forming in Your Asset Data. Predictive Diagnostics Find It Before the Citizen Call Comes In. Get a Free Asset Condition Assessment.
iFactory's AI asset management platform for signal and streetlight operations directors — predictive diagnostics that detect degradation before failure, condition-based maintenance that allocates resources to the highest-risk assets, and compliance-ready records generated automatically from the telemetry data your equipment already produces.