A single fiber optic cable carries the internet traffic of an entire neighborhood, hospital, or financial district. When that cable is cut — by a backhoe, a storm, a squirrel, or a neglected splice — the economic impact is measured in thousands of dollars per minute. Unlike copper networks where signal degradation is gradual and observable, fiber failures often arrive without warning: a splice that has been degrading for months finally crosses the loss threshold, or a bending radius violation that started during installation finally fractures the glass under thermal stress. The gap between fiber optic infrastructure and the intelligence applied to its maintenance is not a technology gap — it is a visibility gap. Reliability engineers who have deployed AI-powered fiber monitoring platforms report that the data alone changes nothing. What changes outcomes is the operational response built around the data: whether the system detects splice degradation before it becomes a hard failure, whether signal loss trends trigger proactive cable replacement rather than emergency repair, and whether the maintenance team works from a real-time cable integrity map rather than a reactive ticket queue. Building an AI-driven fiber optic maintenance programme is not a single platform deployment — it is a sustained reliability transformation with defined monitoring layers, threshold-based response protocols, and a KPI framework that connects cable-level signal metrics to network-wide service quality. This guide is written for reliability engineers and network maintenance leaders at the point of making that transition.
FIBER OPTIC MONITORING · SIGNAL LOSS · SPLICE DEGRADATION · CABLE INTEGRITY · AI PREDICTIVE MAINTENANCE
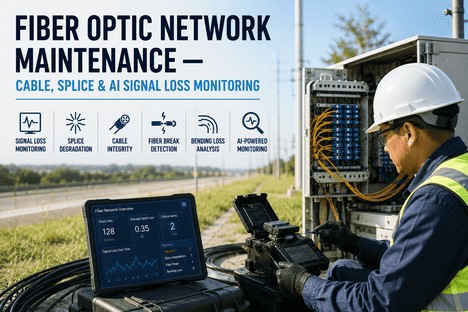
Fiber Is the Backbone. Signal Intelligence Is the Safeguard. iFactory Monitors Both.
iFactory's Fiber Optic Network Monitoring platform gives reliability engineers real-time visibility into cable integrity, splice health, signal loss trends, and bending anomalies — with AI-driven threshold alerts that detect degradation before service is affected.
$14K+
Average cost per minute of unplanned network downtime — a single hour of fiber outage can exceed $300K in lost revenue and SLA penalties
80
Outages per 1,000 miles of fiber plant per year — with splice points and accidental digs accounting for the majority of failure events
60-80%
Of fiber deployment cost is labor — making preventive cable protection and splice monitoring far more cost-effective than emergency repair dispatch
60Kx
Fiber's unutilized capacity headroom — current networks use less than 0.002% of optical fiber's known bandwidth potential
Why Fiber Optic Networks Fail — Five Damage Modes Every Reliability Engineer Must Monitor
1
Accidental Dig-Ins and Third-Party Damage
The leading cause of fiber outages. Construction, excavation, and utility work sever buried fiber with no warning. A single backhoe strike can cut hundreds of strands, affecting thousands of subscribers. Repair costs range from $600 for a residential drop to $20,000 for a trunk cable.
2
Splice Degradation Over Time
Every splice is a potential failure point. Contamination, mechanical stress, and thermal cycling cause splice loss to increase gradually over months or years. A splice that passed acceptance testing at 0.1dB can degrade to 0.5dB or more, triggering bit errors long before a hard failure occurs.
3
Macrobending and Microbending Loss
Tight cable bends, crushed conduits, or improper installation create signal leakage through the cladding. Macrobends are visible to the naked eye; microbends are not. Both cause attenuation that degrades signal-to-noise ratio and reduces reach, often misdiagnosed as transmitter or receiver issues.
4
Connector Contamination and Wear
Dust, oil, and repeated mating cycles degrade connector end faces. A contaminated connector can introduce 0.5dB to 1.0dB of loss per mating point. In a link with multiple patch panels, accumulated connector loss can push the link budget past its threshold without any cable fault.
5
Environmental and Rodent Damage
Water ingress in splice closures, freeze-thaw cycles shifting buried cable, and rodent chewing on aerial or duct fiber are chronic failure modes in outside plant networks. These failure types are notoriously difficult to predict without continuous distributed sensing across the cable path.
AI monitoring detects 4 of 5 failure modes before service impact
REAL-TIME FIBER HEALTH · OTDR TREND ANALYSIS · SPLICE DEGRADATION ALERTS · CABLE INTEGRITY MAP
A Broken Splice Costs Thousands. iFactory Detects It Before It Breaks.
iFactory aggregates OTDR trace data, connector loss metrics, and environmental sensor inputs into a single cable health dashboard — with AI-driven trend analysis that identifies degrading splices and bending anomalies before they trigger service outages.
The Fiber Monitoring Maturity Model — From Reactive Repair to Predictive Cable Intelligence
Understanding where your fiber network operation sits on the monitoring maturity curve is the starting point for any cable reliability programme. Most fiber operators are at Stage 1 or Stage 2. The organisations that consistently outperform on mean time to repair, service availability, and maintenance cost per strand-mile are operating at Stage 3 or Stage 4. The difference is not the test equipment they own — it is the continuous intelligence they have built around their cable plant.
Stage
Failure Response
Monitoring Approach
Key Metric
Reactive — repair only after customer outage report or network alarm. No cable health data exists before the failure.
No continuous monitoring. OTDR used only during fault localization after an outage has occurred.
Mean time to repair
Periodic — scheduled OTDR testing at monthly or quarterly intervals. Cable health snapshots taken between failures.
Manual OTDR trace collection and comparison. Splice loss recorded but reviewed after the fact.
Splice loss acceptance threshold
Condition-Based — continuous monitoring with threshold alerts. Splice degradation trends trigger inspection before failure.
Automated OTDR trace analysis with trend comparison. AI detects splice loss creep and bending anomalies in real time.
Splice loss trend slope
Predictive — ML models forecast cable degradation curves. Proactive replacement scheduled before loss threshold is breached.
AI models trained on historical splice, bend, and connector failure data. Predictive lead time alerts with work order generation.
Predicted days to failure
The Four-Layer Fiber Intelligence Stack — How AI Monitoring Works Across the Cable Plant
A comprehensive fiber optic monitoring programme operates across four distinct intelligence layers. Each layer serves a different purpose and targets a different failure mode. Together, they create a closed-loop cable health system that shifts the operation from reactive repair to predictive cable management. iFactory's platform integrates all four layers into a single pane of glass.
LAYER 1
Physical Layer Monitoring
Continuous OTDR trace acquisition at programmable intervals. iFactory compares each trace against the baseline reference and flags any deviation in splice loss, connector loss, reflectance, or attenuation slope. New event detection alerts the team to fiber breaks, new bends, or physical disturbances along the cable route within seconds of occurrence.
LAYER 2
Trend Analytics Layer
Rather than comparing each trace against a static threshold, iFactory's trend engine tracks the rate of change for every splice and connector in the network. A splice showing 0.01dB of additional loss per month is more concerning than a splice with 0.3dB of stable loss. The trend slope, not the absolute value, triggers early warnings — providing weeks or months of lead time before a hard failure.
LAYER 3
Correlation & Root Cause Layer
iFactory correlates fiber health data with external events: weather records (temperature swings, freeze-thaw cycles), construction permit activity near cable routes, and vibration data from distributed acoustic sensing. A splice loss increase that correlates with a nearby excavation permit is flagged differently than one correlating with a temperature swing — enabling the right preventative action.
LAYER 4
Predictive & Workflow Layer
Machine learning models trained on historical failure data predict when a given splice, connector, or cable section will reach its loss threshold. The platform generates work orders with predicted lead times, recommended actions, and the specific event location on the OTDR trace. This is the layer that turns monitoring data into maintenance action — closing the loop from detection to resolution.
The Reliability Engineer's Playbook — Six Actions to Deploy AI-Driven Fiber Monitoring
Reliability transformation does not happen through sensor deployment alone. It happens through deliberate process change, threshold configuration, and the gradual replacement of periodic testing with continuous intelligence. These six actions distinguish fiber operators that successfully deploy AI monitoring from those that install OTDRs and see no improvement in outage rates.
Baseline Every Fiber Link With a Reference OTDR Trace
Before configuring alerts, capture a clean reference OTDR trace for every fiber in your network under known-good conditions. The reference trace is the baseline against which all future comparisons are made. Mark every splice, connector, and event with its distance, loss, and reflectance. Without this baseline, trend analysis has no point of origin and every deviation is measured in isolation rather than against the cable's known healthy state.
2
Threshold Configuration
Define Three-Level Loss Thresholds per Splice and Connector
Configure per-event thresholds rather than cable-level averages. A warning threshold at 0.1dB above baseline flags early degradation. An alert threshold at 0.3dB above baseline triggers a notification to the reliability engineer. A critical threshold at 0.5dB above baseline generates a work order for immediate inspection. These thresholds should be configurable per link class — backbone, distribution, and drop — since each serves a different criticality level.
Connect Splice Alerts to Splicing Crew Dispatch
When a splice degradation alert triggers, the system should generate a work order with the exact fiber and splice location, the baseline vs. current loss values, the loss trend slope, and the recommended action. Assign the work order to the nearest certified fusion splicing crew with the correct tooling for that cable type and location. This closed-loop workflow — alert to work order to dispatch to resplice to re-test — is the mechanism that turns monitoring data into reliability improvement.
4
Cross-Layer Correlation
Correlate Fiber Health With Environmental and Construction Data
A splice loss increase during a freeze-thaw cycle is a different problem than the same increase during nearby excavation. Configure iFactory to ingest weather data, construction permit feeds, and distributed acoustic sensing data alongside OTDR traces. When the platform detects a pattern — splice degradation in a specific geographic area during specific weather conditions — it surfaces the correlation as a root cause insight rather than an isolated event.
Establish a Weekly Cable Health Review Using the Unified Dashboard
Open the iFactory fiber health dashboard at the start of the weekly reliability review. Review the list of splices in warning status, connectors approaching threshold, the trend slope comparison against the previous week, and the count of proactive interventions versus reactive repairs. When reliability engineers begin the meeting with data rather than anecdotes, the team arrives prepared with explanations for every trending event.
Review Alert Accuracy and Lead Time Quarterly
Every quarter, review the alerts that triggered versus the failures that actually occurred. Which thresholds generated false positives and need adjustment? Which failures occurred without an alert and need a new monitoring parameter? Is the average lead time between warning alert and hard failure increasing or decreasing? A monitoring programme that evolves its thresholds quarterly becomes more precise over time — reducing false positives while maintaining early warning sensitivity.
The Fiber Network KPI Framework — What to Measure at Every Level
The following KPI taxonomy follows the monitoring-to-decision principle: every metric connects to a specific operational decision, a named decision-maker, and a defined response trigger. iFactory's Fiber Network Dashboard surfaces all of these in real time, with role-based views, configurable threshold alerts, and trend analytics at every level of the operation.
Assigned closures with splice warnings — geographic dispatch list prioritized by loss trend slope
Resplice success rate — percentage of re-spliced events achieving loss below 0.1dB post-intervention
First-time fix rate — closures reopened within 30 days of intervention
Splice loss trend by route — percentage of splices showing increasing loss trend, stable, or improving
Alert-to-inspection lead time — average days between warning alert and scheduled splice inspection
False positive rate — percentage of alerts that did not result in a verifiable splice issue
Service availability per route — percentage of time each fiber route meets SLA uptime target
Maintenance cost per strand-mile — 12-month rolling average with trend comparison by region
Proactive-to-reactive ratio — percentage of total interventions that were predictive vs. emergency repair
Network-wide outage frequency trend — month-over-month comparison of fiber outage events per 1,000 strand-miles
Mean time between fiber failures — improving, flat, or deteriorating trend by cable type and installation vintage
Cable replacement ROI — cost of proactive replacement vs. emergency repair cost avoided
We deployed iFactory across a 4,000 strand-mile fiber network serving 80,000 residential and 3,000 enterprise subscribers. At deployment, we had no cable health baseline, no splice degradation trending, and no way to know which of our 12,000 splice points were degrading until a customer called to report an outage. The first month of continuous monitoring surfaced 47 splices with a progressive loss trend that we would never have caught on a quarterly OTDR schedule. Nine of those were within 0.2dB of causing hard failures within the next 60 days. Our team was able to resplice those closures during scheduled maintenance windows rather than dispatching emergency crews at 3am. Over the first year, we reduced fiber-related outages by 54%, cut emergency repair costs by 62%, and improved mean time to repair from 11 hours to under 3 hours for the few failures that still occurred. The monitoring platform did not reduce our outage rate by itself. What changed the outcome was that we configured thresholds, assigned accountability, and started weekly cable health reviews. The data made it visible. The process made it actionable.
-- Director of Network Reliability, Regional Fiber Operator -- 17 Years Optical Network Engineering
Conclusion
The AI-driven fiber optic monitoring that separates high-reliability network operators from the rest is not built by installing OTDRs and hoping for insights. It is built by reliability engineers who baseline every link, define per-event thresholds, connect alerts to crew dispatch, correlate fiber health with environmental data, and run weekly cable health reviews. With network downtime costing over $14,000 per minute and fiber outages affecting more subscribers per event than any other access medium, the operators who close the gap between cable health data and maintenance action will outperform on every reliability metric that matters: service availability, mean time to repair, maintenance cost per strand-mile, and subscriber retention. The platform makes it possible. The process makes it real.
iFactory's Fiber Optic Network Monitoring platform gives reliability engineers and network operators the unified cable intelligence to build a proactive maintenance programme — with four-layer monitoring, per-event threshold alerting, trend analytics, and automated work order generation that turns OTDR trace data into predictive maintenance outcomes. Book a Demo to see how the platform's fiber intelligence stack maps to your cable plant, or talk to an expert to begin building your AI-driven fiber monitoring programme with iFactory today.
Frequently Asked Questions
Fiber Outages Cost Over $14,000 Per Minute. The Operators Who Monitor Continuously Will Own the Network Reliability Advantage.
iFactory gives every level of your fiber operation real-time cable health intelligence — physical layer monitoring, splice trend analytics, cross-domain correlation, and predictive work flow generation — in a single pane of glass that turns OTDR traces into proactive maintenance decisions.