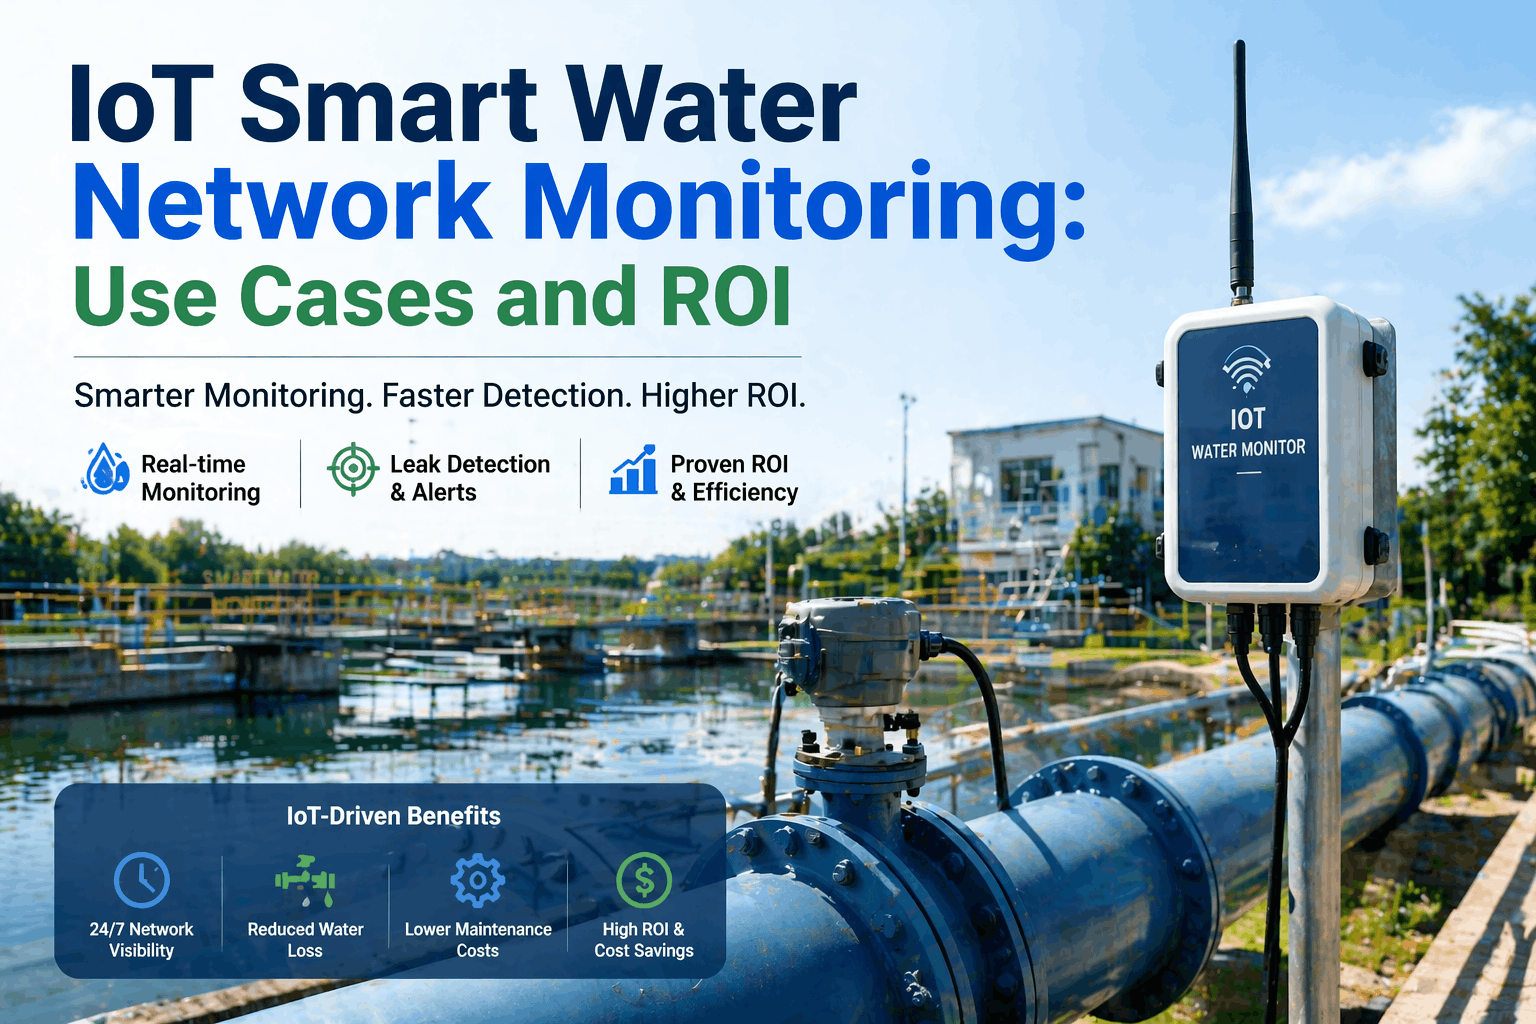
Water distribution networks lose between 20% and 40% of treated water to leaks, illegal connections, and metering inaccuracies before it ever reaches a customer — a crisis that costs utilities billions of dollars annually while straining aging infrastructure to its operational limits. IoT smart water network monitoring is the technology layer that transforms this invisible loss into measurable, manageable data. By deploying pressure sensors, acoustic correlators, flow meters, and water quality probes across the distribution network, utilities can detect micro-leaks within hours instead of months, predict pipe failures before they become main breaks, and deliver verifiable water quality compliance records without manual sampling delays. For water utilities, municipalities, and industrial water system operators evaluating how to reduce non-revenue water, extend asset lifespan, and satisfy increasingly demanding regulatory requirements, a well-designed IoT monitoring deployment delivers quantifiable ROI within 12–18 months of commissioning. This article covers the core use cases, sensor architectures, detection accuracy benchmarks, and real deployment ROI data. To map an IoT smart water monitoring strategy to your specific network, schedule a free network assessment with our infrastructure AI team.
Is Your Water Network Leaking Revenue You Cannot See?
iFactory's infrastructure AI platform deploys IoT sensor networks across water distribution systems to detect leaks in real time, predict pipe failures, and automate regulatory compliance — reducing non-revenue water and extending asset life.
6 High-Impact Use Cases for IoT Smart Water Network Monitoring
IoT water network monitoring is not a single technology — it is a layered ecosystem of sensors deployed at strategic network nodes to address fundamentally different operational problems. The six use cases below represent the highest-ROI applications of IoT sensor intelligence in water distribution systems, each addressing a specific failure mode, loss pathway, or regulatory obligation. For utilities evaluating a phased deployment strategy, understanding which use case delivers the fastest payback in their specific network context is the first essential step. iFactory's team helps utilities prioritise their deployment through a risk-based network assessment session.
Real-Time Leak Detection
Acoustic correlators and pressure transient sensors deployed at network nodes continuously monitor for the pressure signatures and acoustic noise patterns characteristic of active pipe leaks — detecting events hours after they begin rather than months after meter loss is noticed.
Pipe Burst Prediction
Machine learning models analyze pressure spike patterns, diurnal pressure cycles, and historical burst data to generate Remaining Useful Life estimates for high-risk main sections, enabling proactive relining or replacement rather than emergency excavation.
Water Quality Monitoring
In-line turbidity, chlorine residual, pH, and conductivity sensors monitor water quality continuously at distribution network nodes — detecting contamination events, treatment dosing failures, and cross-connection incidents within minutes instead of the hours required for physical sampling.
Pressure Zone Optimization
IoT pressure monitoring across district metered areas (DMAs) enables dynamic pressure management — maintaining optimal pressure to minimize new leak formation rates while ensuring adequate service pressure during peak demand periods.
Smart Meter Analytics
Advanced metering infrastructure (AMI) data analyzed by AI algorithms identifies meter anomalies, customer-side leaks, and unauthorized consumption patterns — improving revenue recovery and enabling proactive customer service before bills reflect problematic usage.
Pump Station Monitoring
Vibration, current draw, and flow-vs-head performance analytics on pumping station assets detect efficiency degradation, impeller wear, and bearing failures before they cause unplanned outages — one critically timed pump failure can affect thousands of customers and cost hundreds of thousands in emergency repair.
IoT Sensor Types for Water Network Monitoring: Accuracy Benchmarks
Selecting the correct sensor types for each network monitoring objective is the most critical hardware decision in any IoT smart water deployment. The accuracy, power consumption, and data transmission requirements vary dramatically between a chlorine probe at a reservoir outlet and an acoustic correlator on a cast iron main. Matching sensor capability to the specific network topology and primary NRW driver is essential before any commercial commitment. The table below provides 2025 benchmarks for each sensor category commonly deployed in smart water network programmes. To build a sensor specification for your specific network, request a technology selection session with our water engineering team.
| Sensor Type | Primary Application | Detection Accuracy | Battery Life | Network Priority |
|---|---|---|---|---|
| Acoustic Noise Logger | Leak detection at pipe fitting locations | Leaks from 0.1 L/min | 3–5 years | Critical |
| Pressure Transducer | DMA boundary monitoring, burst detection | ±0.1% FS accuracy | 5–10 years | Critical |
| Electromagnetic Flow Meter | DMA inflow/outflow measurement | ±0.5% of reading | Hardwired / Solar | Critical |
| Chlorine Residual Probe | Distribution water quality compliance | ±0.05 mg/L | Hardwired / Periodic | High |
| Turbidity / pH Sensor | Contamination event detection | ±2% NTU / ±0.1 pH | Hardwired | High |
| Smart Water Meter (AMI) | Consumption analytics, micro-leak detection | R400 class (0.25 L/h) | 10–15 years | Medium |
| Vibration (Pump Station) | Predictive pump maintenance | ±0.5 μg MEMS | 6–18 months | Medium |
ROI of IoT Smart Water Monitoring: What the Deployment Data Shows
The financial case for IoT smart water network monitoring is built on four measurable value streams: non-revenue water reduction, emergency repair cost avoidance, regulatory compliance savings, and energy efficiency improvements at pumping stations. Together, these value streams create a return profile that typically delivers full investment payback within 18–24 months for medium-to-large distribution networks. The benchmarks below are drawn from documented utility deployments and iFactory's infrastructure analytics data across active water monitoring programmes. For a network-specific ROI projection based on your current NRW figures and asset age profile, book a ROI calculation session.
The primary ROI driver. IoT leak detection identifies active losses that SCADA and bulk meter comparisons miss entirely. Utilities routinely achieve 15–35% NRW reduction within 12 months of acoustic logger and pressure monitoring deployment — with each percentage point recovered representing significant annual revenue at volumetric tariff rates.
A single major main burst in an urban distribution area — involving emergency excavation, traffic management, customer compensation, and service restoration — costs utilities $200K–$2M per event. ML-driven burst prediction identifies high-stress main sections 30–90 days before failure, enabling planned repair at a fraction of the emergency cost.
Water quality non-compliance events — particularly chlorine residual exceedances or turbidity spikes at distribution network nodes — carry significant regulatory fine exposure and public confidence costs. Real-time quality monitoring with automated alerting enables utilities to respond within minutes rather than hours, preventing compliance breaches before they trigger regulatory enforcement.
Pump station energy optimization through IoT-driven performance monitoring and AI scheduling algorithms routinely achieves 8–15% energy reduction per station. For large utilities operating multiple high-head pumping stations, this compounds into substantial annual energy cost savings — often independently justifying the IoT platform investment.
How Smart Water Network Monitoring Deployments Are Structured
A successful smart infrastructure management deployment for water networks follows a structured five-phase approach that moves from foundational sensor coverage through progressively sophisticated AI analytics. Attempting to deploy advanced machine learning models without first establishing reliable, high-quality sensor data at critical network nodes is the most common cause of smart water project underperformance. iFactory's deployment methodology ensures each phase validates its data foundation before the next analytical layer is activated.
DMA Boundary Definition and Flow Baselining
District Metered Areas (DMAs) are defined or validated as the primary unit of network monitoring. Flow meters at DMA inlets and outlets establish the baseline minimum night flow (MNF) that exposes the background leakage level — the benchmark against which all subsequent leak detection gains are measured.
Pressure Monitoring Network Activation
Pressure transducers deployed at DMA boundaries and critical network nodes provide real-time hydraulic visibility across the distribution system. Pressure transient analysis identifies burst events within seconds of occurrence and supports pressure management strategies that reduce the rate of new leak formation by 20–30%.
Acoustic Logger Deployment for Active Leak Pinpointing
Acoustic noise loggers deployed on fire hydrants, valve chambers, and meter boxes listen for the characteristic low-frequency noise signatures of active pipe leaks during network quiet periods (2–4 AM). Cross-correlation algorithms between neighbouring loggers pinpoint leak locations to within 1–3 metres on metallic mains, enabling excavation-efficient repair targeting.
AI Predictive Analytics and Digital Twin Activation
With 90+ days of baseline sensor data established, iFactory's machine learning models activate burst prediction, NRW trend forecasting, and pump performance degradation tracking. A network digital twin enables demand simulation, pressure zone optimization modeling, and capital investment planning — prioritising main renewal budgets by failure probability rather than asset age alone.
Water Quality Integration and Regulatory Reporting
In-line water quality sensors at reservoir outlets, booster stations, and network extremities complete the monitoring ecosystem. Quality data feeds automated regulatory compliance reports — replacing manual log compilation with a searchable, timestamped digital record that satisfies drinking water inspection requirements across all major regulatory frameworks.
Traditional vs. IoT Smart Water Monitoring: Performance Gap
The operational performance difference between conventional water network management and a fully deployed iot predictive maintenance smart water platform is not incremental — it is structural. The comparison below helps water utility leadership teams articulate the business case for IoT monitoring investment to asset management boards and regulatory bodies. When expressed in terms of NRW percentage, average leak detection time, and compliance posture, the financial justification is typically clear. To quantify this gap for your specific network, book a network benchmarking session.
| Operational Dimension | Traditional Management | IoT Smart Monitoring | Performance Gain |
|---|---|---|---|
| Average Leak Detection Time | 3–18 months (survey-driven) | Hours to days (acoustic + pressure) | Critical |
| Non-Revenue Water Rate | 20–40% typical without monitoring | 8–18% achievable with IoT | High |
| Burst Prediction Capability | None — reactive only | 30–90 days advance warning | High |
| Water Quality Event Response | Hours (manual sample → lab) | Minutes (automated sensor alert) | Critical |
| Pumping Energy Efficiency | Fixed schedules, inefficient staging | AI-optimized scheduling, 8–15% savings | Medium |
| Regulatory Compliance Records | Manual log books, incomplete trails | Automated digital records, audit-ready | High |
| Capital Investment Planning | Age-based, uniform renewal cycles | Risk-based, data-driven prioritization | Medium |
"Deploying acoustic loggers and pressure transducers across our highest-loss DMAs with iFactory's analytics platform recovered 22% of our non-revenue water within 14 months. What surprised us most was not just the leak detection speed — it was the AI's ability to flag three high-risk main sections for proactive relining that we would have discovered as emergency bursts within 18 months. The avoided repair costs alone covered the platform investment."
— Head of Network Operations, Regional Water Authority
IoT Smart Water Network Monitoring: Verified Performance Benchmarks
The following benchmarks are drawn from documented IoT water monitoring deployments and iFactory infrastructure analytics data. They represent achievable outcomes for medium-to-large water distribution networks deploying a phased acoustic, pressure, and quality monitoring architecture.
| KPI Metric | Typical Baseline | IoT Monitoring Result | Key Driver |
|---|---|---|---|
| Non-Revenue Water Rate | 25–40% | 10–18% (15–35% reduction) | Acoustic leak detection + pressure management |
| Mean Leak Detection Time | 6–18 months | Hours to 3 days | Continuous acoustic + pressure transient analysis |
| Burst Prediction Window | None | 30–90 days advance | ML pressure signature pattern analysis |
| Pump Station Energy | Baseline consumption | 8–15% reduction | AI scheduling + performance degradation monitoring |
| Water Quality Alert Speed | 2–8 hours (manual sampling) | Under 5 minutes | In-line chlorine + turbidity continuous monitoring |
| Emergency Repair Events | Baseline frequency | 40–60% reduction | Predictive main renewal prioritization |
Stop Losing Revenue to Leaks You Cannot See. Deploy Smart Water Intelligence.
iFactory's smart water monitoring platform connects IoT sensors, acoustic correlators, and AI analytics into a single network intelligence layer — reducing non-revenue water, preventing emergency bursts, and automating regulatory compliance.
IoT Smart Water Network Monitoring — Frequently Asked Questions
What is the most effective IoT sensor for detecting leaks in water distribution pipes?
Acoustic noise loggers are the most effective sensor for active leak detection in pipe networks. Deployed on hydrants, valve boxes, and meter chambers, they listen during minimum night flow periods for the low-frequency noise signatures of active leaks. Cross-correlation algorithms between adjacent loggers can pinpoint leak locations to within 1–3 metres on metallic mains, dramatically reducing the excavation footprint required for repair crews.
How does IoT monitoring reduce non-revenue water (NRW)?
IoT monitoring reduces NRW through three mechanisms: first, acoustic leak detection identifies active real losses significantly faster than survey-based leak detection, reducing the time losses run undetected from months to hours; second, pressure management based on real-time IoT data reduces the rate of new leak formation by 20–30%; third, smart meter analytics identifies apparent losses from meter inaccuracies and unauthorized connections that traditional bulk metering misses entirely.
What data transmission protocols are used to connect water network IoT sensors?
Battery-powered acoustic loggers and pressure sensors typically use LoRaWAN or NB-IoT for low-power, long-range data transmission — enabling 3–10 year battery lifespans from underground chamber locations. Flow meters and water quality sensors at permanent installations often use cellular (4G/5G) or hardwired Ethernet connections where AC power is available. iFactory's platform natively ingests all major LPWAN and cellular data protocols without requiring specialized network hardware.
Can IoT water monitoring detect bursts on plastic (PE/PVC) mains as effectively as metallic pipes?
Acoustic leak detection is most effective on metallic mains (cast iron, ductile iron, steel) because noise propagates further and attenuates less. On plastic mains, correlation distances are shorter — requiring closer logger spacing — but modern broadband correlators have extended plastic pipe leak detection capability significantly. Pressure transient analysis is often more effective than acoustic methods on long plastic main sections, making a hybrid sensor strategy the recommended approach for mixed-material networks.
How does the machine learning burst prediction model work?
iFactory's burst prediction model analyzes pressure transient patterns — micro-pressure spikes that occur when a pipe section undergoes stress — alongside historical burst location data, pipe age, material type, and soil condition metadata. The model learns to distinguish the pressure signature of a pipe under increasing stress from normal operational pressure fluctuations. When a monitored main section exhibits pressure patterns consistent with pre-failure stress, the AI generates a risk-ranked alert for the asset management team, enabling planned intervention before the failure occurs.
What is a typical IoT smart water monitoring project payback period?
Payback periods typically range from 12–24 months for medium-to-large water distribution networks, driven primarily by NRW reduction value. For a utility losing 30% NRW on a 10 million litre per day network at $0.50/m³, recovering 20 percentage points of NRW represents approximately $365,000 in annual revenue recovery — typically sufficient to justify the capital and operational costs of the IoT monitoring platform within 12–18 months. Emergency burst avoidance events accelerate payback further, as a single avoided urban main burst can save $500K–$2M.
Does the platform integrate with existing GIS, SCADA, and CMMS systems?
Yes. iFactory's smart water platform integrates with leading GIS platforms (Esri ArcGIS, QGIS) to spatially map sensor data overlaid on pipe network assets. SCADA integration via OPC-UA or Modbus ensures existing operational systems continue to function without modification. CMMS/EAM integration means that AI-generated leak alerts and predictive maintenance work items automatically create structured work orders in Maximo, SAP, or the utility's existing maintenance management system.
How are water quality compliance records generated automatically?
In-line sensors at reservoir outlets, pump stations, and distribution network extremities continuously log chlorine residual, pH, turbidity, and conductivity against regulatory compliance thresholds. iFactory's platform timestamps every reading, flags exceedances with automated alerts to the operations team, and compiles all monitoring data into structured compliance reports formatted for submission to the applicable drinking water regulatory authority — eliminating the manual data aggregation that typically precedes regulatory reporting cycles.