The global power grid is undergoing its most significant structural transformation since electrification — and the pace of that transformation is exposing infrastructure vulnerabilities that legacy monitoring systems were never designed to manage. Renewable energy integration, distributed generation assets, and rapidly increasing peak demand loads are combining to create grid stability challenges that cannot be addressed through conventional SCADA architectures alone. IoT smart grid monitoring provides the distributed sensor intelligence layer that utilities and grid operators need to maintain power quality, prevent outages, detect equipment failures before they cascade, and optimize energy flow across complex transmission and distribution networks in real time. This article examines the use cases, sensor architectures, performance benchmarks, and AI analytics applications driving measurable operational outcomes in power infrastructure optimization programmes globally. If you want to understand how iFactory's infrastructure AI platform applies to your specific grid monitoring challenge — whether transmission asset health, substation monitoring, or distribution fault detection — schedule a grid monitoring consultation with our power infrastructure team.
Is Your Grid Ready for the Monitoring Demands of Modern Power Infrastructure?
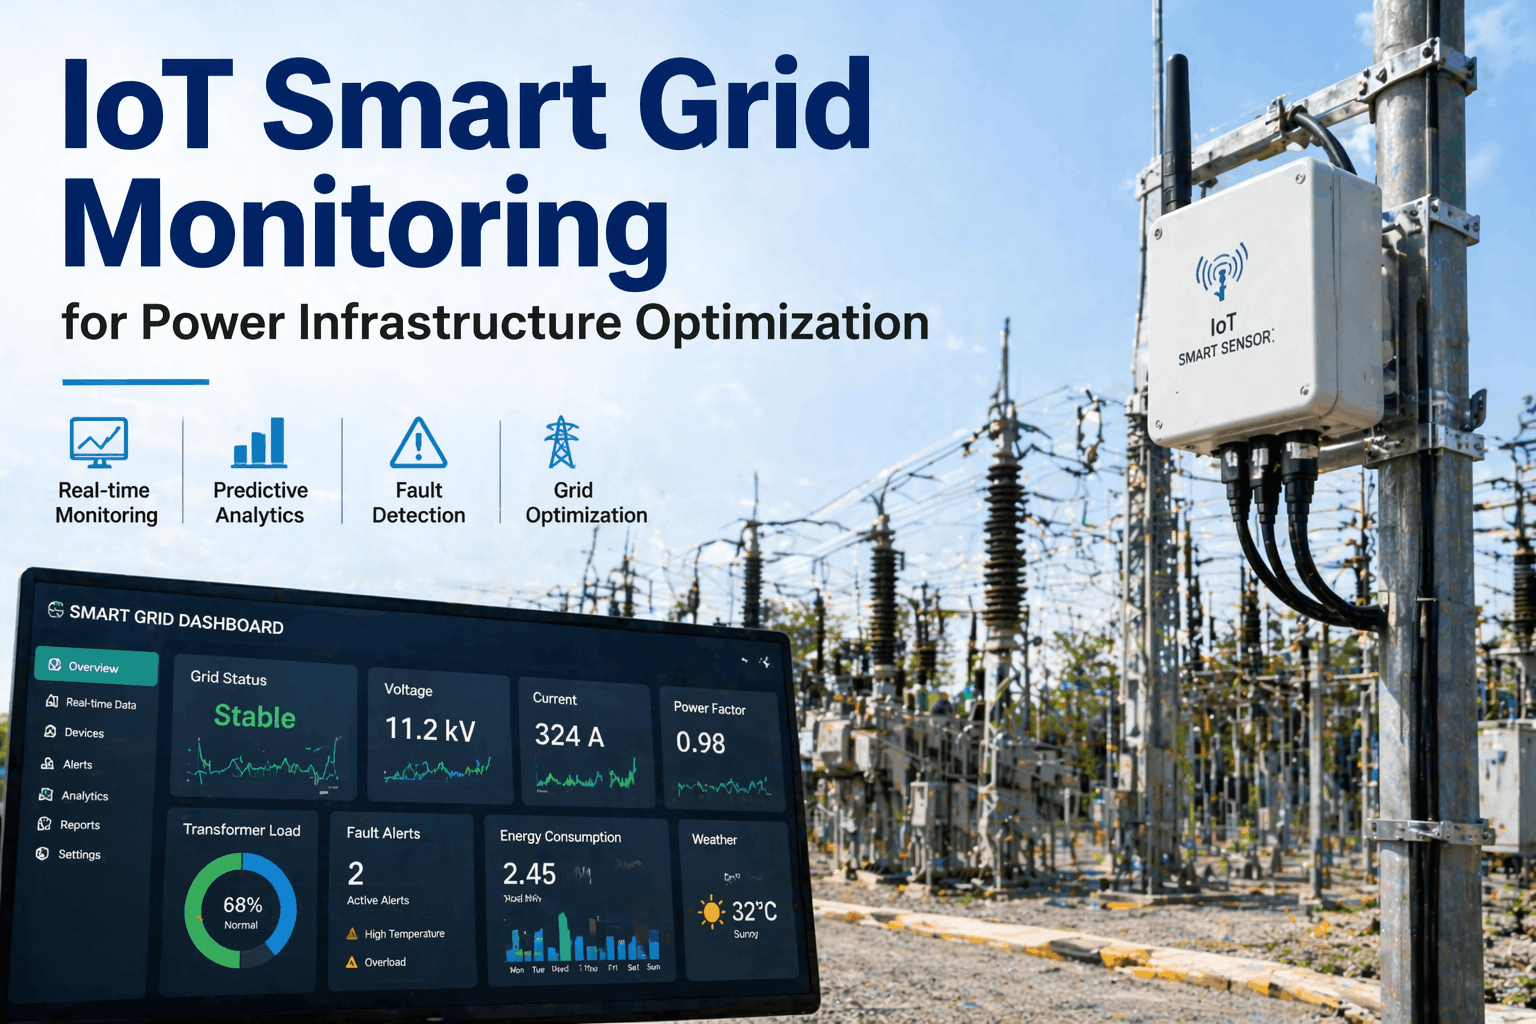
iFactory's infrastructure AI platform connects distributed IoT sensors across transmission lines, substations, and distribution networks — delivering real-time power quality analytics, predictive fault detection, and AI-driven load optimization for grid operators and utilities.
Why Traditional Grid Monitoring Is Failing Modern Power Infrastructure
Traditional grid monitoring relies on SCADA systems collecting data from RTUs and IEDs at substations — a model designed for centralized generation and one-directional power flow. The modern grid is fundamentally different: distributed solar and wind generation feed power in multiple directions, EV charging creates unpredictable demand spikes, and aging transmission assets operate well beyond their original design lives. The SCADA-only monitoring model, with its substation-centric sensor density and 30-second to 2-minute data polling cycles, cannot provide the spatial resolution, temporal resolution, or predictive analytical capability that modern grid operations require.
IoT smart grid monitoring fills this gap by deploying thousands of lower-cost, high-frequency sensors throughout the transmission and distribution network — on transformers, overhead line corridors, cable joints, switchgear, and at the grid edge — feeding continuous data into AI analytical platforms that detect anomalies, predict failures, and optimize power flow in ways that the SCADA architecture was structurally incapable of delivering. For grid operators evaluating how to bridge this monitoring gap, book a grid infrastructure assessment to understand where IoT investment delivers the highest operational ROI.
Real-Time Equipment Health Visibility
IoT sensors on transformers, switchgear, and cable infrastructure monitor thermal performance, partial discharge activity, oil condition, and vibration — providing continuous equipment health data that SCADA polling intervals entirely miss. Deterioration is detected and addressed before failure, not after the outage.
Distributed Renewable Integration Monitoring
Solar and wind generation introduces frequency and voltage variability at grid connection points that require high-frequency monitoring to manage safely. IoT power quality sensors at distributed generation interconnection points provide the millisecond-resolution data needed for stability management at the distribution network level.
Fault Location and Isolation Speed
Traditional fault location in overhead networks relies on relay protection data at substation level — providing fault direction but not precise location. IoT fault passage indicators deployed along feeder routes pinpoint fault locations to a specific line section within seconds, reducing field crew dispatch time and outage duration by 40–60%.
Dynamic Line Rating
Static thermal ratings limit transmission line capacity conservatively to account for worst-case ambient conditions. IoT weather stations and line temperature sensors enable Dynamic Line Rating (DLR) — real-time calculation of actual thermal capacity based on wind speed, ambient temperature, and solar radiation — typically increasing usable transmission capacity by 10–30% without new infrastructure investment.
Wildfire and Environmental Risk Monitoring
Transmission line corridors in high fire-risk regions require continuous environmental monitoring — temperature, humidity, wind speed, conductor sag, and vegetation clearance — to manage ignition risk from conductor-to-vegetation contact. IoT sensors along high-risk line corridors integrate with fire weather data to trigger automatic load reduction or circuit de-energization before ignition conditions are reached.
Substation Cybersecurity and Physical Monitoring
Modern substations integrate IT and OT systems in ways that expand the cybersecurity attack surface dramatically. IoT environmental monitoring (temperature, humidity, access events) combined with OT network traffic anomaly detection provides a multi-layer security posture for unmanned substation assets across the transmission network.
IoT Sensor Types for Smart Grid Monitoring: Specifications and Grid Applications
Effective IoT smart grid monitoring requires a layered sensor architecture — different sensor types addressing different failure modes and operational objectives at different points in the power system. The table below covers the primary sensor categories deployed in transmission and distribution grid monitoring programmes, with specifications relevant to procurement and deployment planning. For a sensor architecture scoped to your specific grid topology and monitoring priorities, request a grid sensor design session.
| Sensor Type | Measurement Parameter | Sampling Rate | Grid Application | Priority |
|---|---|---|---|---|
| Partial Discharge (PD) Sensor | PD pulse amplitude, phase, count | Continuous | HV cable, transformer insulation health | Critical |
| Transformer Oil/DGA Monitor | Gas-in-oil (H₂, C₂H₂, CO), moisture, temperature | Hourly to continuous | Power transformer condition monitoring | Critical |
| Power Quality Analyser (IoT) | V, I, THD, frequency, power factor | 1–10 ms cycles | Renewable interconnection, PQ disturbance detection | High |
| Fault Passage Indicator (FPI) | Fault current direction, magnitude | Event-triggered | Distribution feeder fault location | High |
| Line Temperature/DLR Sensor | Conductor temperature, sag, weather | 1–5 min | Dynamic line rating, ampacity optimisation | Medium |
| Switchgear Vibration/Thermal | Vibration, contact resistance, IR temperature | Continuous | CB and disconnector mechanical health | High |
| Smart Meter / AMI Endpoint | kWh, kVAr, voltage, interval data | 15–30 min intervals | Distribution load monitoring, voltage profiling | Medium |
5 High-Impact IoT Smart Grid Use Cases With Verified Operational Outcomes
Successful IoT smart grid deployments focus investment on the use cases that address the highest-cost failure modes in the specific grid topology — not generic "smart grid" technology adoption. The five use cases below represent the highest-ROI applications of IoT sensor intelligence in power infrastructure, each with documented operational outcomes from active utility deployments. To identify which use case combination applies to your grid's specific reliability and efficiency challenges, schedule a grid reliability review with iFactory's power infrastructure team.
Transformer Asset Management: From Reactive to Condition-Based
Power transformers are the highest-value, longest-lead-time assets in the transmission network — and traditional monitoring (oil sampling on annual cycles, thermovision surveys on 2–5 year cycles) is structurally inadequate for the operating stresses of modern grid conditions. IoT dissolved gas analysis (DGA) monitors on HV transformers provide continuous dissolved gas trending that detects developing insulation faults 6–18 months before failure — giving asset managers the lead time to plan replacement or refurbishment without the emergency cost and customer disruption of an unplanned outage. Utilities deploying continuous DGA monitoring consistently report 60–70% reduction in transformer-related unplanned outages within 24 months of deployment.
HV Cable Partial Discharge Monitoring: Preventing Underground Cable Failures
Underground HV cable failures in urban distribution networks are among the most expensive and operationally disruptive events in power infrastructure — requiring excavation in trafficked areas, extended restoration times, and significant third-party liability exposure. Partial discharge (PD) monitoring sensors installed at cable joints and terminations detect insulation degradation patterns months before complete dielectric breakdown. Machine learning models trained on PD data classify fault type (voids, treeing, contamination) and severity, allowing network planners to prioritize joint replacement in annual maintenance programmes rather than responding to emergency failures. Average surveyed utilities achieve 3–5× return on PD monitoring investment within 36 months through avoided cable failure events.
Distribution Automation: IoT-Enabled Fault Location and Service Restoration
Distribution feeder faults affect more customers per event than transmission faults, and the speed of service restoration directly determines customer minutes lost — the primary reliability KPI for regulated distribution utilities. IoT fault passage indicators deployed along feeder routes communicate fault passage events to the distribution management system within seconds of a fault occurrence, enabling automatic switching algorithms to isolate the faulted section and restore supply to unaffected customers within 60–90 seconds — compared to 30–90 minutes for conventional field-crew-dependent restoration. Utilities with IoT-enabled distribution automation consistently achieve 40–60% reduction in SAIDI (System Average Interruption Duration Index) and equivalent reductions in regulatory penalty exposure.
Dynamic Line Rating: Unlocking Hidden Transmission Capacity
Transmission congestion is a primary driver of renewable energy curtailment — and building new transmission infrastructure carries decade-long lead times and billion-dollar capital costs. Dynamic Line Rating unlocks additional transmission capacity from existing infrastructure by replacing conservative static thermal ratings with real-time capacity calculations based on actual conductor temperature and ambient weather conditions. IoT line monitoring sensors reporting every 2–5 minutes enable DLR systems that typically deliver 10–30% additional usable capacity during favourable weather conditions — reducing congestion costs and enabling greater renewable penetration without new wire capital expenditure. For grid operators under 2030 renewable integration targets, DLR is often the highest-ROI transmission investment available in the near term.
Power Quality Monitoring at Grid Edge: Managing Renewable Interconnection
The proliferation of distributed solar generation, battery energy storage, and EV charging creates power quality disturbances — voltage fluctuations, harmonic distortion, rapid voltage changes — that conventional SCADA architectures cannot detect at the distribution level. IoT power quality analysers deployed at LV/MV interconnection points provide millisecond-resolution disturbance data that enables network operators to identify the source of PQ events, assess compliance with grid code interconnection requirements, and prioritise network reinforcement in areas where PQ degradation is most severe. This data is increasingly required by regulators as evidence of distribution network performance under high renewable penetration scenarios.
"We deployed IoT DGA monitors across 47 transmission transformers in our highest-criticality corridors as part of a condition-based asset management programme. Within 18 months, the system had flagged three transformers with accelerating acetylene trends that our annual oil sampling cycles would not have detected for another 9–15 months. We replaced all three transformers in planned outages at a total cost of approximately $1.4M. The replacement of any one of those transformers as an emergency following a catastrophic failure would have cost between $4M and $7M in direct repair costs alone, before customer compensation and regulatory penalties. The business case is hard to argue with."
IoT Smart Grid Monitoring: Verified Performance Benchmarks Across Use Cases
The table below consolidates verified performance benchmarks from IoT smart grid monitoring deployments across transmission and distribution utilities. These outcomes are drawn from documented deployment reports, regulatory filings, and iFactory's infrastructure analytics data from active grid monitoring programmes. They represent achievable outcomes from well-designed IoT deployments — not theoretical projections. To build a performance target framework for your specific grid investment proposal, request a grid benchmarking session.
| Use Case | Baseline Performance | IoT-Enabled Outcome | Impact Category |
|---|---|---|---|
| Transformer Fault Detection (DGA) | Annual oil sampling, 6–18 month detection gap | 60–70% reduction in unplanned transformer outages | Critical |
| HV Cable PD Monitoring | Reactive failure — excavation emergency repair | 3–5× ROI; cable joints replaced in planned maintenance | High |
| Distribution Fault Location (FPI) | 30–90 min field crew dispatch | Section isolation in 60–90 seconds, 40–60% SAIDI reduction | Critical |
| Dynamic Line Rating | Static rating, conservatively constrained | 10–30% additional usable capacity unlocked | High |
| Switchgear Condition Monitoring | Time-based maintenance, high false-maintenance rate | 30–40% maintenance cost reduction | Medium |
| Power Quality (Renewable Grid Edge) | No visibility below substation level | PQ disturbance location and source identification | High |
| Wildfire Risk Line Monitoring | Static weather data, manual clearance surveys | Real-time ignition risk index per line section | Critical |
IoT Smart Grid Platform Architecture: From Edge Sensor to AI Analytics
A production-grade IoT smart grid monitoring platform integrates four distinct technology layers — the physical sensor network, the communications infrastructure, the data platform, and the AI analytical engine — each of which must be designed for the specific security, latency, and data volume characteristics of power infrastructure environments. The architecture must also comply with the cybersecurity requirements of the applicable energy sector regulatory framework (NERC CIP in North America, NIS2 in Europe, and national equivalents).
Distributed IoT Sensor Network with OT-Grade Edge Processing
Grid sensors operate in harsh electrical environments — high electromagnetic interference, extreme temperature ranges, and remote locations without reliable network connectivity. OT-grade IoT sensors with IEC 61850 compatibility, built-in local data buffering, and EMI-hardened designs are prerequisite for transmission and substation environments. Edge gateways aggregate data from clusters of sensors and apply local filtering and anomaly detection — reducing data volume for transmission while preserving high-resolution data for detected events.
Secure OT Communications Infrastructure
Grid IoT communications must operate over a dedicated OT network separated from corporate IT networks by security zone architecture compliant with NERC CIP or IEC 62443. Communication options range from private 4G/5G LTE networks for distribution assets to MPLS or fibre-connected SCADA backhaul for substations. All data is encrypted end-to-end with OT-appropriate protocols, and all sensor access events are logged for security audit compliance. iFactory's platform supports OT network integration without requiring sensor data to traverse the public internet.
iFactory Grid Intelligence Platform: Real-Time Monitoring and Historian
Sensor data integrates into the iFactory infrastructure AI platform alongside existing SCADA/EMS/DMS data — creating a unified operational data lake that adds IoT sensor granularity to the existing SCADA operational picture. The platform provides real-time equipment health dashboards, geographic asset mapping, alarm management, and a time-series historian with configurable data retention policies for regulatory compliance. Integration with existing OSIsoft PI historians, GE Grid Solutions, Siemens SICAM, and Schneider Electric ADMS environments is supported through standard IEC 61968/61970 CIM APIs.
AI Predictive Analytics and Asset Risk Scoring
iFactory's ML models process continuous sensor data to generate asset risk scores, remaining useful life estimates, and maintenance priority rankings for every monitored asset in the grid portfolio. Models are trained on the specific asset's operational history — not generic equipment benchmarks — and provide explainable output that specifies which sensor parameters contributed to an elevated risk score. Asset risk rankings integrate directly into the utility's work management system, automatically generating condition-based maintenance work orders when risk thresholds are breached. Discuss AI model configuration for your transformer fleet with our power analytics team.
Traditional Grid Monitoring vs. IoT Smart Grid Platform: Operational Gap Analysis
The operational gap between conventional SCADA-based grid monitoring and a deployed IoT smart grid analytics platform is quantifiable across multiple operational dimensions. The comparison below is structured to support investment business case development for utilities and transmission operators presenting IoT smart grid investment proposals to regulatory authorities and boards. To adapt this comparison to your utility's specific operational metrics, book a business case development session.
| Operational Dimension | Traditional SCADA Monitoring | IoT Smart Grid Platform | Gain Level |
|---|---|---|---|
| Equipment Failure Detection | Post-failure (reactive) | 6–18 months pre-failure (predictive) | Critical |
| Fault Location Speed | 30–90 min field crew | Automated in <2 minutes | Critical |
| Transmission Capacity Utilisation | Static rating — conservatively capped | Dynamic — 10–30% additional capacity | High |
| PQ Disturbance Visibility | Substation-level only | Feeder and LV grid edge | High |
| Maintenance Strategy | Time-based (calendar) | Condition-based (sensor-driven) | Medium |
| Renewable Curtailment Management | Static congestion limits | Real-time DLR-enabled capacity optimisation | High |
| Regulatory Compliance Evidence | Manual report compilation | Automated, timestamped digital records | Medium |
Upgrade Your Grid Monitoring to the Intelligence Level That Modern Power Infrastructure Demands.
iFactory's infrastructure AI platform connects IoT sensors across your transformer fleet, cable network, and distribution feeders — delivering predictive fault detection, dynamic capacity optimisation, and regulatory compliance evidence on a single grid intelligence platform.
Frequently Asked Questions: IoT Smart Grid Monitoring for Power Infrastructure
How does IoT smart grid monitoring differ from traditional SCADA-based grid monitoring?
Traditional SCADA grid monitoring collects data from RTUs and IEDs at substation level with polling cycles of 30 seconds to 2 minutes — providing aggregate network status but limited visibility into individual equipment condition and no capability for early-stage fault detection. IoT smart grid monitoring adds continuous, high-frequency sensors directly on equipment (transformers, cables, switchgear) and throughout the distribution network (on feeders, at renewable interconnection points, along line corridors) — providing the spatial resolution and temporal granularity needed for condition-based asset management and millisecond-resolution power quality monitoring. The two systems are complementary: IoT augments rather than replaces SCADA, adding the granular data layer that enables AI-driven predictive analytics.
What is dissolved gas analysis (DGA) monitoring and why is it critical for transformer management?
Dissolved gas analysis monitors the gases dissolved in power transformer insulating oil — hydrogen (H₂), methane (CH₄), ethylene (C₂H₄), acetylene (C₂H₂), and carbon monoxide (CO) — whose concentrations and ratios provide diagnostic evidence of specific internal fault conditions developing within the transformer. Acetylene generation, for example, indicates high-energy arc discharge. Ethylene trends indicate thermal faults at moderate temperatures. Traditional DGA involves annual manual oil sampling sent to a laboratory — missing the rapid gas evolution patterns that indicate accelerating fault development. Continuous online IoT DGA monitors provide daily or hourly gas trend data that enables fault diagnosis, severity trending, and proactive intervention before catastrophic failure. For HV power transformers worth $2M–$15M each with 12–36 month replacement lead times, continuous DGA monitoring represents one of the highest-ROI condition monitoring investments available.
How does Dynamic Line Rating (DLR) work and what grid operational benefits does it deliver?
Dynamic Line Rating calculates the real-time thermal capacity of transmission lines based on actual ambient conditions — air temperature, wind speed, solar radiation, and measured conductor temperature — rather than the conservative static ratings that assume worst-case conditions. IoT sensors on the line (weather stations, conductor temperature sensors, or tension monitors that derive sag from conductor tension) report data every 2–5 minutes. A DLR algorithm processes this data to generate a real-time ampacity capacity figure. When ambient conditions are favourable — cool temperatures, moderate wind, night — the line can safely carry 10–40% more current than its static rating permits. This unlocks additional renewable export capacity during high-generation periods and reduces transmission congestion without new capital expenditure on wire.
How do IoT fault passage indicators (FPIs) reduce distribution network SAIDI?
Fault passage indicators are devices installed on distribution feeder poles or in ring main units that detect and communicate the passage of fault current — indicating which sections of a feeder have experienced the fault current and thereby pinpointing which line section is faulted. When FPIs communicate fault passage events to the distribution management system within seconds of a fault occurrence, the DMS can automatically command switching operations that isolate the faulted section and restore supply to healthy sections through alternative network paths — typically within 60–90 seconds. Without FPIs, identifying a faulted section requires field crew patrol — typically taking 30–90 minutes. This patrol time directly translates into customer interruption minutes, so FPI deployment directly and measurably reduces the SAIDI metric that determines regulatory incentive payments and penalties in most regulated distribution frameworks.
What cybersecurity standards apply to IoT devices deployed in grid infrastructure?
In North America, transmission and substation IoT deployments within defined Electronic Security Perimeters (ESPs) must comply with NERC CIP-005 (electronic security perimeters), CIP-007 (systems security management), and CIP-010 (configuration change management) requirements. In Europe, NIS2 Directive requirements apply to operators of essential services in the electricity sector, requiring appropriate network and information security measures and incident reporting. The IEC 62443 industrial security standard provides a widely adopted technical framework for OT network security zone architecture that applies globally. iFactory's platform is designed for deployment within OT security zones with all sensor traffic encrypted and access events audited, supporting NERC CIP and IEC 62443 compliance postures.
How does IoT monitoring integrate with the existing SCADA/EMS/DMS systems at a utility?
iFactory's smart grid platform integrates with existing SCADA, Energy Management Systems (EMS), and Distribution Management Systems (DMS) through standard utility data exchange protocols — IEC 61850 for substation communication, IEC 61968/61970 CIM-based APIs for enterprise data exchange, and ICCP (TASE.2) for control centre to control centre data flows. For OSIsoft PI historian environments, direct PI connector integration is available. The platform is designed as an analytics and equipment health layer that augments the existing operational systems rather than replacing them — so SCADA operators continue working in their existing environment while IoT sensor data is accessible through the iFactory platform's equipment health and predictive analytics interfaces.
What is partial discharge monitoring and how does it prevent HV cable failures?
Partial discharge (PD) is the incomplete electrical breakdown of insulating material within HV cables, joints, and terminations — a precursor to complete dielectric failure. PD events generate high-frequency electromagnetic pulses that can be detected by sensors installed at cable joints and terminations. By monitoring PD pulse amplitude, phase position, and count rate over time, condition monitoring systems can detect developing insulation defects and trend their progression from incipient fault to critical severity — typically providing 6–24 months of lead time before complete failure. Machine learning classification algorithms distinguish PD signatures from electrical noise and identify the fault mechanism (void discharge, conductor shield damage, moisture ingress) to support targeted maintenance decisions. In urban networks where HV cable failure means emergency excavation in public roads, this advance warning has enormous cost avoidance value.
What is a realistic total investment and payback period for an IoT smart grid monitoring programme?
Investment scale varies significantly by grid size, asset mix, and monitoring objectives. A focused transformer fleet IoT DGA monitoring programme for 50–100 HV transformers typically costs $500K–$2M for hardware, integration, and platform licensing over a 3-year period. Payback is typically achieved within 12–24 months of deployment, driven by a single avoided transformer emergency failure (cost: $2M–$8M including repair, emergency hire equipment, and customer compensation). A full distribution network FPI deployment enabling automated fault isolation across 200+ feeder kilometres typically costs $1M–$4M, with payback driven by regulatory performance incentives and avoided SAIDI penalties. iFactory provides ROI modelling specific to your asset portfolio and regulatory environment — request a grid investment ROI model.


