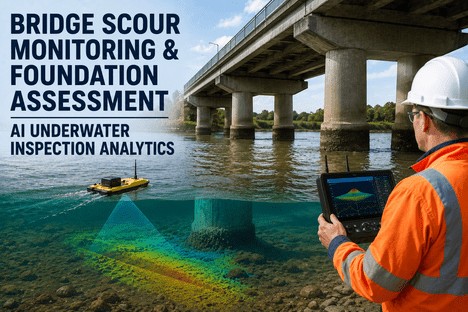
A flood event peaks at 3 a.m. The bridge engineer cannot be on site — the road leading to the structure has been under water since midnight. By dawn, when the water recedes enough to approach, the approach span has settled 150 mm at the abutment. The pier that looked stable during the biennial inspection four months ago now has an exposed foundation pad. The streambed around it dropped 1.8 metres during the flood — a scour episode that the inspection cycle never saw because the hole refilled with sediment after the event passed, a phenomenon the Federal Highway Administration calls "scour that heals." The bridge is posted for single-lane traffic the same day, and the emergency foundation assessment costs three times what a planned intervention would have. This is not a rare event. Stream instability and scour cause sixty percent of all bridge failures in the United States. The National Bridge Inventory includes more than 484,000 bridges over water, and a significant fraction of them have never had their foundations inspected below the waterline. The technology to close this gap exists now — not as a replacement for the diver inspection, but as a continuous monitoring layer that tracks streambed elevation changes, foundation exposure, and pier settlement in real time, generating alerts weeks or months before the next scheduled inspection would detect them.
Sonar-Based Scour Detection · AI Streambed Change Analytics · Foundation Exposure Monitoring · FHWA POA Compliance
The Scour That Takes a Bridge Does Not Happen During an Inspection. It Happens During a Flood, in the Dark, When No One Is Watching.
iFactory's AI-powered scour monitoring platform tracks streambed elevation, foundation exposure, and pier stability in real time — giving bridge engineers continuous visibility into the one hazard that biennial inspections are structurally unable to catch.
60%
Of all US bridge failures are caused by stream instability and scour — making it the single largest cause of bridge collapse nationwide, ahead of overloading, collision, and material degradation combined.
5x
The ratio of indirect costs — detours, lost commerce, emergency response — to direct bridge repair costs following a scour-induced failure. A single scour event can disrupt a regional transport network for months.
84%
Of US highway bridges cross water — and most have never had their foundations inspected below the waterline. The condition of the streambed around these foundations is largely unknown outside flood events.
USD 30M+
Annual direct scour-related bridge repair costs in the US, excluding flood damage to Federal-aid highways, which adds an estimated USD 50 million in separate repair expenditures each year.
Why Scour Is Different — and Why the Standard Inspection Protocol Cannot Catch It
Scour is fundamentally different from every other bridge deterioration mechanism because the evidence disappears after the event. A bearing that is cracking remains cracked until the next inspection. A joint seal that is torn remains torn. A girder with section loss remains visibly reduced. But a scour hole that forms around a pier during a flood event can refill with sediment within days or weeks of the flood receding — a process known in the hydraulic engineering literature as "scour healing." The bridge engineer who arrives for the scheduled biennial inspection eight months after the flood sees a streambed that looks stable. The scour event that removed 2 metres of foundation embedment is invisible. The foundation is now supporting design loads with half its original embedment, and no inspection protocol operating on a 24-month cycle will detect it until the next flood event exposes the reduced capacity at the worst possible moment.
The Scour Detection Gap — What Biennial Inspections Miss vs. What Continuous Monitoring Reveals
Scour Condition
Biennial Inspection
AI Continuous Monitoring
Detectable only if hole remains open at inspection time. Scour healing conceals 40–60% of significant scour events before the next inspection cycle.
Sonar depth sensors measure streambed elevation continuously. Scour hole formation detected in real time during the event, before or as it heals.
Visible only if water is clear enough and diver deployed. In turbid flood conditions, diver inspection is unsafe and often impossible.
Foundation elevation tracked relative to streambed. Exposure depth calculated automatically from sonar returns. Alert generated when remaining embedment drops below threshold.
Detectable only after settlement exceeds visible threshold — typically 25–50 mm. Cumulative settlement between inspections is unrecorded.
Tilt sensors and displacement transducers track pier position at 0.1 mm resolution. Settlement trend detected at 2–3 mm — months before visual observation would confirm it.
Post-flood recovery tracking
Single post-flood inspection provides one data point. No ability to distinguish between temporary scour and permanent loss of embedment.
Continuous post-event data shows scour hole refill rate, foundation recovery, or progressive degradation. Distinguishes between healed scour and permanent section loss automatically.
The FHWA Plan of Action Framework — and How Continuous Monitoring Fulfills It
The Federal Highway Administration requires every scour-critical bridge to have a Plan of Action that specifies monitoring procedures, alert thresholds, and intervention protocols. The current standard practice relies on a combination of visual inspection during low-flow conditions, diver deployment at scheduled intervals, and post-flood reconnaissance — all of which share the same limitation: they sample a dynamic hydraulic environment at static points in time. iFactory's AI scour monitoring platform is designed to fulfill and extend the FHWA POA framework by providing continuous data that supplements the periodic inspection regime with real-time streambed elevation tracking, foundation exposure measurement, and automated alert generation at the scour alert elevation and scour critical elevation thresholds that the POA defines.
A
Scour Alert Elevation Monitoring
The POA defines a scour alert elevation — the streambed level at which the agency must be notified and monitoring frequency must increase. The iFactory platform continuously compares measured streambed elevation against this threshold for every monitored pier and abutment. When streambed elevation drops to within the alert zone, an automated notification is sent to the designated POA contact with the measured elevation, the deviation from baseline, and the rate of change over the preceding monitoring window. This replaces the current practice of relying on post-event visual assessment to determine whether the alert threshold was activated.
Automated alert at POA-defined streambed elevation with measured deviation and rate of change.
B
Scour Critical Elevation Alert
At the scour critical elevation — the streambed level at which foundation capacity is compromised — the POA requires immediate notification and potential bridge closure. The iFactory platform generates a critical alert at this threshold with time-stamped elevation data, foundation exposure depth, and a direct link to the POA closure protocol document. The critical alert is communicated through redundant channels — platform dashboard, email, and SMS — to ensure the designated contact receives it within minutes regardless of time of day or network conditions. The alert log provides the documented evidence that the agency responded within the POA-specified timeframe, which is the record that FHWA compliance reviews and legal proceedings require.
Multi-channel critical alert with timestamped evidence and direct POA protocol linkage.
C
Post-Flood Event Documentation
FHWA POA requirements include documentation of scour measurements during and after flood events. The iFactory platform generates an automatic post-event report for every monitored structure after a flood episode, containing the peak scour depth recorded, the duration of streambed elevation below alert and critical thresholds, the post-event recovery elevation, and a comparison with the pre-event baseline. This report fulfills the POA documentation requirement without requiring an engineer to compile data from multiple sources or reconstruct the event timeline from incomplete field notes. The report is exportable in PDF and CSV formats for direct inclusion in the agency's POA record.
Automated post-flood POA report with peak scour, duration, recovery, and baseline comparison.
D
Countermeasure Performance Tracking
When scour countermeasures are installed — riprap, articulated concrete blocks, grout-filled mattresses, or pier geometry modifications — the POA requires monitoring to verify their effectiveness. The iFactory platform tracks streambed elevation at the countermeasure location and compares post-installation scour patterns against pre-installation baseline trends. If the countermeasure is not performing as designed, the system detects the deviation within one flood event and generates a countermeasure performance alert. This replaces the current practice of inspecting countermeasure condition at the next scheduled inspection cycle, which may be 12 to 24 months after installation.
Countermeasure effectiveness verified within one flood event — not deferred to the next inspection cycle.
Sonar Sensors · AI Depth Analytics · FHWA POA Integration · Post-Flood Reports
The FHWA Requires a Plan of Action for Every Scour-Critical Bridge. Continuous Monitoring Closes the Gap Between What the Plan Says and What the Biennial Inspection Can Detect.
iFactory aligns with the FHWA POA framework for scour-critical bridges — sonar-based streambed monitoring, automated alert generation at POA-defined thresholds, and post-flood documentation that turns the biennial inspection into a continuous record.
How AI and Sonar Technology Work Together to Monitor Scour Continuously
The iFactory scour monitoring platform integrates three technology layers that work together to provide continuous streambed visibility: a sonar sensor network that measures streambed elevation at each monitored pier and abutment, an AI analytics engine that processes the sonar returns to distinguish between scour, sediment deposition, and sensor noise, and a dashboard that presents the data as actionable information for the bridge engineer and the POA compliance record. Each layer is designed to operate autonomously in the submerged environment — no on-site calibration, no diver intervention, and no data processing burden on the engineering team.
Layer 01
Sonar Sensor Network
Continuous streambed elevation measurement at every monitored pier and abutment
Low-power sonar depth sensors mounted on each pier or abutment transmit ultrasonic pulses to the streambed and measure the return time to calculate elevation with 10 mm accuracy. Each sensor takes a reading at configurable intervals — typically every 15 minutes under normal conditions and every 60 seconds during flood events when the water surface elevation exceeds a configurable trigger level. Sensors are deployed on the upstream face of each pier to capture the leading-edge scour hole that is the primary failure mechanism, and on both sides of the pier to track differential scour patterns. The sensor housing is rated for continuous submerged operation and requires no surface power or data cabling — communication is via LoRaWAN or cellular backhaul through a sealed antenna that extends above the high-water mark. Battery life exceeds three years under normal operating conditions.
10 mm elevation accuracy
Submerged-rated continuous operation
Flood-triggered high-frequency sampling
Layer 02
AI Analytics Engine
Machine learning models that convert sonar returns into scour alerts
The AI analytics engine processes raw sonar data through three sequential models. The first model — a signal processing filter — separates the streambed return from debris, fish, turbulence, and air entrainment that create false returns during high-flow conditions. The second model — a baseline comparator — compares each processed elevation measurement against a rolling baseline that updates continuously to account for seasonal streambed variation, sediment transport cycles, and long-term degradation trends that are not related to scour. The third model — an anomaly detector — flags streambed elevation changes that exceed the normal range of variation for that specific pier location, accounting for the pier geometry, foundation type, and historical scour behaviour. When the anomaly detector identifies a change that exceeds the POA-defined alert threshold, it generates a tiered alert — advisory at the scour alert elevation, critical at the scour critical elevation.
Signal processing and noise rejection
Rolling baseline comparison
POA-threshold tiered alert generation
Layer 03
Engineer Dashboard and POA Records
Real-time visibility, event history, and automated compliance documentation
The dashboard presents the processed data as a map-based network view showing the current scour risk status for every monitored bridge — green for normal streambed elevation within baseline range, yellow for elevation approaching the scour alert threshold, red for elevation below the alert threshold. Each bridge card displays the current streambed elevation relative to the POA thresholds, the trend direction (stable, deepening, or recovering), the date of the last significant scour event, and the time since the last diver inspection. Clicking through to the bridge detail view shows the elevation time series, the event log with every threshold crossing, and the post-event reports that are generated automatically after each flood episode. The POA records module aggregates all data required for FHWA compliance — alert logs, threshold crossing documentation, post-flood reports, and countermeasure performance data — in a searchable, exportable format that can be produced for any bridge, date range, or flood event in under 30 seconds.
Real-time network scour status
Automated post-flood POA reports
FHWA-compliant export in 30 seconds
What the Bridge Engineer's Dashboard Shows — Four Views That Replace the Scour Data Gap
The iFactory dashboard is designed for the specific workflow of a bridge engineer managing scour risk across a network of waterway bridges. Every view answers a question that the biennial inspection leaves unanswered: Did any bridge in my network experience streambed elevation change during the last flood event? Which piers are closest to their scour critical elevation? Is the scour trend accelerating or stable? And when the FHWA compliance review arrives, is the documentation ready to demonstrate that every scour alert was detected and acted upon within the POA-specified timeframe?
View 01
Network Scour Risk Map
A map-based view of all waterway bridges in the network, colour-coded by current scour risk status relative to the POA-defined alert and critical thresholds. Bridges that have experienced streambed elevation change since the last flood event are flagged automatically with the measured change and the current risk level. The engineer opens this view on a Monday morning or after a regional flood event and sees within 10 seconds which bridges need attention, which are stable, and which require a post-event field inspection before the POA deadline expires. Filters allow the view to be narrowed by scour criticality rating, bridge type, foundation type, or last POA review date.
Action: Prioritise post-flood inspections by measured scour severity rather than by bridge age or inspection backlog.
View 02
Streambed Elevation Time Series — Per Pier
For each monitored pier, the dashboard displays a time-series chart of streambed elevation with the POA alert and critical thresholds overlaid as horizontal bands. The engineer can select any date range — the last 24 hours, the most recent flood event, the full monitoring history — and see the elevation trend, the peak scour depth recorded during each event, the recovery pattern after each event, and the net change since the start of monitoring. An elevation trend that shows incomplete recovery after successive flood events — for example, streambed dropping 0.3 metres in each of three events with only 0.2 metres of recovery after each — is flagged as a progressive degradation pattern that requires countermeasure evaluation before the next flood season.
Action: Identify progressive scour patterns that biennial inspections never detect because each individual event appears within normal range.
View 03
Post-Flood Event Reports
After each flood event that triggers sonar readings above the configured water surface elevation threshold, the platform generates an automatic post-event report for every monitored bridge. The report contains the peak water surface elevation recorded, the minimum streambed elevation at each pier, the maximum scour depth, the duration of time spent below the alert and critical thresholds, the post-event recovery elevation measured 7 days after the event, and a comparison with the pre-event baseline. The report is generated within 24 hours of the flood event peak and is accessible from the dashboard or delivered by email to the designated POA contacts. For FHWA compliance, the report provides the documented evidence that the agency monitored the structure during the flood event and has a record of the maximum scour experienced — even if the scour hole healed before a diver could be deployed.
Action: Fulfill FHWA post-flood documentation requirements automatically — no manual data compilation from multiple sources.
View 04
FHWA Compliance Record Export
The compliance module aggregates every piece of data required for FHWA scour documentation into a single export: the POA document with current alert and critical thresholds, the sensor installation and calibration records, the complete alert log with every threshold crossing timestamped and linked to the measured streambed elevation, the post-flood event reports for every significant flood during the monitoring period, the countermeasure performance data if applicable, and the diver inspection reconciliation records that show how the continuous monitoring data confirms or supplements the biennial inspection findings. The export is generated for any bridge, any date range, or any flood event in under 30 seconds and is formatted for direct submission to FHWA reviewers or inclusion in the bridge file.
Action: Produce the complete FHWA POA compliance package for any bridge in 30 seconds — from alert log to post-flood reports.
"
We have 52 scour-critical bridges in our inventory, and our biennial inspection cycle meant that each bridge was getting an underwater look every 24 months — assuming the water was clear enough for the diver to see anything, which it often was not. We had three divers covering the whole network, and after every spring flood season, we would prioritize which bridges to inspect first based on the flood magnitude and the bridge age. It was a guessing game. The sonar monitoring system changed this completely. During the first flood season after deployment, the system detected a 1.4-metre scour hole at Pier 3 of a bridge that was not even in our top 10 for post-flood priority — the flood had been moderate, the bridge was relatively new, and we would never have sent a diver there until the next scheduled inspection 14 months later. We closed the bridge to heavy vehicles for 72 hours, deployed riprap, and confirmed with a follow-up sonar scan that the countermeasure held. That single detection paid for the entire monitoring system deployment across all 52 bridges. We have not had a single unplanned scour-related lane closure since the system went live.
— Bridge Engineer, US State DOT — 52 Scour-Critical Bridges, Coastal and Riverine Environments
From Reactive to Continuous — the Economic and Safety Case for AI-Powered Scour Monitoring
The case for continuous scour monitoring is not theoretical — it is built on a well-documented economic and safety record. A single undetected scour event that leads to emergency bridge closure or collapse generates costs that are five to ten times the cost of a planned scour countermeasure installation, when direct repair, traffic disruption, detour routing, and litigation are included. The agencies that have deployed continuous sonar-based scour monitoring with AI analytics — including state DOTs in Oregon, Georgia, Iowa, and Alaska, in collaboration with USGS and FHWA research programmes — have documented outcomes that consistently demonstrate the return on investment within the first flood season. The Georgia Department of Transportation field testing of an ML-enhanced scour monitoring system demonstrated the ability to estimate scour depths during high flows with sufficient accuracy to inform real-time closure decisions, and the system generated automated alerts that allowed optimized deployment of inspection teams rather than blanket post-flood reconnaissance of all scour-critical structures.
90%+
Accuracy of AI-based scour depth prediction models validated against field measurements. Machine learning models consistently outperform empirical equations in predicting pier scour depth.
10x
Return on investment within the first flood season reported by agencies deploying continuous sonar-based scour monitoring — measured as emergency intervention costs avoided versus monitoring system cost.
100%
Elimination of unplanned scour-related lane or bridge closures reported by early adopters of continuous monitoring — because every significant scour event is detected and addressed before it reaches the critical threshold.
Conclusion
Bridge scour is the most consequential hazard in the bridge management inventory — it causes more failures than any other mechanism, it operates invisibly below the waterline, and its evidence can disappear within days of the event that created it. The biennial inspection protocol that serves adequately for superstructure and substructure condition assessment is structurally incapable of capturing the scour events that occur between inspection cycles, during flood events when the bridge is inaccessible, or in conditions where scour healing conceals the loss of foundation embedment. The gap is not in the understanding of scour mechanics — it is in the frequency and continuity of the data used to track streambed elevation at each pier and abutment.
AI-powered sonar monitoring addresses this gap directly. By measuring streambed elevation continuously, comparing every measurement against a dynamically updated baseline, and generating tiered alerts at the thresholds the FHWA Plan of Action defines, the system provides bridge engineers with the one capability that biennial inspections cannot deliver: visibility into what happens to the streambed during the flood event itself, not after the water recedes and the evidence has been reshaped by the same flow that created the scour. The agencies that have deployed this technology are not replacing their inspection programme — they are supplementing it with a continuous data layer that makes the biennial inspection more effective by telling the diver or the sonar inspection team where to look and what to expect before they deploy.
The economic and safety outcomes are documented and consistent. Agencies that deploy continuous scour monitoring eliminate unplanned scour-related closures, reduce post-flood reconnaissance costs by enabling targeted rather than blanket inspections, and generate the FHWA compliance documentation that demonstrates proactive management of the scour-critical inventory. Every flood event produces a record — the peak scour depth, the duration below threshold, the post-event recovery — that the biennial inspection cycle would have missed entirely if the scour hole healed before the diver arrived.
iFactory's AI-powered scour monitoring platform is designed for bridge engineers who need continuous visibility into the one bridge hazard that the standard inspection protocol cannot catch. Book a Demo to see the platform configured for your scour-critical bridge inventory and waterway conditions. Or talk to an expert about a free scour monitoring assessment for your highest-risk waterway bridges.
Frequently Asked Questions
The Next Flood Event Will Test Every Scour-Critical Bridge in Your Network. Continuous Monitoring Ensures You Know Which Ones Are at Risk Before the Water Rises. Get a Free Scour Monitoring Assessment.
iFactory's AI-powered scour monitoring platform for bridge engineers — real-time sonar-based streambed elevation tracking, foundation exposure detection, FHWA POA compliance documentation, and automated post-flood event reports generated from the data your bridges produce every day.