Every bridge asset manager knows the pattern: a deck that rated 7 at the last inspection cycle is found to have a delaminated section large enough to require lane closure at the next one. The intervening years produced no visible symptom from the roadway surface — no cracking pattern change, no spalling, no sign that chloride concentration at the reinforcement depth had crossed the corrosion threshold. This is the defining limitation of visual inspection for concrete bridge decks: by the time chloride-induced deterioration becomes visible on the surface, the reinforcement corrosion has been active for years, the section loss is already measurable, and the rehabilitation cost has escalated from a overlay to a full deck replacement. AI-powered deterioration prediction models that integrate chloride penetration rates, corrosion propagation, and condition history close this visibility gap — giving asset managers the lead time to schedule rehabilitation at the optimal point in the deterioration curve rather than at the point of visible failure. This article covers how AI modeling of chloride ingress, reinforcement corrosion, and delamination progression transforms bridge deck management from reactive repair to predictive preservation.
Bridge Decks Deteriorate From the Inside Out. Visual Inspection Catches It Years Late. AI Predicts the Corrosion Timeline Before the Surface Shows a Single Crack.
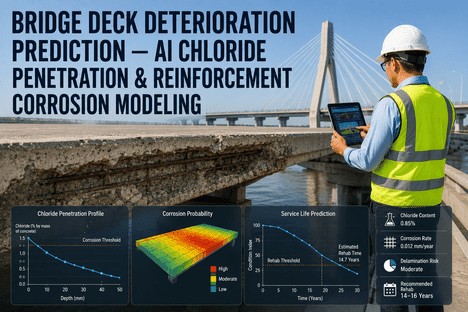
iFactory's AI deterioration modeling platform integrates chloride diffusion analysis, corrosion rate prediction, and condition-based rehabilitation scheduling — giving asset managers the quantitative lead time needed to move from reactive deck repair to predictive preservation planning.
Average time between corrosion initiation at reinforcement depth and first visible surface cracking on concrete bridge decks — the hidden deterioration window that visual inspection cannot see
93%
Accuracy of CNN-LSTM deep learning models in predicting bridge deck condition ratings from NBI data — enabling reliable deterioration forecasting across bridge portfolios
Up to 41%
Reduction in time to corrosion initiation for cracked deck sections compared to uncracked concrete — highlighting why crack width data is essential for accurate service life prediction
58.5%
Potential life-cycle cost reduction through optimal timing of preventive deck maintenance — AI-determined intervention windows replace fixed-interval or reactive repair strategies
The Hidden Deterioration Curve: Why Bridge Decks Fail From the Inside Out
Concrete bridge deck deterioration follows a non-linear progression that visual inspection cannot fully capture. The deterioration curve has four distinct phases, and by the time the third phase produces surface-visible symptoms, the deck has already lost a measurable percentage of its structural capacity. Understanding this curve is the foundation of AI-based deterioration prediction.
Phase 01
Chloride Ingress — Initiation Period
Chloride ions from deicing salts penetrate the concrete cover through diffusion, driven by the concentration gradient between the surface and the reinforcement depth. Fick's second law of diffusion governs the transport rate: the apparent diffusion coefficient, surface chloride concentration, and cover depth determine the time required for chloride content at the reinforcement level to reach the critical threshold (typically 0.4 to 1.2 kg/m\u00B3 depending on the standard). During this phase, the deck surface shows no visible deterioration. The only indicators are chloride content profiles from core samples or embedded wire sensors that detect the advancing chloride front. The initiation period can range from 5 to 25 years depending on concrete quality, cover depth, crack width, and exposure conditions.
AI input: Diffusion coefficient calibration from chloride profiles. Crack width influence modeling. Temperature-adjusted diffusion rates.
Phase 02
Corrosion Initiation and Propagation
Once the chloride concentration at the reinforcement exceeds the critical threshold, the passive film on the steel surface breaks down and corrosion begins. The corrosion rate is governed by available oxygen, moisture content, temperature, and the electrical resistivity of the concrete. Corrosion products (rust) occupy up to 6 times the volume of the original steel, generating expansive stresses that accumulate at the steel-concrete interface. During this phase, the deck surface remains visually intact. The reinforcement is losing section, but no surface crack has propagated to a visible width. The propagation period lasts 3 to 8 years for typical bridge deck exposures before the first surface crack appears.
AI input: Corrosion current density prediction from environmental data. Section loss modeling. Time-to-cracking estimation.
Phase 03
Cracking, Delamination, and Spalling
The expansive corrosion products generate tensile stresses that exceed the concrete tensile strength, producing cracks parallel to the reinforcement plane. These cracks propagate to the surface as delamination planes. Once a delamination reaches the surface, the crack creates a direct pathway for accelerated chloride ingress, additional moisture, and oxygen — further increasing the corrosion rate at the exposed bar. Surface spalling occurs when the cover concrete separates from the reinforcement, producing the visible defect that triggers a condition rating drop. By this stage, the corrosion damage at the reinforcement level is extensive and the rehabilitation options shift from preventive overlay to partial or full deck replacement.
AI input: Delamination propagation rate from inspection records. Crack pattern classification from surface images.
Phase 04
Capacity Loss and Structural Deterioration
As corrosion progresses, the reinforcement cross-section is progressively reduced. For decks with epoxy-coated reinforcement, the corrosion typically initiates at coating defects and propagates locally. For uncoated reinforcement, general corrosion reduces the bar diameter uniformly across the affected area. The flexural capacity of the deck section decreases as the reinforcement area decreases and as the concrete cover deteriorates. The deck condition rating falls below the threshold that triggers load posting or replacement prioritisation. The asset manager now faces the highest-cost intervention point — deck replacement with associated traffic control, user delay costs, and full closure impacts that can exceed the direct construction cost by a factor of 10 when user costs are included.
AI input: Residual capacity estimation from corrosion models. Remaining service life prediction. Cost-optimised intervention timing.
The Deck Surface Is Not the Deck Condition. AI Predicts What Visual Inspection Cannot See.
iFactory's AI deterioration modeling platform combines physics-based chloride diffusion models with machine learning corrosion prediction — giving asset managers the data to schedule deck rehabilitation at the optimal point in the deterioration curve, not at the point of visible failure.
AI Deterioration Models: From Fick's Law to Predictive Condition Forecasting
Traditional deck deterioration modeling relies on Markov chains that transition between condition states based on historical probabilities. These models treat deterioration as a memoryless process — the probability of moving from condition 6 to condition 5 is the same regardless of whether the deck is 10 years old or 40 years old. AI models replace this assumption with data-driven approaches that learn the actual relationship between deterioration drivers and condition outcomes.
Approach 01
Physics-Guided Neural Networks
Fick's second law provides the physics-based governing equation for chloride diffusion. Physics-guided neural networks embed the diffusion equation as a constraint in the loss function during training — the model learns the effective diffusion coefficient, surface chloride concentration, and critical threshold from field data while ensuring the predicted chloride profile satisfies the governing physics. This hybrid approach reduces the data required for training compared to pure ML models and produces predictions that remain physically plausible even when extrapolating beyond the training data range. Field validation on instrumented bridge decks demonstrates that physics-guided models predict the time to corrosion initiation within 15% of measured values, compared to 30-40% error for purely statistical models.
Approach 02
Deep Learning Condition Prediction
CNN-LSTM and Transformer-based architectures trained on NBI condition ratings, environmental data, traffic loads, and maintenance history achieve 90-93% accuracy in predicting deck condition ratings at the next inspection cycle. These models capture the temporal dependencies in deterioration trajectories — a deck that has held a condition 6 for three consecutive inspections deteriorates differently from a deck that dropped from condition 7 to condition 6 in a single cycle. The models identify the key drivers of deterioration for each deck population: age, chloride exposure zone, average daily traffic, deck area, and skew angle consistently emerge as the most influential features in SHAP analysis across multiple state-level studies.
Approach 03
Multi-Modal Delamination Detection
Ground Penetrating Radar and Infrared Thermography data processed through hierarchical attention networks achieve up to 99.8% AUC for subsurface delamination detection in concrete bridge decks. Cross-modal attention mechanisms fuse GPR signal sequences with IRT thermal imagery to identify delamination zones that neither sensor could detect independently. The model quantifies prediction confidence through Monte Carlo dropout, enabling selective prediction: cases with high uncertainty are routed to human review while high-confidence detections are automatically logged. This approach has been validated on five real-world bridge decks and achieves 93% selective prediction accuracy while reducing the number of false positives by 60% compared to single-modality analysis.
Approach 04
Digital Twin Deterioration Simulation
Digital twin frameworks integrate historical 2D damage drawings digitised through YOLOv7 object detection with 3D bridge models to create a time-indexed deterioration record. Eight representative damage states are defined from corrosion initiation through full-section deterioration. The digital twin simulates deterioration progression for each element using empirical corrosion models calibrated to the specific bridge environment. As new inspection data is ingested, the twin updates its deterioration trajectory predictions. The framework has been validated on bridge slab records from Japan and demonstrates that incorporating cumulative repair history significantly improves prediction accuracy compared to models that treat each inspection as an independent observation.
What the AI Deck Deterioration Dashboard Shows the Asset Manager
The asset manager's dashboard is organised around the decisions that determine capital programme effectiveness: which decks need intervention within the planning horizon, what is the optimal rehabilitation timing for each deck, and what is the budget required to maintain the portfolio above the target condition threshold. AI deterioration predictions provide the quantitative basis for each of these decisions.
Asset View 01
Deck Condition Forecast — Current Rating and 10-Year Projection
For each bridge deck, the dashboard displays the current condition rating alongside the AI-predicted rating trajectory over the next 10 years. The projection is based on the ML deterioration model calibrated to the specific deck characteristics — age, chloride exposure zone, traffic volume, deck type, maintenance history, and crack survey data. The confidence interval around the projection widens with the forecast horizon, reflecting increasing uncertainty. The asset manager sees which decks are projected to cross the intervention threshold (typically condition 5 for preventive overlay, condition 4 for deck replacement consideration) within the capital planning window.
Manager action: Flag decks approaching intervention threshold for detailed corrosion assessment and rehabilitation scoping.
Asset View 02
Chloride Penetration Risk Map — Time to Corrosion Initiation
For decks with available chloride profile data, the dashboard computes the estimated time to corrosion initiation based on the apparent diffusion coefficient, cover depth, surface chloride concentration, and critical threshold. Decks are colour-coded by corrosion risk category: initiation not expected within 20 years, initiation expected within 10-20 years, initiation expected within 5-10 years, and initiation expected within 5 years. Crack width data from deck surveys is incorporated into the risk calculation — cracked sections have diffusion rates up to 3 times higher than uncracked sections, reducing the time to corrosion initiation by up to 41% for a 0.25 mm crack width.
Manager action: Decks with initiation within 5 years scheduled for corrosion mitigation — sealer application or cathodic protection.
For each deck approaching the intervention threshold, the dashboard runs a life-cycle cost comparison across multiple rehabilitation strategies: do nothing (continued deterioration to replacement), concrete overlay now, concrete overlay at next cycle, polymer overlay, sealer reapplication, or deck replacement. Each strategy is simulated over the remaining service life using the AI deterioration model to project condition trajectories under each intervention. The life-cycle cost includes direct construction costs, traffic control costs, user delay costs, and agency administration costs. The dashboard recommends the intervention timing and type that minimises 50-year life-cycle cost while maintaining the deck condition above the agency's minimum threshold.
Manager action: Prioritise rehabilitation budget to decks where LCC-optimised timing produces the greatest cost avoidance.
For decks instrumented with corrosion monitoring sensors — wire sensors, half-cell potential probes, linear polarisation sensors, or embedded chloride sensors — the dashboard displays live corrosion rate data alongside the AI-predicted corrosion progression. When the measured corrosion rate deviates from the predicted trajectory by more than the configurable threshold, the dashboard triggers an alert and updates the deterioration forecast. This real-time feedback loop continuously refines the corrosion model for the instrumented deck and informs the prediction for similar decks in the portfolio without sensors.
Manager action: Sensor-triggered forecast updates drive condition-based intervention timing rather than fixed-interval assumptions.
Asset View 05
Budget Scenario Planner — Condition Target vs. Funding Level
The portfolio-level planning view projects the average deck condition across all bridges under different funding scenarios. The asset manager sets a target average condition rating and the dashboard computes the annual funding required to achieve and maintain that target over the 10-year planning horizon. The scenario engine accounts for the non-linear cost of deferred intervention: a deck that receives a preventive overlay at condition 6 costs approximately 30-40% less than the same deck receiving a partial replacement at condition 4. The dashboard quantifies the cost of delay in terms of both direct construction costs and user delay costs, giving the asset manager the economic justification for preventive funding requests.
Manager action: Budget scenario analysis drives capital programme funding requests with quantified cost-avoidance data.
Asset View 06
NDE Integration — GPR and IRT Delamination Mapping
For agencies deploying non-destructive evaluation technologies, the dashboard integrates GPR and IRT survey results directly into the deck condition assessment. Delamination maps generated from multi-modal data fusion are overlaid on the bridge deck plan, with each delamination zone quantified by area, depth, and severity classification from the AI analysis. Delamination extent is incorporated into the condition rating recommendation and the deterioration forecast — a deck with 5% delaminated area but no surface spalling receives a different condition trajectory than a deck with no detectable delamination, even if their surface appearance is identical.
Manager action: NDE-identified delamination zones trigger targeted corrosion assessment and preventive overlay scheduling.
$164B
Estimated Cost to Repair US Bridge Deck Deterioration — With One-Third of Decks Rated Structurally Deficient
AI-powered deterioration prediction enables agencies to shift from reactive replacement to preventive preservation, reducing the lifecycle cost of deck management by identifying the optimal intervention window years before surface deterioration becomes visible.
10x
User Delay Costs Can Exceed Direct Deck Repair Costs — Making Intervention Timing a Transportation Economics Decision
Life-cycle cost optimisation with AI deterioration models accounts for both direct repair costs and user delay costs, producing intervention schedules that minimise total cost to the agency and the travelling public.
Our deck management strategy was based on age — replace at 40 years, overlay at 25 years — with no adjustment for actual chloride exposure, crack condition, or corrosion activity. We were overlaying decks that did not need it and leaving decks unaddressed that had active corrosion at the reinforcement level but no surface symptom. The AI deterioration model changed our entire capital programme. When we ran the chloride penetration model against our deck inventory, we found that 30% of our decks under 25 years old had chloride concentrations at the reinforcement depth that were already above the critical threshold. The surface showed nothing. Those decks were scheduled for corrosion mitigation in the current capital cycle instead of waiting for visible delamination. The decks that were approaching 40 years but had low chloride exposure and no corrosion activity were pushed out by 10 years. The first year of condition-based scheduling saved us approximately USD 4.2 million in avoided emergency deck replacements and deferred unnecessary overlays.
— Asset Management Director, State Department of Transportation — 4,200 Bridge Deck Inventory
Conclusion
Bridge deck deterioration is not a visible-surface problem — it is a hidden-chemistry problem. Chloride ions penetrate concrete year after year, accumulating at the reinforcement depth until the critical concentration is reached. Corrosion begins. Section loss accumulates. The expansive corrosion products generate internal stresses that propagate as delamination planes. And through all of this, the deck surface remains intact — no crack, no spall, no visible indication that the structural capacity of the deck is degrading. By the time the first surface crack appears, the corrosion has been active for 3 to 8 years, and the rehabilitation pathway has shifted from a preventive overlay that costs tens of dollars per square metre to a deck replacement that costs hundreds.
AI-powered deterioration prediction closes this detection gap. Physics-guided neural networks calibrated to chloride profile data predict the time to corrosion initiation with 15% error. Deep learning models trained on NBI condition histories forecast deck ratings with 93% accuracy across portfolios of thousands of bridges. Multi-modal delamination detection combining GPR and IRT through hierarchical attention networks identifies subsurface deterioration with 99.8% AUC. Life-cycle cost optimisation driven by these predictions produces intervention schedules that reduce total ownership costs by up to 58.5% compared to fixed-interval or reactive strategies. The hidden deterioration curve is no longer hidden — and asset managers who deploy these models convert the invisible process of chloride-induced corrosion into visible, actionable data for capital programme decisions.
iFactory's AI deck deterioration prediction platform is built for bridge asset managers who need to move from age-based or visual-inspection-based deck management to condition-based, data-driven preservation planning. Book a Demo to see the deterioration model configured for your deck inventory and chloride exposure conditions, or talk to an expert about a free deck deterioration risk assessment for your bridge portfolio.
Frequently Asked Questions
The AI deterioration model operates at two tiers depending on available data. For agencies with chloride profile data from core samples — typically measured at 6 mm depth increments from the surface to below the reinforcement level — the physics-guided neural network calibrates the apparent diffusion coefficient, surface chloride concentration, and critical threshold directly. The model then computes the time to corrosion initiation for each sample location and spatial correlation zone. For agencies without chloride profile data, the ML deterioration model uses NBI condition ratings, age, traffic volume, climate zone (freeze-thaw cycles, annual precipitation, deicing salt application rates), deck type, and maintenance history to predict condition trajectories. This approach has been validated across multiple state DOT datasets and achieves 90-93% accuracy in predicting deck condition ratings at the next inspection cycle. Agencies without existing chloride data can start with the NBI-based ML model and supplement with targeted chloride sampling on high-priority decks — typically 6 to 12 cores per representative bridge per chloride exposure zone — to calibrate the physics-guided model over time. Talk to an expert about configuring the deterioration model tier appropriate for your current data availability.
Crack width is incorporated as a direct modifier to the apparent diffusion coefficient in the chloride ingress model. For uncracked concrete, the diffusion coefficient is determined from chloride profile calibration or from mix-design-specific literature values. For cracked sections, the effective diffusion coefficient is partitioned into contributions from uncracked and cracked regions using the relationship derived by Djerbi et al.: D_cracked = D_uncracked + f(w), where f(w) is a polynomial function of crack width validated for cracks ranging from 0.05 mm to 0.50 mm width. For a 0.25 mm crack — the maximum allowable width under the Canadian Highway Bridge Design Code for decks exposed to deicing salts — the effective diffusion coefficient increases by approximately 3 times compared to uncracked concrete, reducing the time to corrosion initiation by 34-41% depending on the concrete mix design and environmental exposure. The model applies this crack-width modification spatially: decks with crack survey data have individual crack widths mapped to specific deck zones, while decks without survey data use a default crack-width distribution based on age, deck type, and traffic loading history. The crack-width modifier is updated after each inspection cycle as new crack survey data becomes available. Book a Demo to see crack-width-modified chloride ingress modeling configured for your deck inspection data format.
The deterioration model explicitly incorporates maintenance history as a feature input. Each deck's record includes a maintenance event log — sealant application date and type, overlay type and installation year, crack repair history, cathodic protection installation — and the model learns the effect of each intervention type on the deterioration trajectory. For example, the model learns that a silane sealer applied at condition 6 extends the time to next overlay by approximately 7 to 12 years depending on traffic and exposure, while the same sealer applied at condition 4 provides only 2 to 4 years of additional service life because corrosion is already active at the reinforcement level. The digital twin framework uses a unique coding system that embeds the damage and repair history into the 3D bridge model with temporal and spatial tracking. When a deck has received multiple overlays, each overlay event is recorded with its extent, material type, installation year, and observed performance in terms of condition rating trajectory before and after the intervention. The model separates the effect of maintenance from inherent durability by comparing the post-intervention deterioration rate to the pre-intervention rate for the same deck and to the deterioration rate of similar decks without the intervention. Talk to an expert about configuring maintenance history tracking for your deck inventory.
Yes. The life-cycle cost optimisation engine integrates both agency costs (direct construction, traffic control, engineering, administration) and user delay costs (additional travel time, vehicle operating costs, and accident costs during the work zone period). User delay costs are calculated using standard FHWA work zone user cost methodologies based on average daily traffic, detour length, work zone speed reduction, work duration, and the hourly value of travel time. The optimisation runs a Monte Carlo simulation over the remaining service life of the deck — typically 50 years — comparing the total life-cycle cost under each intervention strategy applied at each possible intervention year within the planning horizon. For each simulation year, the AI deterioration model projects the condition trajectory under the selected intervention, and when the projected condition falls below the agency's minimum acceptable threshold (typically 4 for deck replacement, 5 for preventive overlay), the simulation schedules the next intervention. The total life-cycle cost is the sum of all intervention costs across the simulation period, discounted to present value. The engine identifies the intervention timing that minimises the total present-value life-cycle cost. The output is specific to each deck because the deterioration rate, traffic volume, detour impact, and intervention cost factors are deck-specific. Agencies using the optimisation have documented life-cycle cost reductions of 30-58% compared to fixed-interval replacement schedules. User delay costs typically account for 50-70% of total life-cycle costs for high-traffic bridges, making intervention timing on these structures a transportation economics decision as much as a structural engineering one. Book a Demo to see the optimisation engine configured for your deck portfolio and traffic data.
The Hidden Deterioration Curve Costs Millions in Unseen Damage. AI Predicts It Before the Surface Shows a Single Crack. Get a Free Deck Deterioration Risk Assessment.
iFactory's AI deck deterioration prediction platform for bridge asset managers — physics-guided chloride ingress modeling, ML condition forecasting, multi-modal delamination detection, and life-cycle cost optimisation that converts hidden corrosion data into actionable capital programme decisions.