A reliability manager has forty work orders open and a maintenance crew that can only get to twelve of them this week. Without a real answer to which twelve matter most, the choice usually comes down to whoever complained loudest in the morning meeting, not whichever asset is actually closest to a failure that would shut down production or put someone at risk. That guesswork is expensive in a way most budgets never fully see, because it means critical equipment waits behind low-consequence equipment simply because nobody had a number to argue with. iFactory's AI infrastructure risk scoring platform gives every asset a single ranked score built from condition, likelihood of failure, and consequence, and you can book a demo to see your own asset list ranked in minutes.
Stop Guessing Which Asset Fails Next. Rank Them.
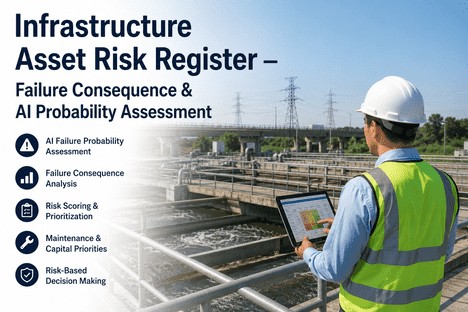
iFactory combines condition data, failure history, and business consequence into one risk score per asset, then ranks your entire inventory so maintenance dollars and crew hours go to what actually threatens uptime, safety, and revenue this week, not whichever work order is loudest.
Undifferentiated Maintenance Quietly Drains the Budget
Most maintenance organizations do not lack effort, they lack differentiation. Without a structured way to separate the handful of assets that carry real consequence from the much larger group that does not, teams end up spreading the same PM intensity across everything, over-servicing equipment that could safely run to failure while under-servicing the equipment that cannot. The pattern is consistent across industries: a small share of the asset base drives most of the operational risk, and organizations that cannot identify that share pay for it twice, once in wasted maintenance hours and again in the unplanned failures that structured prioritization would have caught first.
One Score Built From Three Questions Every Asset Owner Actually Asks
A risk score is only useful if the math behind it makes sense to the people relying on it. iFactory builds each asset's score from three factors that maintenance and reliability teams already think in terms of, then combines them consistently so a pump, a bridge, and a transformer can all be compared on the same scale.
This is the same logic behind long-standing reliability methods like failure mode and effects analysis, applied continuously and automatically instead of once a year in a workshop. As new inspection data, sensor readings, and work order history come in, the score updates, so the ranked list your team works from today reflects this week's reality, not a snapshot from the last time someone ran the analysis by hand.
Not Every Asset Deserves the Same Maintenance Strategy
Once every asset has a score, the platform groups them into tiers that map directly to a maintenance strategy, so the output is not just a number, it is a decision. This is what keeps teams from over-maintaining equipment that could safely run to failure while under-maintaining the handful of assets that cannot be allowed to fail unexpectedly.
Tier boundaries are not fixed forever. An asset that has run reliably for years can move up in priority the moment its condition trend turns or a redundant backup goes offline, and the platform reflects that shift automatically instead of waiting for the next annual review to notice.
Give Your Crew a Ranked List Instead of a Long One
iFactory turns condition data, failure history, and consequence into one risk score per asset, so your team always knows what to fix first. Book a demo and see your own inventory ranked live.
The Inputs Behind Every Ranking
A risk score is only as trustworthy as the data behind it, which is why iFactory pulls from every source your operation already generates rather than asking teams to fill out one more separate assessment form.
Your Whole Inventory, Ranked on One Screen
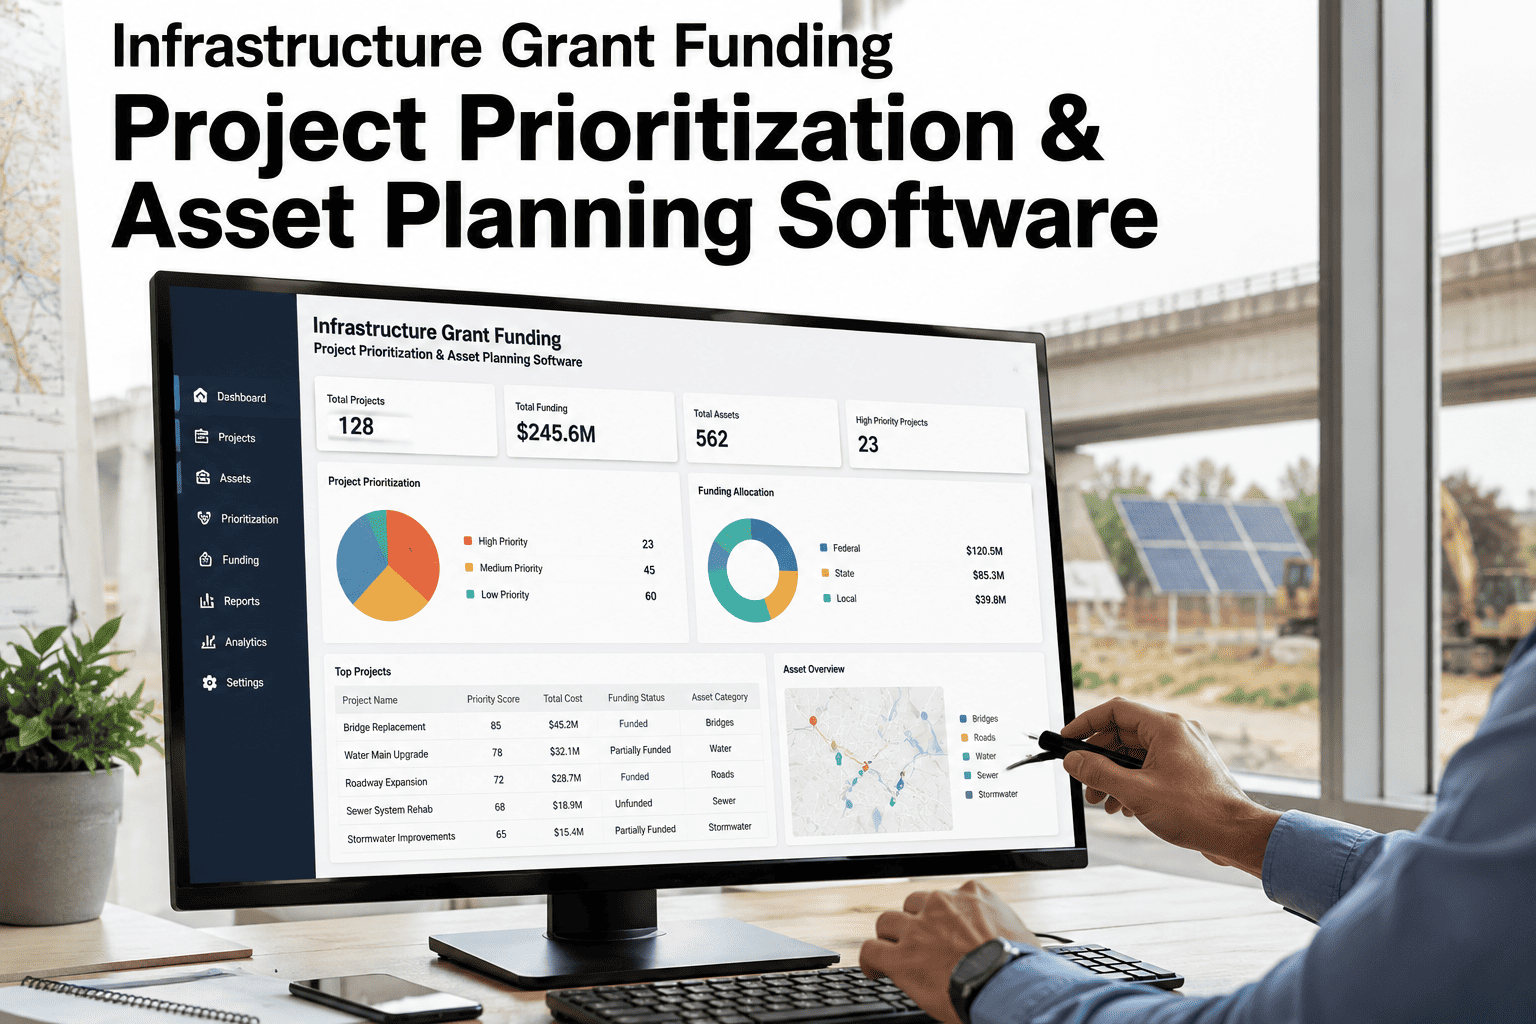
Instead of a spreadsheet with hundreds of rows and no clear starting point, the platform surfaces a single ranked dashboard, refreshed as new data arrives, so the answer to "what should we work on today" is never more than one screen away.
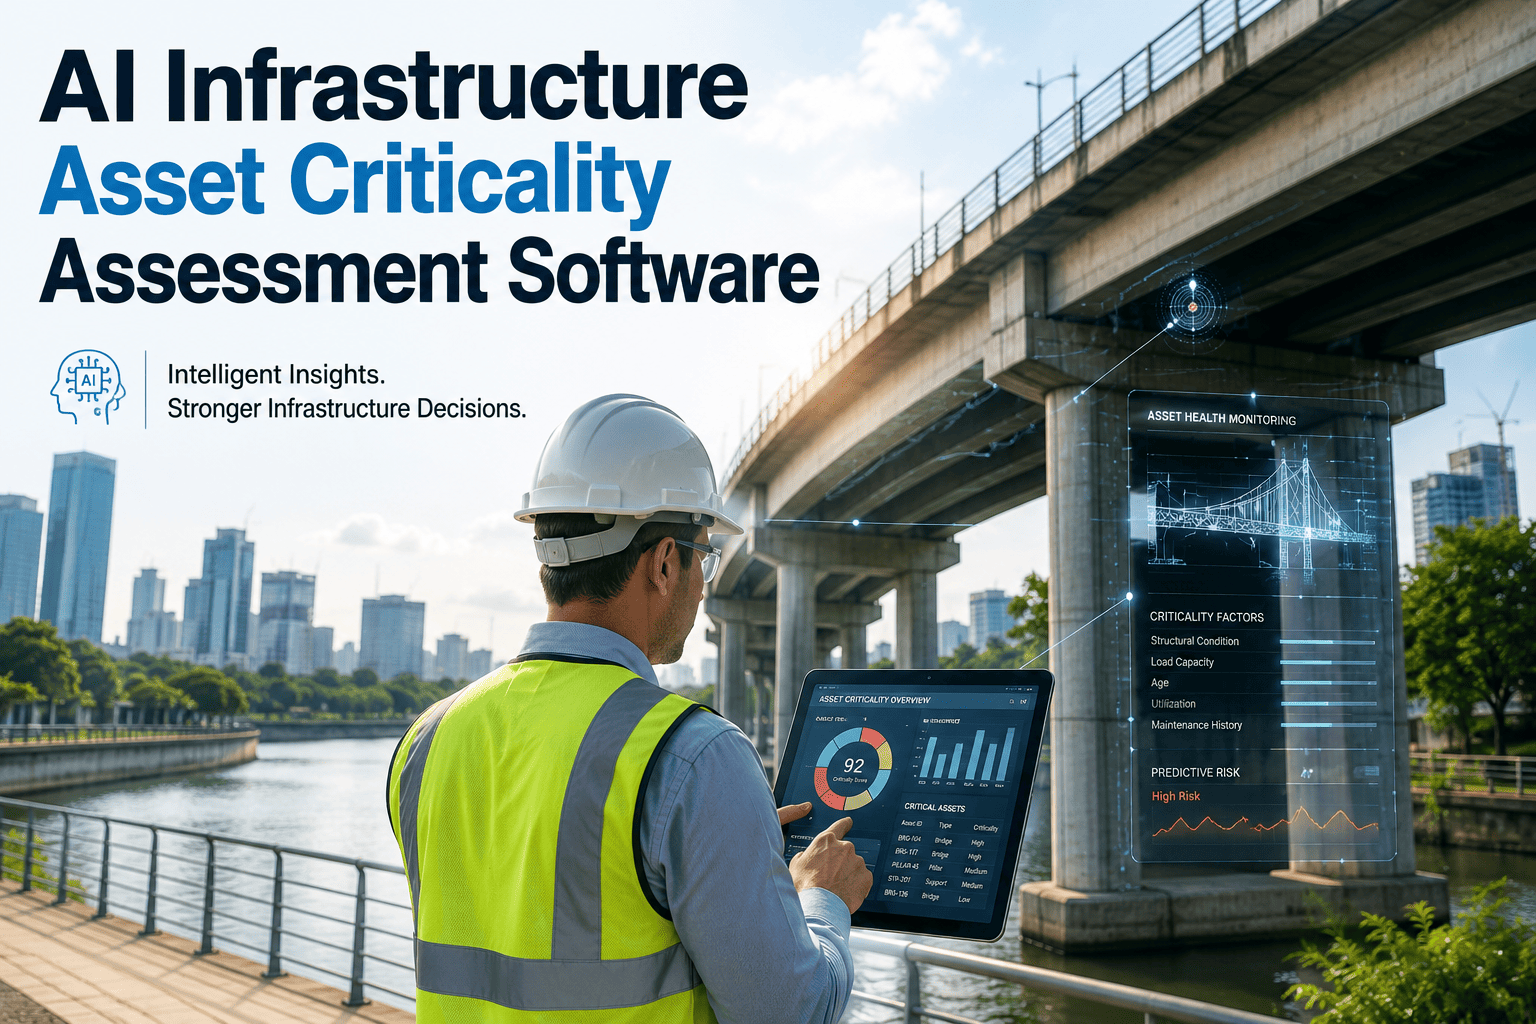
Every score on that screen is explainable, not a black box. A supervisor can click into any ranking and see exactly which factors, condition trend, consequence, redundancy, pushed that asset to its position, which matters when a priority call needs to be defended to a plant manager or a budget committee later.
What Changes Once Prioritization Becomes Data-Driven
These outcomes reflect what maintenance and reliability teams consistently report after replacing informal or purely time-based prioritization with continuous, data-driven risk scoring.
Two Ways to Decide What Gets Fixed First
Time-based maintenance schedules everything on a fixed calendar regardless of actual condition. Risk-based prioritization schedules effort according to what the data says is actually likely to fail and actually matters if it does. The difference shows up directly in where crew hours end up going.
| Factor | Time-Based Scheduling | iFactory Risk-Based Prioritization |
|---|---|---|
| Basis for Priority | Fixed calendar interval regardless of actual condition | Live condition, likelihood, and consequence combined into one score |
| Response to New Risk | Waits for the next scheduled review to notice a change | Score updates automatically as new data arrives |
| Resource Allocation | Similar effort applied across critical and non-critical assets alike | Effort concentrated on the tier that carries the most risk |
| Defensibility | Hard to justify why one job jumped the queue over another | Every ranking traceable to specific scoring factors |
| Budget Conversations | Requests justified asset by asset, case by case | A ranked list makes the top-risk group self-evident |
Any Team Deciding What Gets Fixed First
Risk scoring earns its place wherever a maintenance or reliability team has more work than hours and needs a defensible way to choose. That shows up differently across industries, but the underlying decision is always the same.
Questions Maintenance and Reliability Teams Ask First
Turn Your Work Order Backlog Into a Ranked, Defensible Queue
iFactory scores and ranks every asset by condition, likelihood, and consequence, so your team always starts the day knowing exactly what matters most. Book a demo and see your own asset list ranked live.