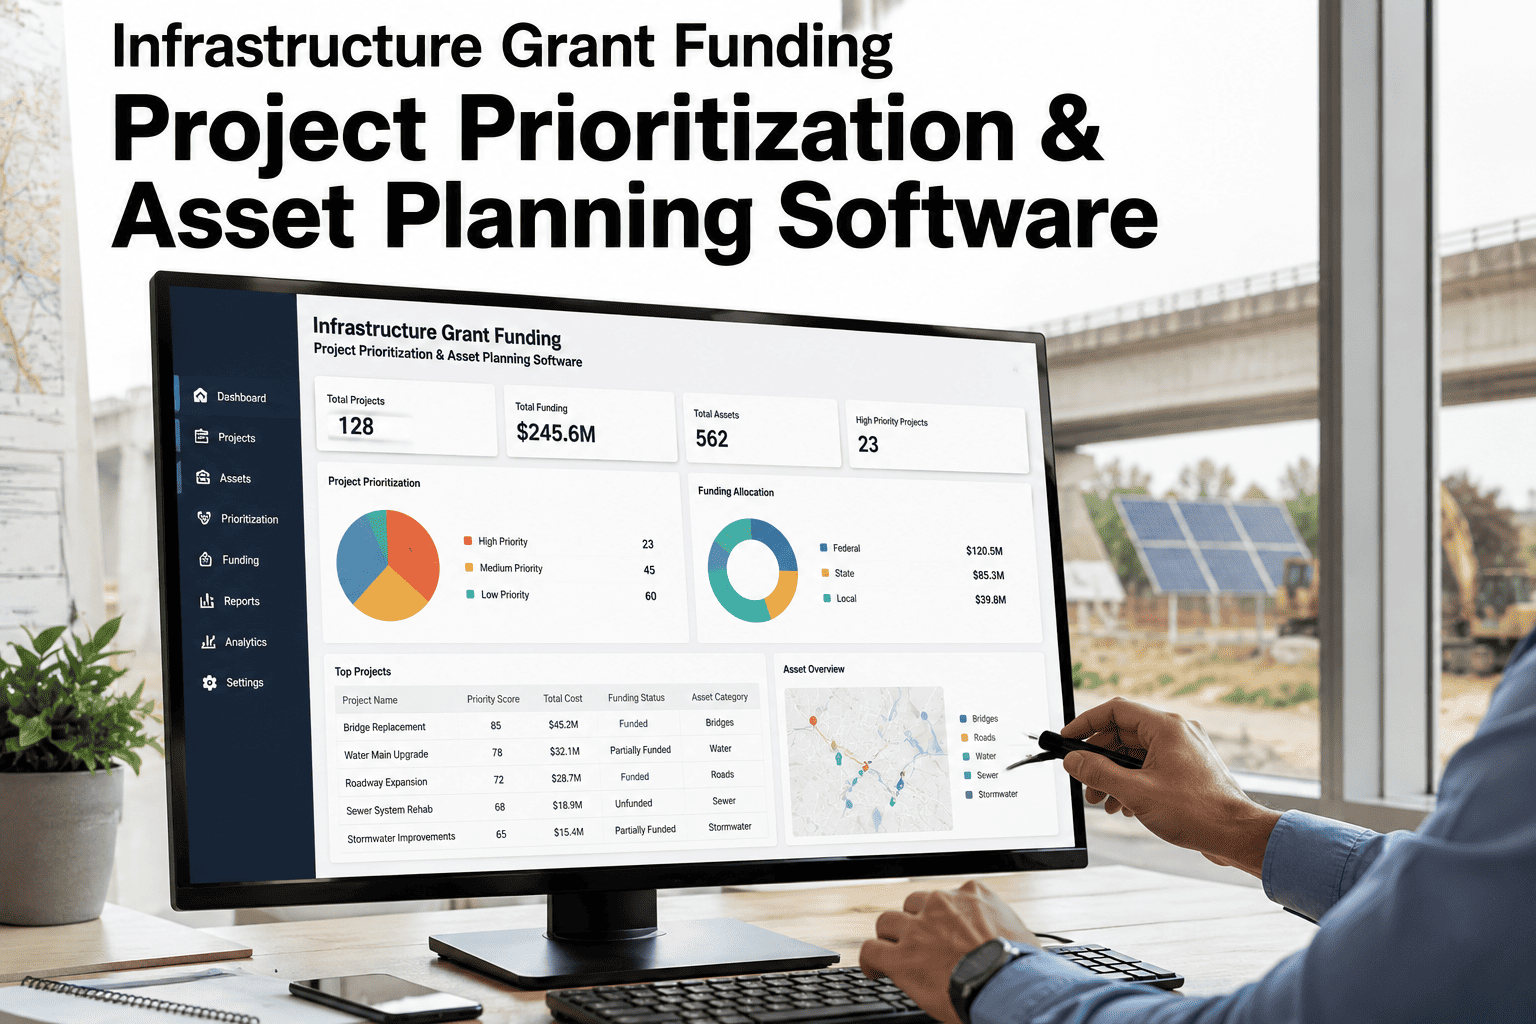
Infrastructure grant programs have never distributed more money, but the gap between available funding and demonstrated project readiness has never been wider for most municipalities and utilities. Federal and state agencies increasingly require evidence-based prioritization supported by condition data, risk assessment, lifecycle cost analysis, and measurable public impact metrics to award competitive grants. Yet most organizations still prioritize projects through informal processes, spreadsheet rankings, or political negotiation rather than defensible scoring frameworks that hold up under grant review scrutiny. The result is that well-prepared applicants with strong data foundations consistently win funding over organizations with equally legitimate needs but weaker evidence packages. iFactory transforms scattered asset data into grant-ready project prioritization with automated scoring and evidence generation.
GRANT FUNDING · PROJECT PRIORITIZATION · CAPITAL PLANNING
Score, Rank, and Justify Infrastructure Projects with Evidence Grant Reviewers Expect
Move from subjective project lists to defensible, data-driven prioritization that demonstrates exactly why each project deserves funding over the alternatives.
$4.6T
Estimated U.S. Infrastructure Need
$550B
Competitive Grant Funding Available
Only projects backed by condition evidence, risk analysis, and lifecycle cost data bridge this gap
THE GRANT FUNDING REALITY
Why Most Infrastructure Grant Applications Fail Before Review
The infrastructure funding landscape has fundamentally shifted over the past several years. Programs like the IIJA, EPA grant programs, DOT discretionary grants, and state-level revolving funds now explicitly score applications on evidence quality, not just project need. Reviewers evaluate whether an applicant can demonstrate that their prioritization process is systematic, repeatable, and grounded in quantitative data rather than subjective judgment. Organizations that submit project lists ranked by urgency claims without supporting condition data, risk matrices, or lifecycle cost comparisons routinely score below better-documented competitors even when their infrastructure is in worse condition. The funding does not go to the most needy communities. It goes to the most prepared applicants.
Projects with evidence-based prioritization
78% award rate
Projects with subjective priority lists
23% award rate
SCORING FRAMEWORK
Five Dimensions That Determine Grant Competitiveness
Grant reviewers consistently evaluate projects across a common set of dimensions that reflect both the technical merit of the project and the organizational capacity to deliver it. iFactory structures project prioritization around these five weighted dimensions, pulling data from existing monitoring systems, asset databases, and maintenance records to generate scores that align with how funding agencies actually evaluate applications.
30%
Condition Evidence
Current physical condition data from inspections, sensors, or monitoring systems that quantifies asset deterioration and remaining useful life.
25%
Risk and Criticality
Consequence of failure assessment including safety risk, service disruption severity, environmental exposure, and dependency on other infrastructure systems.
20%
Lifecycle Cost Effectiveness
Total cost of ownership comparison between repair, rehabilitation, and replacement options over the full projected asset lifecycle.
15%
Public Impact and Equity
Measurable benefits to served populations, environmental justice considerations, and alignment with community development priorities.
10%
Funding Leverage
Readiness to proceed, matching fund availability, permitting status, and ability to demonstrate previous successful project delivery.
SCORING IN ACTION
How a Sample Project Scores Across All Five Dimensions
The following example shows how iFactory calculates a composite project score by evaluating each dimension independently and then applying the weighting framework. Each dimension score is derived from actual data sources rather than subjective estimates, which means the score is defensible when questioned by grant reviewers and can be regenerated at any time if underlying data changes.
Condition Evidence
88/100
Risk and Criticality
72/100
Lifecycle Cost Effectiveness
81/100
Public Impact and Equity
65/100
Weighted Composite Score
79.1
FUNDING READINESS
Assess Whether Your Project Can Survive Grant Review
Before investing weeks in a grant application, organizations need an honest assessment of whether their underlying data and documentation can support a competitive submission. iFactory evaluates funding readiness across six critical categories and identifies specific gaps that will reduce your scoring potential if left unaddressed. This assessment takes minutes rather than the days typically spent manually reviewing application requirements against available documentation.
Ready
Asset Condition Data
Current condition ratings or inspection results are available for all assets in the project scope, sourced from recent assessments or continuous monitoring.
Partial
Risk Assessment Documentation
Consequence of failure has been qualitatively described but not formally scored using a consistent risk matrix across all project assets.
Gap
Lifecycle Cost Models
Replacement cost estimates exist but do not include rehabilitation alternatives, residual life calculations, or annual operating cost projections.
Ready
Public Impact Metrics
Served population counts, service disruption estimates, and environmental justice screening results are documented for the project area.
Partial
Environmental Review Status
Preliminary environmental review has been initiated but categorical exclusion determination or environmental assessment has not been completed.
Gap
Matching Fund Commitment
Potential matching fund sources have been identified but no formal commitment letters or budget appropriations have been secured.
See How Your Projects Score Against Grant Criteria
iFactory maps your existing asset data to the five scoring dimensions and shows you exactly where your grant applications are strong and where evidence gaps will cost you points.
FROM DATA TO DECISION
The Path from Scattered Assets to Funded Projects
Building a grant-competitive project prioritization process does not require starting from scratch. Most organizations already hold the raw data needed across various departments, systems, and files. The challenge is aggregating it into a structured scoring framework that generates defensible rankings. iFactory automates this aggregation and scoring process while maintaining full traceability from each project score back to its underlying data sources.
01
Aggregate Asset Data
Pull condition, age, maintenance history, and operational data from existing systems into a unified asset registry.
02
Score Each Dimension
Apply the five-dimension scoring framework to each candidate project using the aggregated data as evidence inputs.
03
Rank and Compare
Generate weighted composite scores and rank projects with full visibility into how each dimension contributed to the final ranking.
04
Model Scenarios
Test how different funding levels, weight adjustments, or constraint scenarios change the optimal project portfolio selection.
05
Generate Evidence
Export grant-ready documentation that traces each score directly to its supporting data source for reviewer verification.
GRANT EVIDENCE PACKAGE
What Reviewers Actually Look for in Your Application
Grant review teams evaluate applications against published scoring criteria, and the difference between funded and unfunded applications often comes down to whether the evidence package directly addresses each criterion with quantitative data rather than narrative claims. iFactory assembles the following components from your existing asset data, structured in the format that matches how reviewers score applications.
Condition Assessment Summary
Current condition ratings for all project assets with inspection dates, methodology descriptions, and deterioration trend data showing the rate of condition decline over recent assessment cycles.
Risk and Criticality Matrix
Formal consequence of failure scoring across safety, service, environmental, and financial impact dimensions with likelihood ratings and resulting risk priority numbers for each asset.
Lifecycle Cost Comparison
Side-by-side cost analysis of do-nothing, repair, rehabilitate, and replace alternatives including capital costs, projected annual maintenance, and total cost of ownership over the asset lifecycle.
Public Benefit Quantification
Population served, projected service reliability improvements, environmental benefit estimates, and environmental justice screening results mapped to the project geographic area.
Project Readiness Documentation
Permitting status, environmental review completion, matching fund commitment letters, prior project delivery track record, and implementation timeline with key milestones.
FUNDING SOURCE ALIGNMENT
Match Your Top Projects to the Right Grant Programs
Different grant programs weight scoring dimensions differently based on their statutory priorities. A DOT discretionary grant may heavily weight safety and criticality while an EPA program prioritizes environmental outcomes and environmental justice. iFactory allows you to apply multiple weighting profiles to the same project set, instantly showing how your project rankings shift depending on which program you are targeting. This prevents the common mistake of submitting a project scored for one program to a different program with different priorities.
| Grant Program Type |
Condition Weight |
Risk Weight |
Lifecycle Weight |
Equity Weight |
Readiness Weight |
| DOT Discretionary Grants |
25% |
30% |
20% |
10% |
15% |
| EPA Water Infrastructure |
20% |
15% |
25% |
25% |
15% |
| Energy Efficiency Grants |
15% |
10% |
35% |
20% |
20% |
| Broadband Infrastructure |
10% |
15% |
20% |
35% |
20% |
| State Revolving Funds |
30% |
20% |
25% |
5% |
20% |
FREQUENTLY ASKED QUESTIONS
Questions Grant Managers and Capital Planners Ask First
Can iFactory work with the asset data we already have, or do we need a new inventory first?
iFactory is designed to work with whatever asset data you currently have, regardless of format, completeness, or source system. The scoring framework is built to accommodate varying data quality levels by weighting scores based on evidence strength rather than requiring perfect data before any analysis can begin. If your water department has condition data but your roads department does not, the system will score water projects with full evidence weight and flag road projects as having data gaps that should be addressed before applying. This means you can start prioritizing and identifying your strongest grant candidates immediately while simultaneously building a roadmap to improve data coverage for future funding cycles.
Book a demo to see how your existing data maps to the scoring framework.
How is the weighting different from just putting projects in a spreadsheet and sorting?
A spreadsheet ranking requires manual data entry for each scoring dimension, which means every time you add a project, update a condition rating, or adjust a cost estimate, you must manually recalculate scores and re-sort the list. More importantly, spreadsheet-based rankings cannot trace each score back to its source data, which means when a grant reviewer asks why a project scored 85 on condition evidence, you cannot immediately produce the inspection reports and monitoring data that generated that score. iFactory maintains a live link between scores and source data, so rankings update automatically as new information becomes available and every score is fully auditable back to its evidence basis.
Contact our support team to discuss the differences in practice.
Can we adjust the scoring weights to match a specific grant program's criteria?
Yes, the five-dimension scoring framework is fully configurable, and you can create and save multiple weighting profiles that correspond to different grant programs or internal prioritization requirements. When you switch between profiles, all project rankings recalculate instantly so you can immediately see which projects rise to the top under each program's specific criteria. This is particularly valuable when you are deciding which projects to submit to which programs, since a project that ranks third under a DOT weighting may rank first under an EPA weighting based on the same underlying data. You can also adjust the underlying scoring rubric within each dimension, not just the dimension weights, to match the specific evaluation language used in a particular grant application guidance.
Book a demo to see multi-profile scoring in action.
How long does it take to get from our current data to a scored project list?
For organizations with existing asset databases, condition assessment records, and maintenance history in digital formats, the initial scoring setup typically takes two to four weeks depending on the number of data sources that need to be connected and the complexity of the asset taxonomy. Projects with sufficient data in at least three of the five scoring dimensions can be scored immediately, while projects with significant data gaps are flagged with specific remediation actions needed before they can be competitively scored. The key point is that you do not need to wait until every project has perfect data across all five dimensions before you can start identifying your strongest grant candidates and building applications around them.
Contact our support team to discuss a timeline based on your specific data situation.
Does this replace our existing capital improvement planning process or integrate with it?
iFactory is designed to integrate with and enhance your existing capital improvement planning process rather than replace it. The scoring framework can be calibrated to align with your current prioritization criteria, and the output can be formatted to match the structure your leadership and governing body already expect for capital plan review. What changes is not your process but the speed, consistency, and defensibility of the analysis that feeds into it. Instead of spending weeks assembling data for each planning cycle, your team reviews pre-scored rankings with full evidence traceability and can immediately generate the documentation needed for governing body presentations, grant applications, or public engagement sessions from the same underlying dataset.
Book a demo to see how it fits your current planning workflow.
Stop Losing Grant Funding to Better-Prepared Competitors
Your infrastructure needs are real. The difference between funded and unfunded is not the need itself but the evidence supporting it. iFactory turns your asset data into the scoring framework grant reviewers actually use.