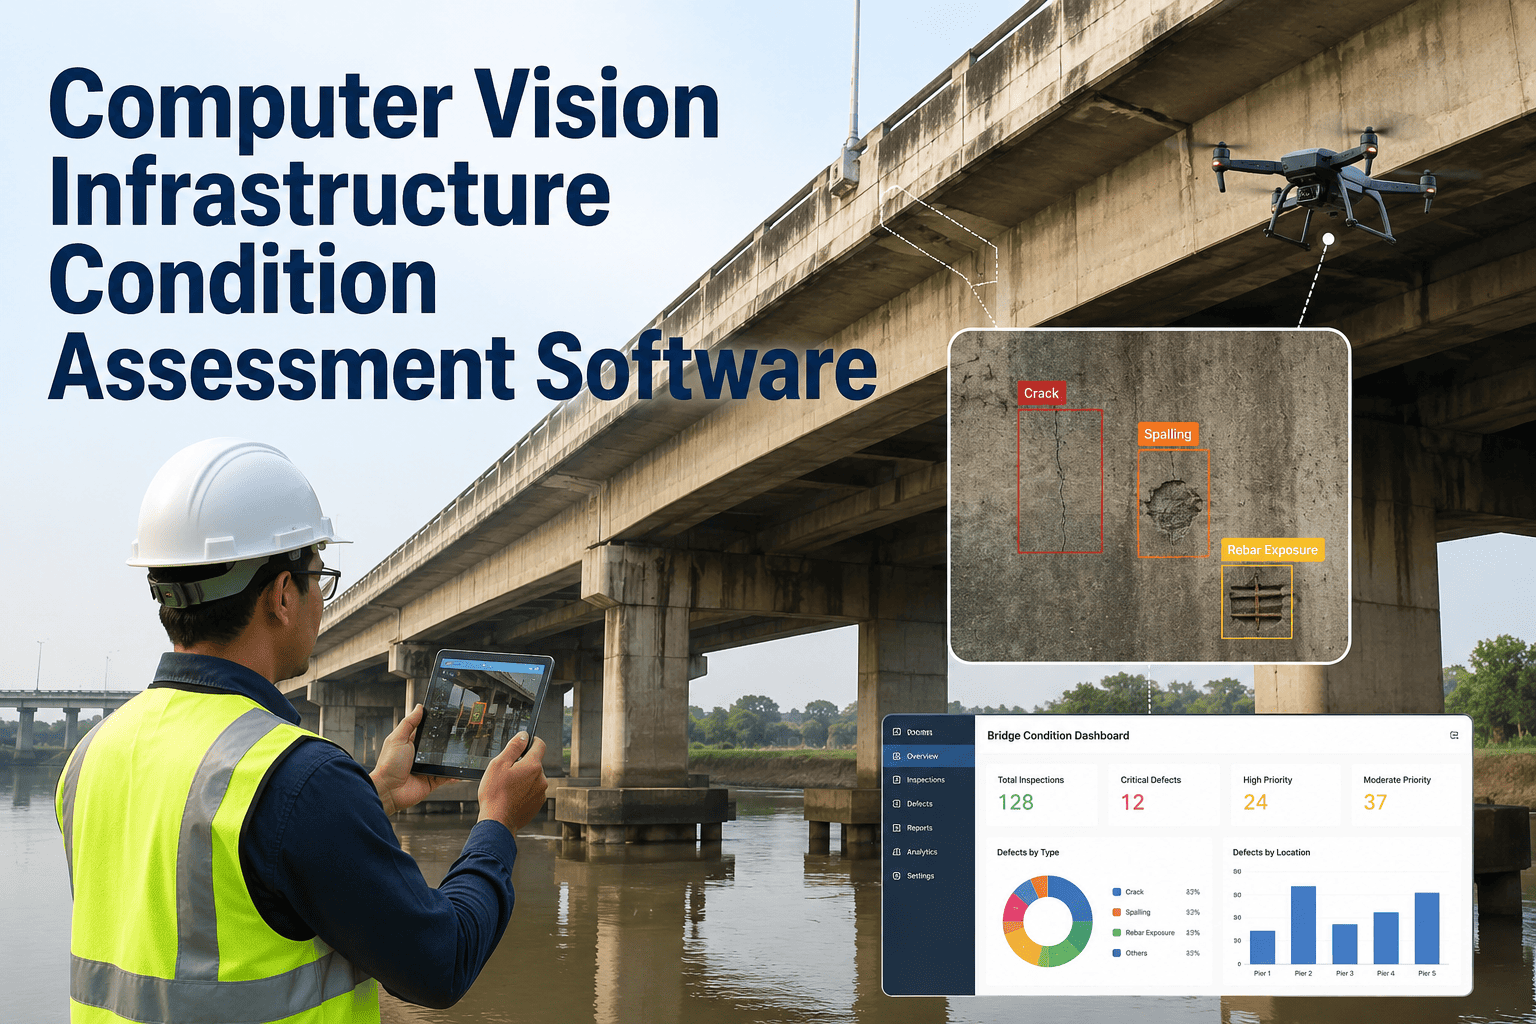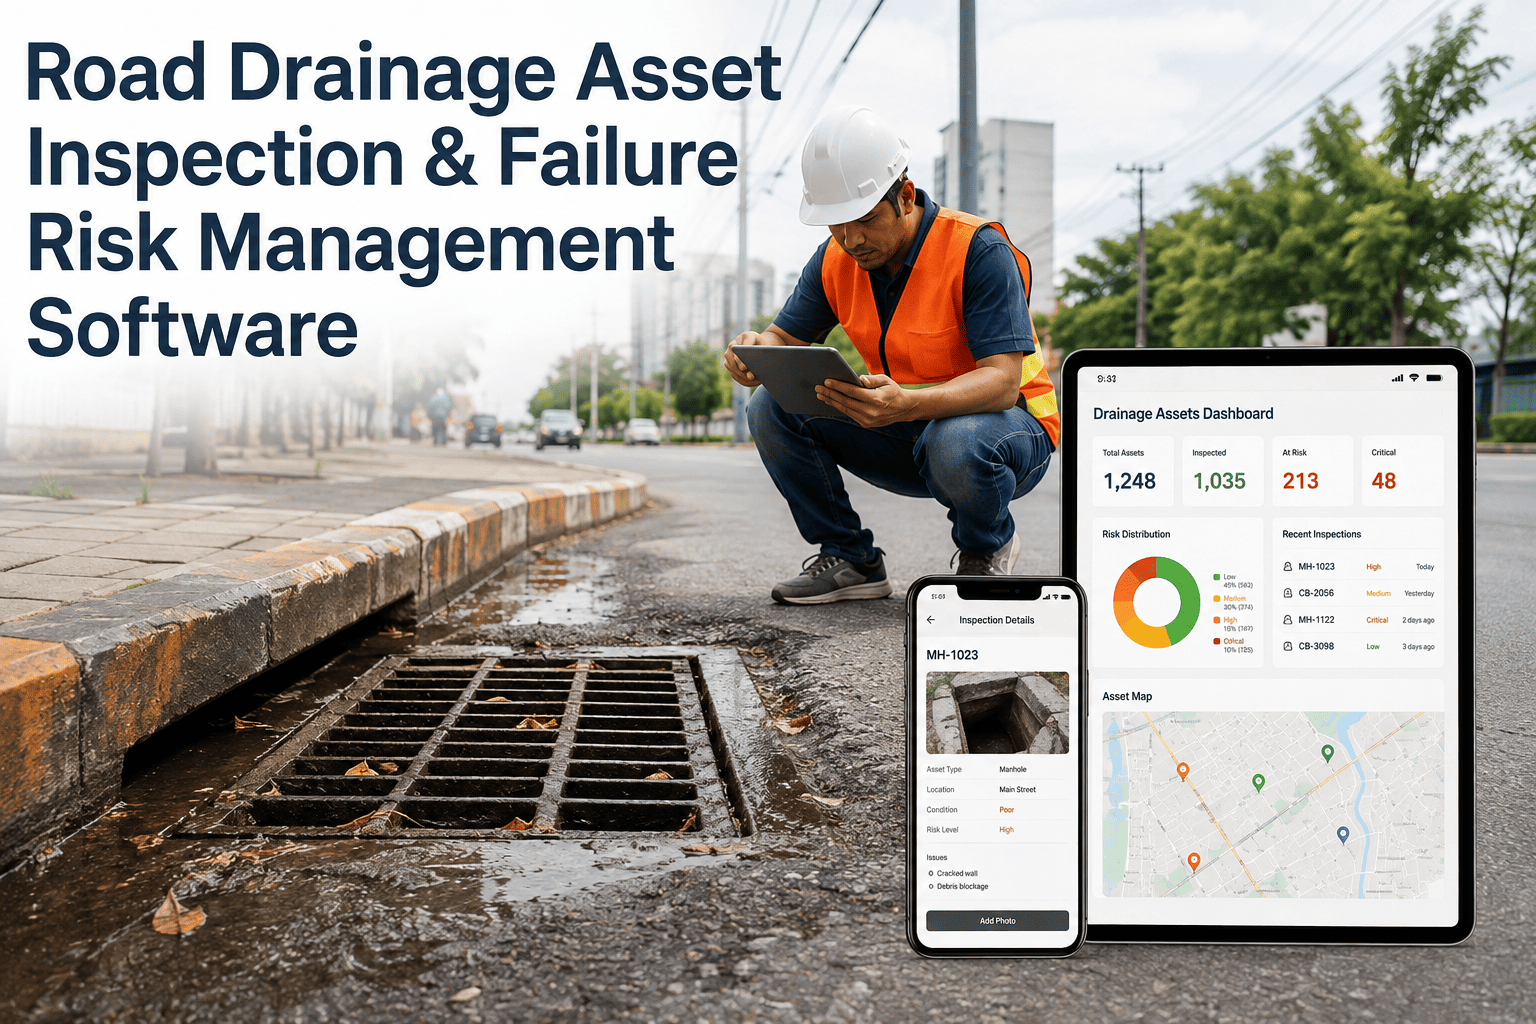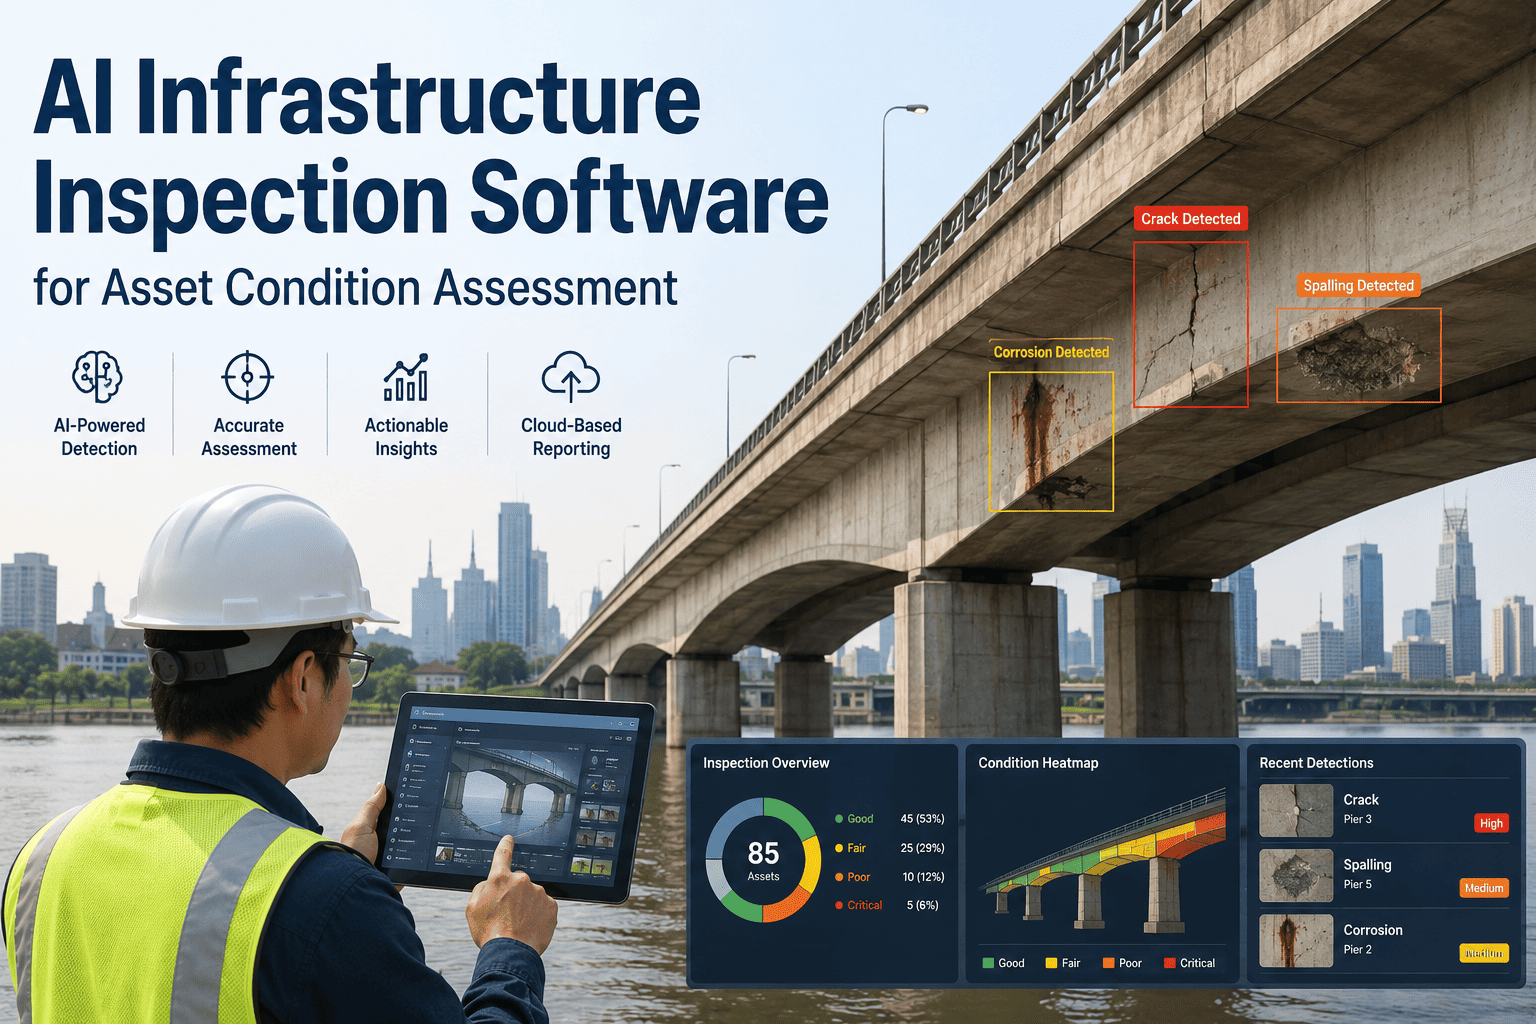
A bridge inspector climbs down to the same pier abutment she has photographed eleven times this year, writes the same notes on a clipboard, and files a PDF that nobody cross-references against last year's PDF. Three counties over, a water utility is still deciding which of four hundred miles of pipe to dig up first, using a spreadsheet that was last updated by someone who retired. This is what infrastructure condition assessment looks like at most agencies and industrial operators today, and it is the reason small defects turn into six and seven-figure emergencies. iFactory's AI infrastructure inspection software replaces the clipboard and the guesswork with a consistent, defensible condition score for every asset, and you can book a demo to see it score your own asset photos.
Every Asset Deserves a Condition Score, Not a Guess
iFactory's AI infrastructure inspection software turns photos, drone footage, and sensor readings into a consistent condition score for every bridge, road segment, pipeline, tower, and facility you manage, so budget decisions are backed by data instead of whoever inspected it last and how tired they were that day.
Deferred Maintenance Is Not a Line Item, It Is a Compounding Debt
Most infrastructure owners are not short on inspection data, they are short on a consistent way to compare it. One inspector rates a pier "fair," another rates a nearly identical pier "good," and neither rating gets revisited until the next scheduled cycle, which can be a year or more away. Meanwhile the deterioration curve for concrete, steel, and asphalt does not wait for the calendar. A hairline crack ignored for eighteen months becomes a structural repair; a road segment left off the resurfacing list for one more budget cycle becomes a full reconstruction. The gap between what the asset is actually doing and what the last report says it is doing is where most emergency spending comes from.
None of this is a funding story alone. Agencies with adequate budgets still lose money to inconsistent inspection data, because dollars get allocated to the assets that were inspected most recently or reported most loudly, not necessarily the ones deteriorating fastest. A capital plan built on subjective ratings is also harder to defend when it gets questioned by a budget committee, an auditor, or the public after an incident, because there is no consistent trail showing why one asset was prioritized over another. Objective, repeatable scoring is what turns a maintenance backlog from a guessing game into a ranked, defensible plan, one that holds up whether the person reviewing it is an engineer, a finance director, or a state auditor two years from now.
From Raw Field Data to a Ranked Action List in Four Stages
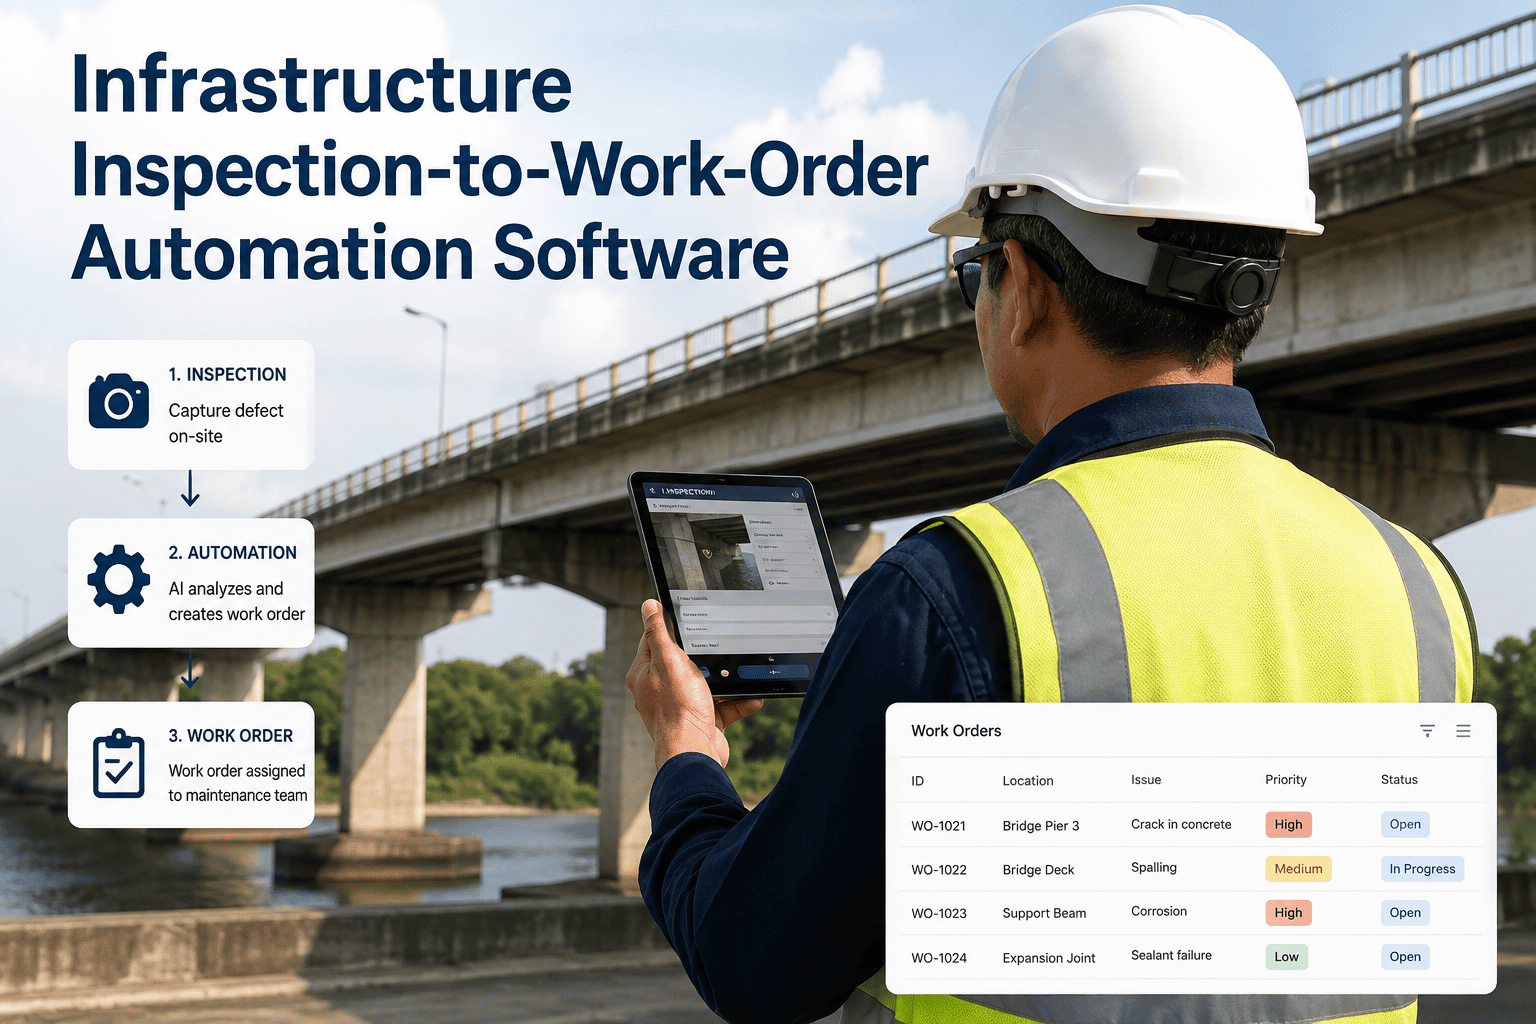
iFactory does not ask your team to change how they collect field data. Photos from a phone, footage from a drone flyover, thermal images, or continuous sensor feeds all become inputs the same underlying model can read. What changes is what happens after the data is captured.
The result is that a technician who has been on the job for three weeks flags the same defects the same way a twenty-year veteran would, because the scoring model does not have good days or bad days. That consistency is what makes year-over-year comparisons meaningful instead of noise.
What the Model Is Actually Trained to See
Condition assessment is only as useful as the defect vocabulary behind it. iFactory's detection models are trained across the specific failure modes that actually drive infrastructure risk, organized by asset class so the scoring logic reflects how each type of structure really fails.
Stop Ranking Repairs by Whoever Complained Loudest
iFactory scores every asset the same way, every time, so your maintenance budget goes to the infrastructure that is actually deteriorating fastest instead of the one that got inspected most recently. Book a demo and score a sample of your own inspection photos live.
Not Every Bad Score Needs the Same Response Speed
A low condition score on a low-traffic culvert is not the same emergency as a low condition score on a bridge deck carrying twenty thousand vehicles a day. iFactory combines the condition score with consequence factors, traffic or throughput volume, redundancy, criticality to operations, so the same defect severity produces different priority levels depending on what happens if that asset actually fails.
This is the difference between a system that generates a long undifferentiated list of defects and one that generates a ranked work plan. Field teams stop wading through hundreds of flagged items to find the handful that actually matter this quarter, because the platform has already done that sorting using consistent, documented logic that holds up when a budget decision gets questioned later.
What Changes Once Scoring Becomes Automatic
These figures reflect what infrastructure owners consistently report once AI-assisted condition assessment replaces manual, paper-based rating for a meaningful share of their asset inventory, comparing the year before adoption to the year after. The gains tend to compound over time rather than arrive all at once, since each additional inspection cycle adds another data point to the trend line, making it easier to catch a defect accelerating early rather than after it has already crossed into urgent territory.
Manual Rating and AI-Assisted Assessment, Side by Side
It helps to be specific about what actually changes when AI enters the inspection workflow, because the value is not that the model replaces inspectors, it is that it removes the inconsistency and the paperwork drag around them.
| Factor | Manual Paper or PDF Rating | iFactory AI-Assisted Assessment |
|---|---|---|
| Consistency Across Inspectors | Varies by individual judgment and experience level | Same scoring logic applied to every asset, every time |
| Time to Findings | Days to weeks between site visit and a usable report | Condition score available shortly after upload |
| Historical Comparison | Requires manually pulling and comparing old PDFs | Automatic trend view across every past inspection cycle |
| Prioritization Method | Whoever inspected most recently or escalated loudest | Risk matrix combining severity and operational consequence |
| Audit and Funding Defense | Scattered files, difficult to reconstruct a clear history | Full documented history per asset, exportable on demand |
Built for the Teams Managing Assets They Cannot Afford to Lose
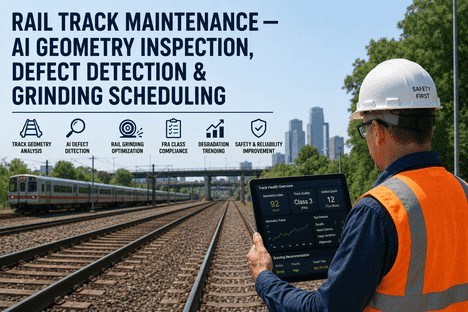
Condition assessment software earns its keep across a wide range of infrastructure owners, but the common thread is always the same, a large number of assets, a limited inspection budget, and a real cost when something fails without warning. Whether the asset in question is a two-lane rural bridge or a transmission tower feeding a regional grid, the underlying question is identical, which assets need attention now, and which ones can safely wait until the next budget cycle. A consistent scoring system answers that question the same way regardless of asset type, which is what lets very different teams share one platform.
A Rollout That Proves Value Before It Asks for Trust
Asset owners are rightly cautious about handing condition ratings over to a model they have not tested against their own structures. The teams that get the most value from AI-assisted assessment do not flip a switch across their entire inventory on day one, they prove the approach on a known group of assets first and expand once the scores line up with what their own engineers already believe to be true.
This phased approach also gives field crews time to adjust how they capture inspection data, since a small amount of coaching on photo angles, lighting, and coverage meaningfully improves how well the model can score what it sees. Most agencies find that after the first full inspection cycle, the model and the field team have effectively trained each other, the model improves from a larger and more consistent set of examples, and the crew learns exactly what kind of capture produces the clearest, fastest scoring.
What Asset Owners Ask Before Adopting AI Condition Assessment
Turn Your Inspection Photos Into a Ranked Action Plan
iFactory scores every asset in your inventory the same consistent way, flags the defects that matter most, and hands your team a prioritized, defensible plan instead of a folder of PDFs. Book a demo and see your own data scored in real time.