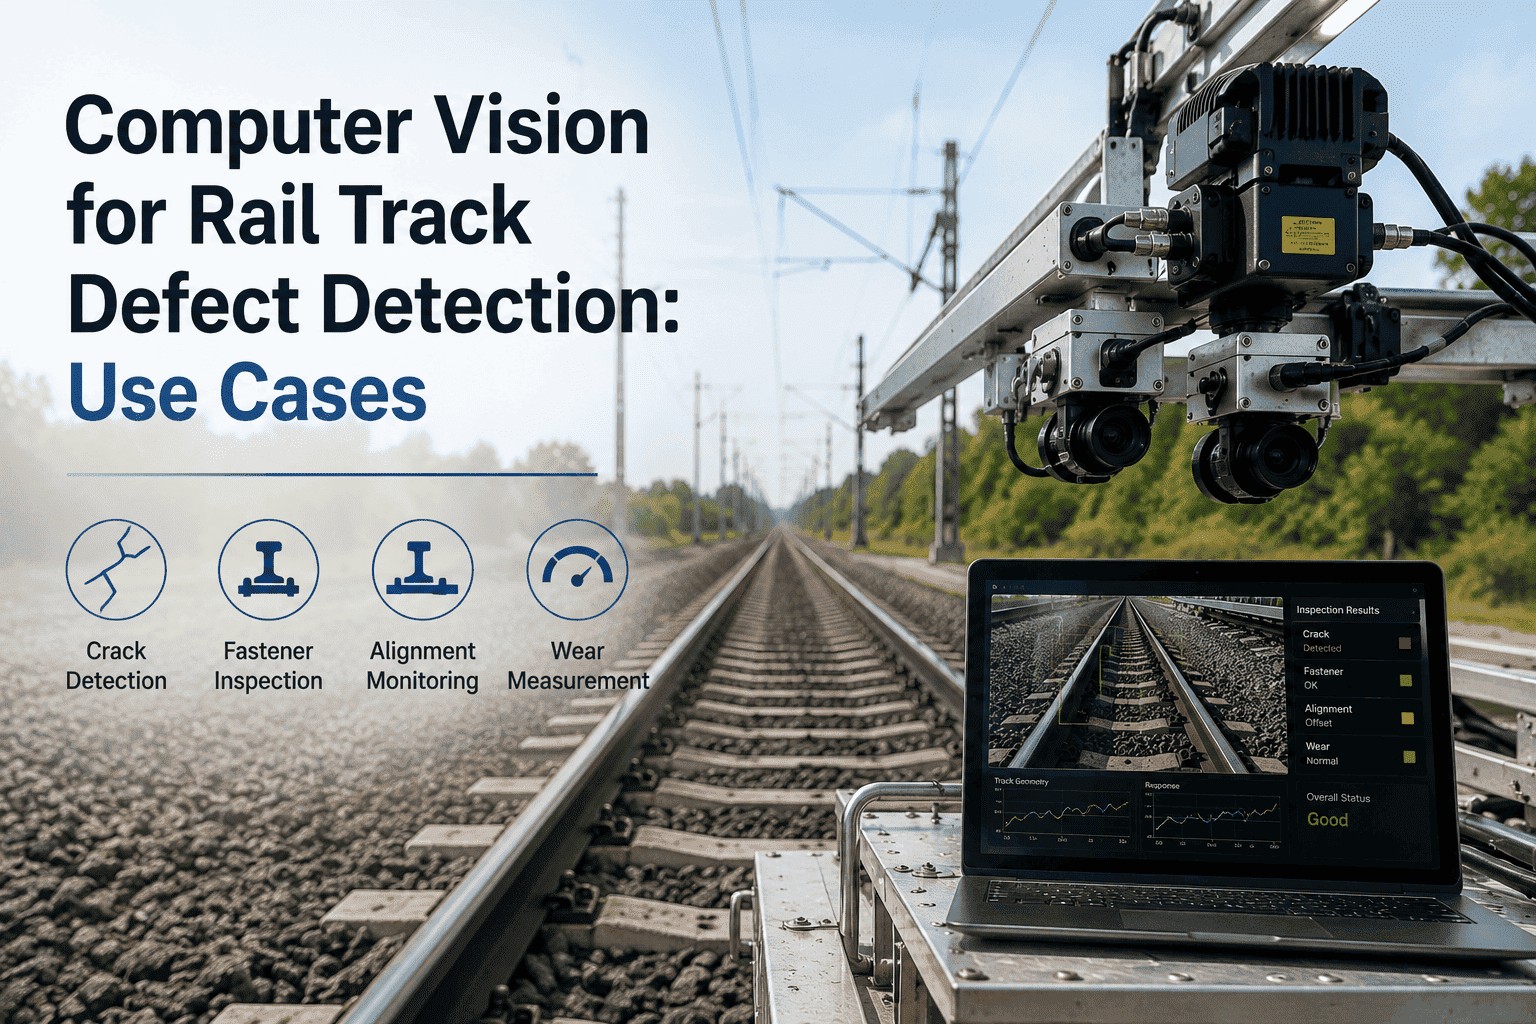
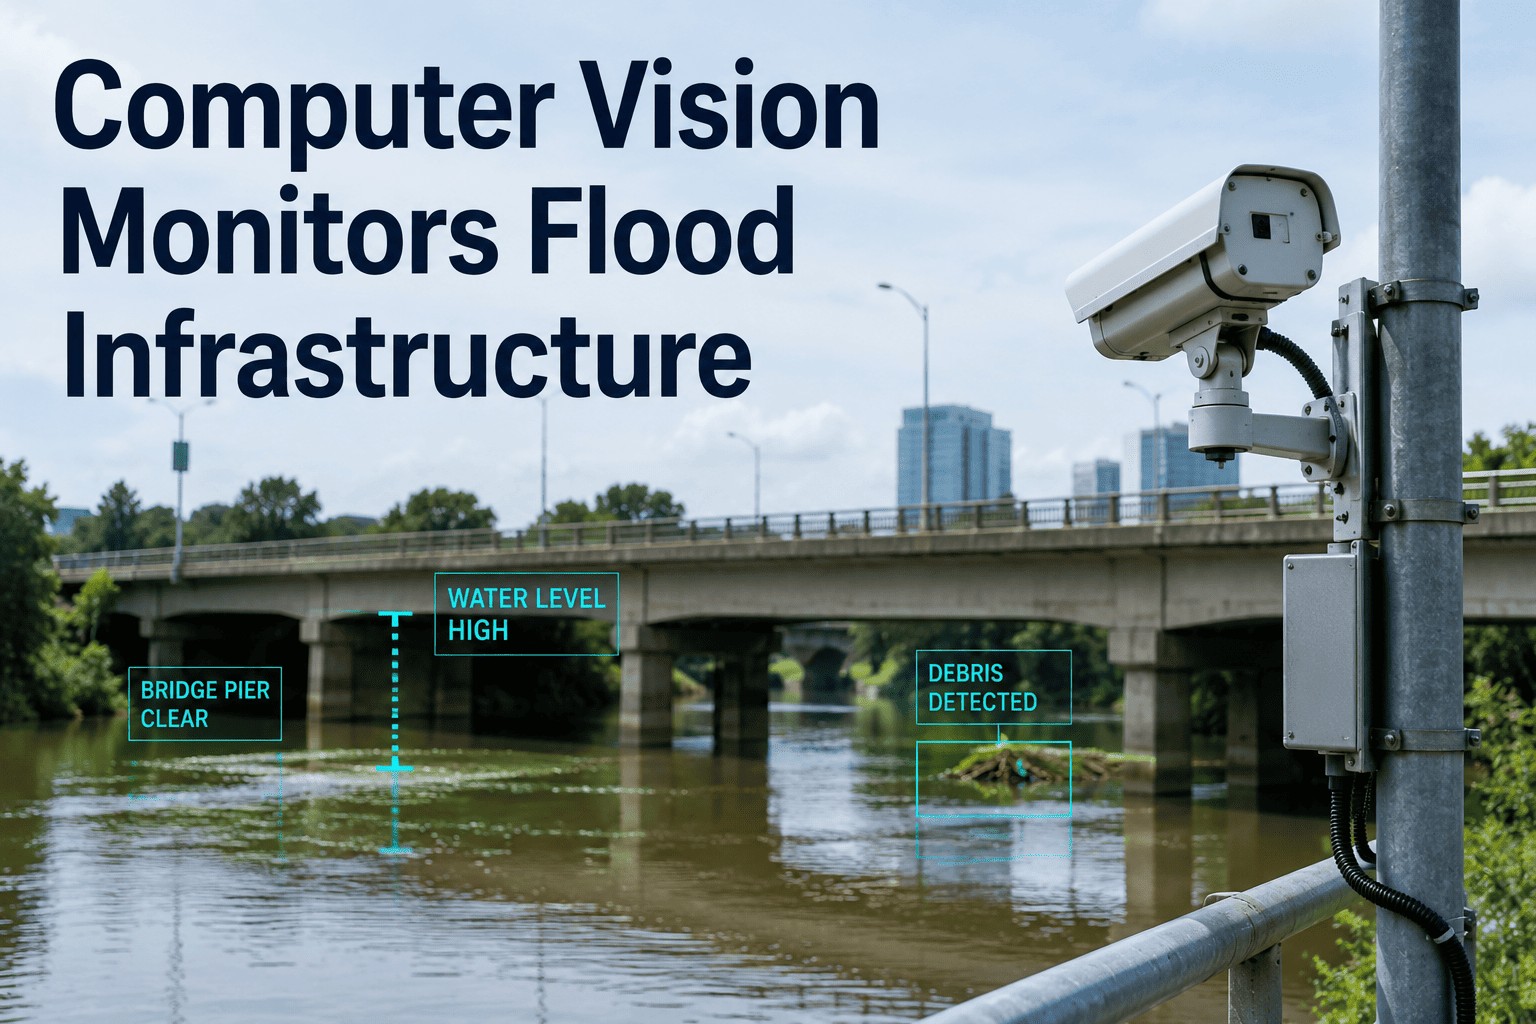
A bridge deck inspected eighteen months ago can develop a spreading crack network long before its next scheduled walk-through. A culvert lining can lose a third of its wall thickness to corrosion between two-year cycles. A pavement section can go from minor rutting to a pothole cluster in a single freeze-thaw season. Condition assessment built around a calendar rather than the asset's actual decay rate will always be looking at old information, and old information is exactly what leads agencies to miss the defect that becomes the failure. Computer vision from iFactory turns every inspection pass, fixed camera, or drone flight into a standardized, continuously updated condition record.
COMPUTER VISION — CONDITION ASSESSMENT
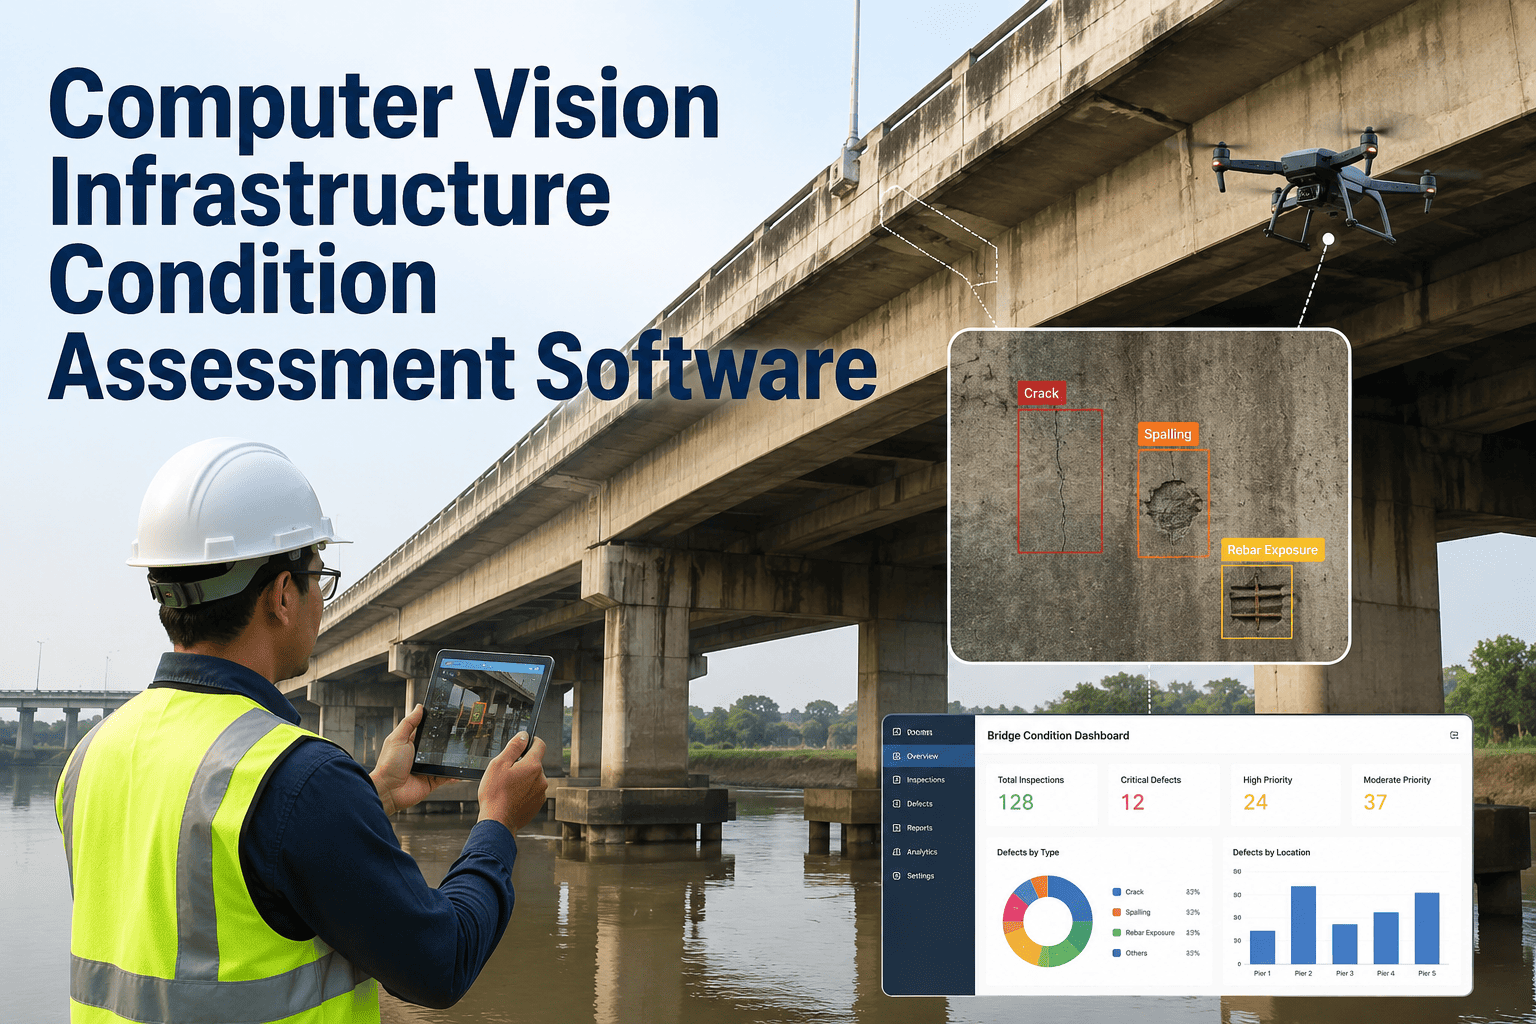
Computer Vision Infrastructure Condition Assessment Software
Automate infrastructure condition assessments with computer vision that scores cracks, corrosion, surface damage, and other visual defects the same way every time — on roads, bridges, pipelines, and facilities alike.
$2.45B
Size of the global infrastructure inspection market in 2026, growing near 9% a year
90%
Share of routine manual inspections that AI-driven visual assessment can reduce
$4.5K–$10K
Typical cost of a single routine bridge inspection performed manually
600K+
Bridges that U.S. departments of transportation must inspect on a two-year cycle alone
Why Manual Condition Surveys Can't Keep Pace
Trained inspectors are skilled, but they are also expensive, scarce, and inconsistent by the nature of human judgment. Two engineers looking at the same hairline crack can rate its severity differently, and the same engineer can rate it differently on a tired Friday afternoon versus a fresh Monday morning. Add in the physical risk of rope access, confined-space entry, and lane-closure traffic control, and it becomes clear why most networks are inspected far less often than their decay actually demands. Computer vision does not replace the engineer's judgment on borderline calls — it replaces the guesswork on when and how often every asset gets looked at in the first place.
| Assessment Dimension | Manual Visual Survey | Computer Vision Assessment |
|---|
| Inspection frequency | Fixed cycle, often 12–24 months | Continuous or on every capture pass |
| Coverage per asset | Sampled sections, accessible areas only | Full surface coverage from every frame captured |
| Scoring consistency | Varies by inspector, fatigue, and lighting | Same trained model criteria applied every time |
| Defect measurement | Estimated by eye or manual tape measurement | Pixel-calibrated length, width, and area |
| Documentation trail | Handwritten notes or delayed report entry | Time-stamped image, score, and location logged instantly |
| Cost per mile or asset | $100–$200 per mile for roadway surveys | Fraction of cost once cameras are deployed |
The Defect Signals Computer Vision Is Trained to Catch
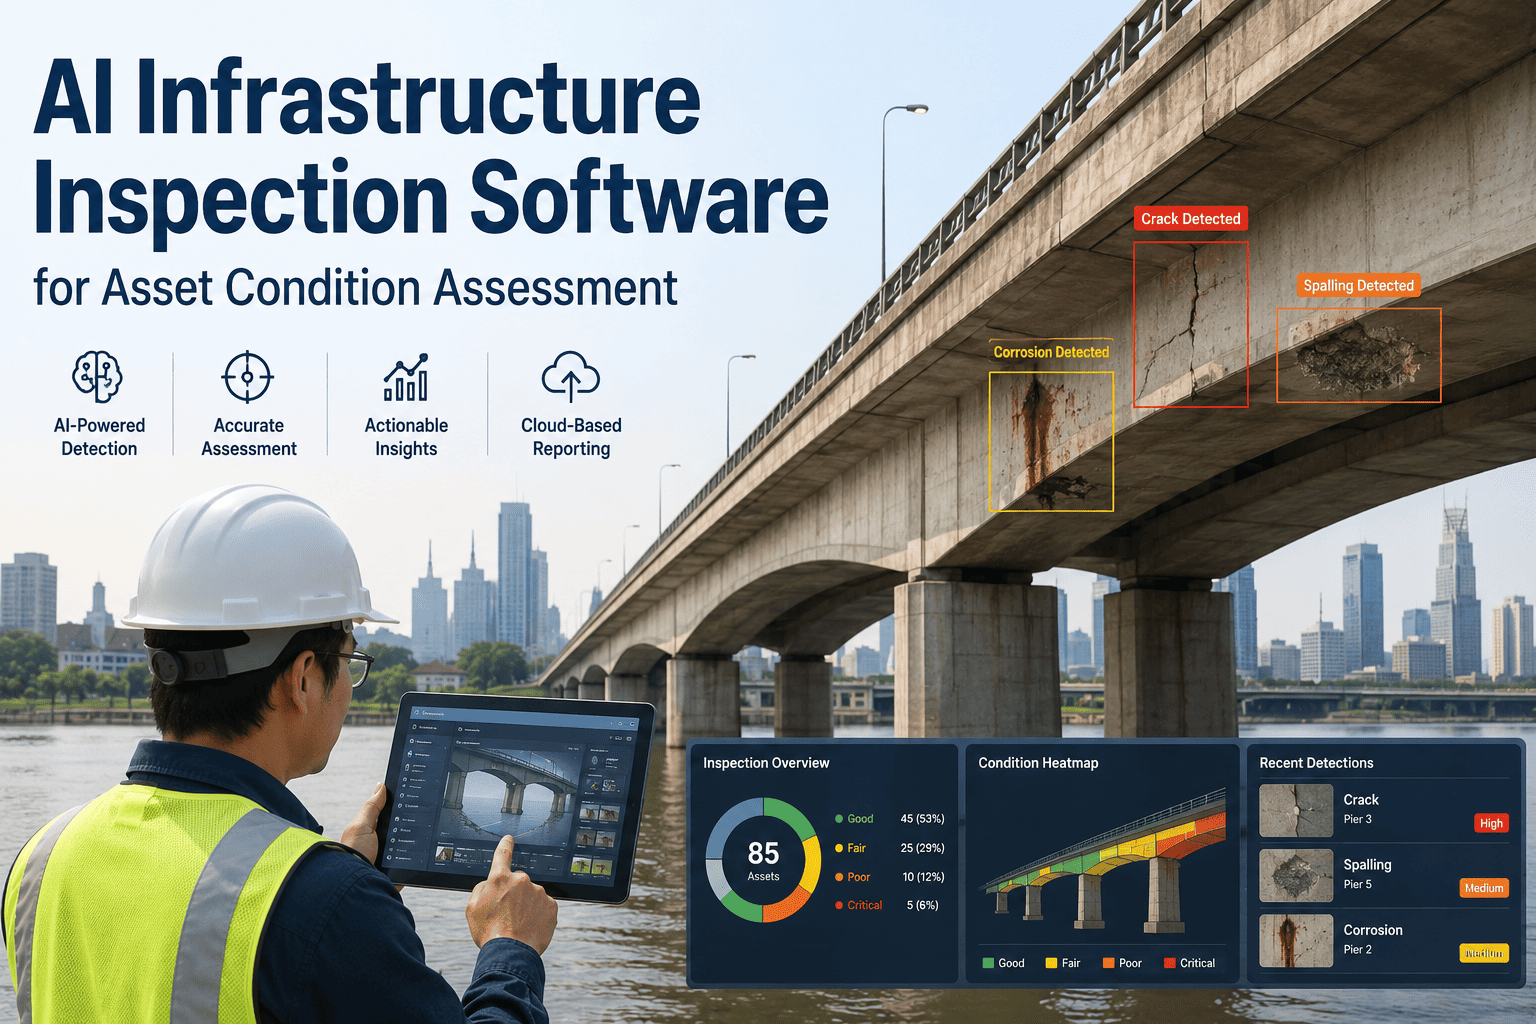
Every infrastructure material fails visually before it fails structurally, and each failure mode leaves its own distinct visual signature. iFactory's condition assessment models are trained on thousands of labeled examples of each defect type at every severity tier, so the system recognizes not just that something looks wrong but which specific failure mode is present and how far along it has progressed.
01
Cracking & Fracture Networks
Linear, alligator, and map cracking on pavement and concrete surfaces, measured for length, width, and propagation pattern to distinguish surface distress from structural cracking.
02
Corrosion & Oxidation
Rust staining, section loss on exposed steel, and oxidation on rebar breaking through concrete cover — tracked over time to establish a progression rate, not just a single snapshot.
03
Spalling & Delamination
Concrete surface loss, exposed aggregate, and subsurface delamination that shows up visually as hollow-sounding patches before a chunk of material actually falls away.
04
Surface Deformation
Rutting, heaving, settlement, and out-of-plane bowing on pavement, retaining walls, and slabs — geometric changes that a static photo often misses but a trained model quantifies.
05
Vegetation & Debris Encroachment
Root intrusion near foundations, vegetation masking drainage structures, and debris accumulation that both hides other defects and accelerates moisture-related decay.
06
Joint & Seal Failure
Expansion joint gaps, sealant cracking, and gasket degradation that let water into places it was never meant to reach, accelerating every other defect on this list.
Asset Classes — Where the Model Focuses
A model tuned for pavement distress will not perform well pointed at a steel bridge girder, and a bridge-tuned model will miss the specific patterns that matter on a buried pipeline. iFactory calibrates a distinct scoring model for each asset class in your portfolio, trained against your own imagery, your own materials mix, and your own historical defect records.
ROADS
Pavement & Roadway Surfaces
Continuous crack, rutting, and pothole-precursor detection from vehicle-mounted or drone imagery, scored against standard pavement condition index scales for direct comparison across the network.
BRIDGES
Bridges & Elevated Structures
Deck, girder, and bearing surface scoring for cracking, spalling, and corrosion — reducing the rope-access and lane-closure time needed for routine element-level condition rating.
PIPELINES
Pipelines & Buried Utilities
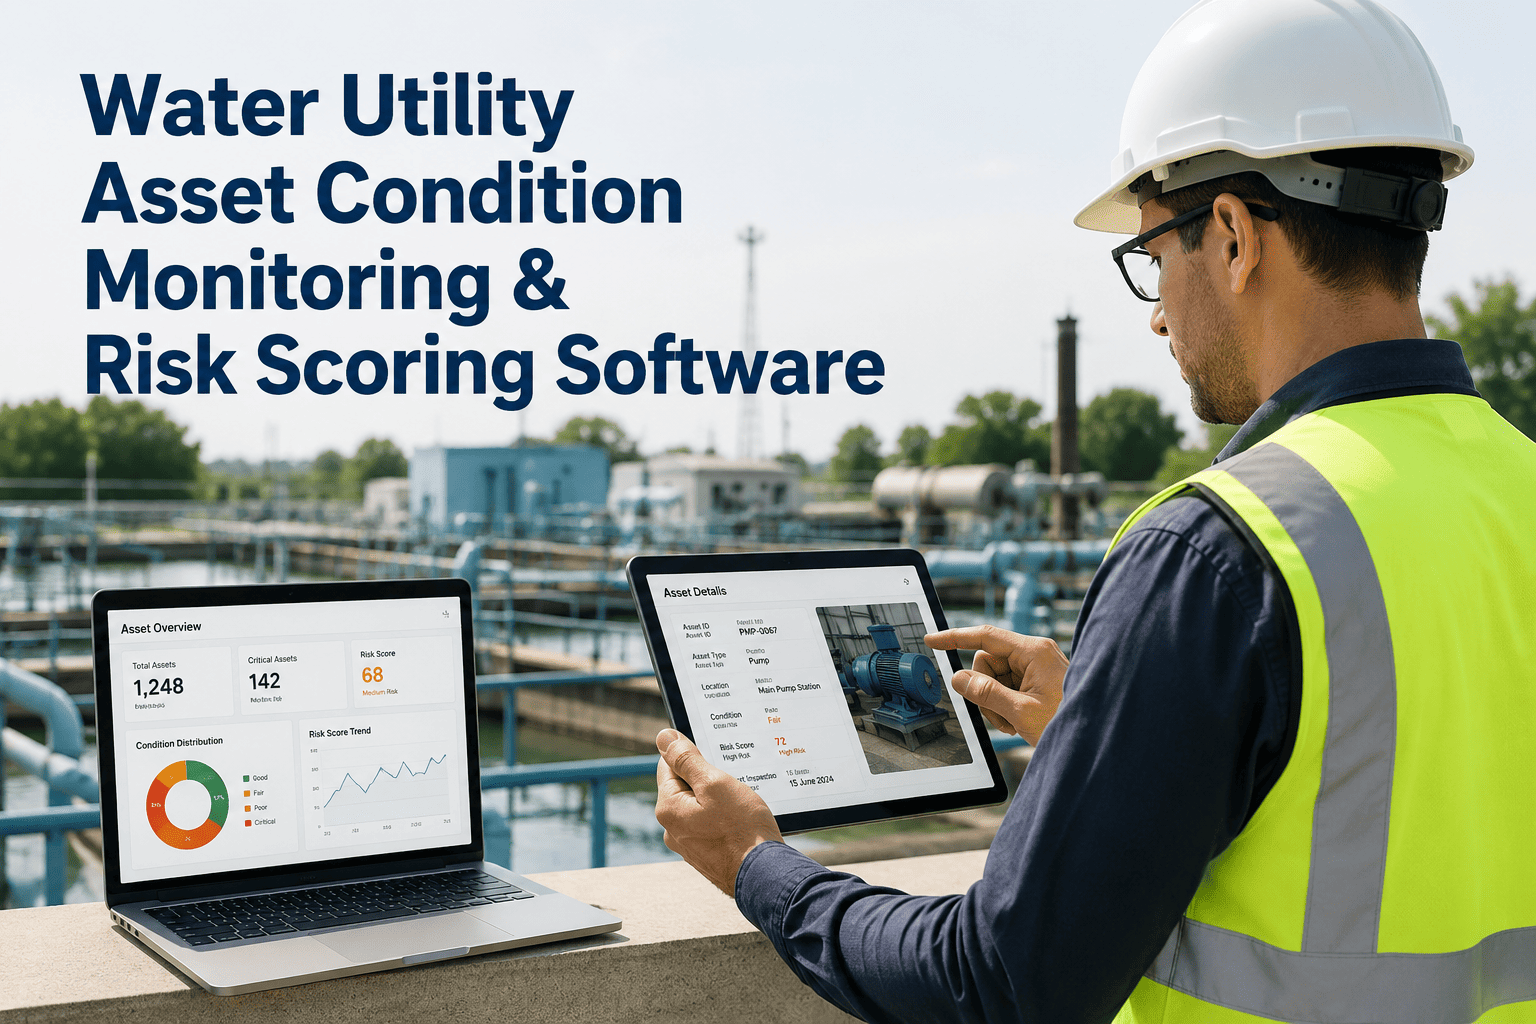
CCTV and robotic crawler footage scored for joint offset, corrosion, root intrusion, and lining defects, with severity coded to standard utility condition grading systems.
FACILITIES
Buildings & Vertical Facilities
Envelope, roof, and structural component condition tracking across large facility portfolios, standardizing scores across sites that previously relied on whichever inspector was assigned that year.
See Condition Scoring Run Against Your Own Asset Imagery
iFactory can process a sample of your existing inspection photos, drone footage, or CCTV runs and return a scored condition assessment so you can compare it directly against your current survey results.
The Cost of Assessing Less Often Than Decay Demands
The financial argument for continuous condition assessment is not abstract. Bridge maintenance backlogs alone run into the tens of billions of dollars nationally, and a large share of that backlog exists because defects were caught late rather than early. The panels below trace that cost from a single missed defect to a network-level capital planning number.
PER MISSED DEFECT
$500–$5K
The added repair cost of catching a defect after it has progressed one severity tier further than it needed to
PER ASSET PER YEAR
$5K–$40K
Accelerated repair and rehabilitation costs on a single bridge or major structure inspected only on a fixed calendar cycle
PER NETWORK PER YEAR
$500K–$3M
Aggregated deferred-maintenance cost growth across a mid-size road, bridge, or utility network under reactive scheduling
CATASTROPHIC FAILURE AVOIDED
$1M–$100M+
The order-of-magnitude cost difference between planned rehabilitation and emergency closure, replacement, or liability exposure
From Image Capture to Prioritized Work Order
A condition score that sits in a report nobody reads changes nothing. iFactory's assessment pipeline is built to close the loop from raw imagery to a work order that lands on the right team's desk with the right priority attached, so every capture pass produces an action instead of an archive.
1
Image Capture
Fixed cameras, drone flights, vehicle-mounted rigs, or CCTV crawlers feed imagery into the pipeline on a schedule matched to each asset class's decay speed.
2
Defect Detection
Category-specific models identify and classify every visible defect type present in the frame, from hairline cracks to advanced corrosion.
3
Severity Scoring
Each detected defect is measured and scored against standard condition rating scales, calibrated to your agency's or organization's existing methodology.
4
Priority Routing
Scores above threshold generate a routed work order with location, severity, and recommended action, sent directly to the responsible maintenance team.
5
History & Trending
Every scored image is retained against its asset record, building a longitudinal condition history that shows the actual rate of decay over time.
A Regional Asset Manager on What the Data Actually Changed
"
For years our condition ratings were only as good as whichever inspector walked the asset that cycle, and everyone in the department knew it even if nobody said it out loud in front of the council. What changed once we brought computer vision into the survey process was not that we suddenly discovered more defects out of nowhere — it was that we started seeing the same defect scored the same way every single time, regardless of who captured the imagery or what the weather was doing that day. That consistency turned out to matter more for capital planning than raw detection volume. We could finally show a defensible trend line for a given structure instead of three disconnected snapshots taken years apart, and that trend line is what got our rehabilitation budget approved on the first pass instead of getting kicked back for more justification. The other change nobody predicted going in was how much rope-access and lane-closure time we got back once routine visual passes stopped requiring a full inspection crew on site.
— Regional Infrastructure Asset Manager · 15 Years Structural Inspection Program Leadership
What Changes in the First 90 Days
A computer vision condition assessment rollout does not require a full network conversion before it starts producing usable data. The milestones below reflect what pilot programs typically see within a single quarter of going live on an initial set of priority assets.
Days 1–14
Baseline imagery scored
Existing photo, drone, or CCTV archives for pilot assets are run through the model to establish a first condition baseline for comparison.
Days 15–30
Live capture begins
New imagery from ongoing inspection or capture passes flows through the pipeline automatically, and the first scored work orders reach maintenance teams.
Days 31–60
Trend lines emerge
Repeated capture passes on the same assets begin producing a real progression rate rather than isolated point-in-time scores.
Days 61–90
Capital plans get updated inputs
Condition trend data feeds directly into rehabilitation prioritization and next-cycle capital planning discussions with a defensible data trail attached.
Common Mistakes When Moving to Automated Condition Assessment
Organizations that get the most value from computer vision assessment tend to avoid a handful of predictable missteps during rollout. The patterns below show up repeatedly across early-stage deployments and are worth planning around before the first camera or drone flight is scheduled.
A
Training the Model on Too Few Examples
A model calibrated on a handful of sample images will underperform on the edge cases that matter most. Depth of labeled training data per defect type and severity tier is what separates a reliable model from a noisy one.
B
Ignoring Camera Angle and Lighting Consistency
A model trained on well-lit, consistent-angle imagery will struggle against inconsistent capture conditions in the field. Standardizing capture setup upfront avoids months of retraining later.
C
Treating the Score as the Final Answer
Automated scores work best as a triage layer that routes borderline and high-severity cases to engineering review, not as a replacement for professional judgment on consequential decisions.
D
Skipping Integration With Existing Systems
A scoring tool that lives outside your asset management and GIS platforms becomes another dashboard nobody checks. Integration should be planned from day one, not bolted on after the pilot.
E
Rolling Out to the Entire Network at Once
A phased rollout on priority assets first surfaces calibration issues while the stakes are low, and builds internal confidence in the scoring output before it drives major budget decisions.
F
Underestimating Change Management
Inspectors and engineers who have relied on their own judgment for years need to see the model's reasoning and validation data before they trust its scores — that trust has to be built deliberately, not assumed.
Is Your Portfolio Ready for Automated Condition Assessment?
Before committing to a full rollout, it helps to honestly assess where your organization stands on the fundamentals that determine whether a computer vision deployment will succeed quickly or stall out during onboarding.
DATA
You Have Some Existing Imagery
Historical inspection photos, drone footage, or CCTV archives — even a modest volume — give the model a real starting point instead of a cold start.
PRIORITY
You Can Name Your Highest-Risk Assets
A pilot works best when it starts on the assets where a missed defect carries the highest consequence, not on whichever asset happens to have the cleanest photos on file.
WORKFLOW
Your Maintenance Teams Can Receive Routed Work Orders
The value of automated detection depends on someone being able to act on the alert quickly — confirm the receiving workflow exists before the first score gets generated.
BUY-IN
Your Engineering Team Is Ready to Validate Early Scores
Early involvement from the engineers who will ultimately trust or distrust the system's output makes the difference between fast adoption and a stalled pilot.
Frequently Asked Questions
How accurate is computer vision compared to a trained human inspector?
Computer vision models are trained on thousands of labeled examples reviewed and confirmed by qualified engineers, so the detection criteria reflect established professional judgment rather than a generic rule. The advantage is not that the model sees something a trained eye could never see — it is that the model applies the same criteria to every single frame, every single time, without the fatigue, lighting variation, or subjective drift that affects even the most experienced human inspectors across a long survey day. Borderline or ambiguous cases are flagged for human engineering review rather than auto-scored, which keeps professional judgment in the loop where it genuinely matters. You can
contact our team to review validation data against your own historical inspection records.
Do we need new cameras or drones, or can this work with imagery we already collect?
Most deployments begin by processing whatever imagery your organization already captures — existing inspection photos, drone survey footage, vehicle-mounted roadway scans, or CCTV crawler runs from pipeline inspections. During onboarding, iFactory reviews your current image quality, resolution, and capture angles against what the model needs for reliable scoring, and recommends supplemental capture equipment only where genuine gaps exist. Many organizations start entirely with historical archives to establish a baseline before adding any new capture hardware at all, which keeps first-phase costs limited to software and integration work.
Can the system work with our existing condition rating scale, or do we need to switch methodologies?
The scoring layer is calibrated to output results in whatever rating methodology your organization already uses, whether that is a standard pavement condition index, an element-level bridge rating system, a utility defect coding standard, or an internal facility condition scale. This matters because a new scoring scale that nobody on your engineering team recognizes creates more adoption friction than the technology is worth. Calibration is done during onboarding using a sample of your own historical inspection records so the model's severity boundaries line up with how your team already thinks about condition.
How does this integrate with our existing asset management or GIS system?
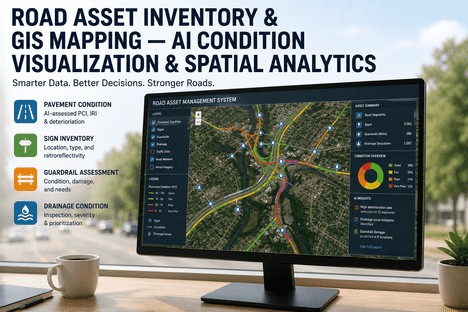
Scored defect data, including location, severity, image reference, and timestamp, is structured to integrate with common asset management platforms and GIS systems rather than living in a separate standalone tool your team has to check manually. The goal is for a condition score generated from a capture pass to land directly inside the same system your maintenance planners and capital budgeting team already use, so it becomes one more trusted data field rather than an additional dashboard to reconcile against everything else.
What is the realistic timeline and cost to pilot this across a few priority assets?
A focused pilot on a handful of priority assets — a few bridges, a road segment, or a section of pipeline network — typically runs on the order of weeks rather than months, since the first phase can use imagery you already have on file. Cost scales with the number of assets, the volume of imagery to be processed, and whether any supplemental capture hardware is genuinely needed. The most reliable way to see real numbers against your own portfolio is to
book a demo and walk through a sample scoring run with our team.
Turn Every Inspection Pass Into a Standardized Condition Record
Manual condition surveys will always be limited by how often a trained inspector can physically reach every asset. Computer vision from iFactory gives every road, bridge, pipeline, and facility a consistent, continuously updated condition score — so your capital planning is built on data, not on whoever happened to hold the clipboard that year.