The Asset Manager responsible for a road network of any scale faces a question that no spreadsheet alone can answer: what do we actually own, where exactly is it, what condition is it in, and how does that condition change across seasons, budgets, and maintenance cycles? The typical county network includes thousands of pavement segments, tens of thousands of traffic signs, hundreds of miles of guardrail, and a drainage system whose culverts and inlets have not been systematically inspected since installation — yet the asset inventory, if it exists at all, lives in paper files, disconnected spreadsheets, and the institutional memory of crew supervisors. When the board asks for the replacement value of the sign network, when the auditor demands condition documentation for GASB-34 compliance, or when the emergency response team needs the exact location and size of every culvert in a flood zone, the Asset Manager is expected to produce answers from systems that were never designed to provide them. AI-powered condition visualization and spatial analytics close this gap by building a unified, georeferenced asset inventory that the Asset Manager can query, visualise, and update as a single spatial platform — not as a collection of disconnected records. This is the Asset Manager's guide to building it.
Unified Spatial Inventory · AI Condition Mapping · GASB-34 Compliance · Mobile-First Field Collection
Asset Managers Who Cannot Answer What, Where, and What Condition on Any Road Asset Within Their Network Cannot Defend Their Budget, Their Priorities, or Their Compliance Status. GIS Closes Every Gap.
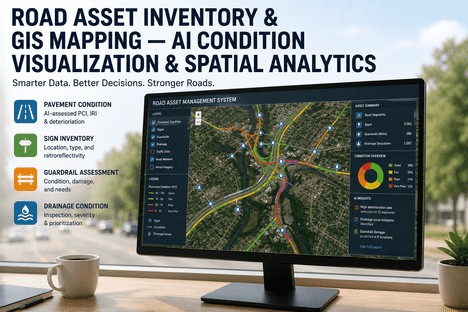
iFactory's road asset intelligence platform builds a complete GIS inventory of pavement, signs, guardrails, drainage, markings, and roadside assets — with AI-powered condition visualisation, spatial analytics, mobile field collection, and automated compliance reporting for GASB-34, TAMP, and internal audit requirements.
Global GIS asset management software market valued in 2025 — projected to reach $10.6 billion by 2034 at 9.2% CAGR as transportation agencies adopt spatial asset platforms
80%
Of road assets that can be automatically detected and inventoried using AI-powered video analysis during routine inspection drives — eliminating the need for separate survey crews
4x
Faster asset inventory creation achievable with AI computer vision compared to manual field surveys — at half the cost while maintaining superior consistency and repeatability
50,000+
Traffic signs managed by a typical large US county — each requiring condition tracking, retroreflectivity measurement, and replacement scheduling that demands a geospatially accurate inventory system
The Six Asset Classes Every Road Asset Manager Must Inventory, Map, and Condition-Rate
A complete road asset inventory spans multiple asset classes that are typically managed in separate databases — or not managed at all. Each class has a different inspection cycle, a different deterioration model, a different replacement cost, and a different regulatory compliance requirement. The iFactory platform unifies all six asset classes into a single GIS inventory with condition visualisation, spatial query, and lifecycle tracking that the Asset Manager can access from a single dashboard.
Asset Class 01
Pavement Segments and Surface Condition
Every pavement segment in the network is georeferenced to its centreline location with attributes including surface type, construction date, layer thickness, functional classification, and traffic loading. Condition data — PCI, IRI, rutting, cracking indices — is overlaid as a colour-coded map layer that the Asset Manager can query by date range, condition threshold, and geographic area. Historical condition trends are visualised per segment so the Asset Manager can see which segments are deteriorating faster than the network average and investigate the cause before the segment falls below the preservation eligibility threshold.
GIS capability: Condition-coded pavement map layer with historical trend overlay per segment.
Asset Class 02
Traffic Sign Inventory and Condition
Every regulatory, warning, guide, and street-name sign is inventoried with GPS location, sign type, MUTCD code, post type, installation date, retroreflectivity measurement, and condition rating. The GIS map displays sign condition as a colour overlay so the Asset Manager can immediately identify corridor-level sign degradation patterns — for example, all signs installed in 2018 on a specific corridor may be showing the same retroreflectivity decline, indicating a batch quality issue rather than random degradation. Replacement schedules are generated automatically from condition data and regulatory requirements, ensuring that no sign exceeds its mandated service life without documented action.
Guardrail assets are inventoried with georeferenced start and end points, terminal type, MASH compliance status, lateral offset from travel lane, height, and condition defects including face denting, end terminal damage, support deficiency, and missing bolts — automatically extracted from LiDAR and video-log data using validated algorithms developed in the MassDOT automated guardrail inventory research programme. The GIS map displays guardrail condition by severity level and flags MASH non-compliant segments for priority replacement. The Asset Manager can generate a complete guardrail replacement programme budget by querying the inventory for all non-compliant or poor-condition segments and applying unit replacement costs.
GIS capability: LiDAR-extracted guardrail inventory with MASH compliance overlay and replacement cost aggregation.
Asset Class 04
Drainage Infrastructure
Culverts, inlets, catch basins, manholes, outfalls, and drainage channels are inventoried with GPS location, size, material, installation date, inspection condition rating, and hydraulic capacity where available. The GIS map layers drainage condition onto flood zone data, allowing the Asset Manager to identify drainage assets in high-risk flood areas that require priority inspection and maintenance. For culverts, the inventory includes the FHWA National Culvert Inspection Reporting System fields, ensuring consistency with federal reporting requirements. The Asset Manager can query the drainage inventory by condition, by flood zone risk, and by age to generate risk-prioritised maintenance and replacement programmes.
GIS capability: Drainage condition layered on flood zone data for risk-prioritised maintenance planning.
Asset Class 05
Pavement Markings and Lane Delineation
Edge lines, centre lines, lane lines, crosswalks, stop bars, and directional markings are inventoried by location, type, material, installation date, and condition rating measured by retroreflectivity and wear. The GIS map displays marking condition as a linear overlay on pavement segments, showing the Asset Manager exactly where remarking is needed before the markings fall below minimum retroreflectivity standards. For agencies that contract marking services, the condition map generates a precisely scoped remarking programme with quantities by marking type, allowing the Asset Manager to tender accurately scoped contracts rather than estimated lump sums.
GIS capability: Marking condition linear overlay with quantity-based tender scoping.
Asset Class 06
Roadside Infrastructure and Support Assets
Street lights, traffic signals, signal poles and cabinets, pedestrian push buttons, accessible pedestrian signals, fire hydrants, street furniture, retaining walls, noise barriers, and slope assets are inventoried with location, type, material, installation date, and condition rating. For traffic signal assets, the inventory includes controller type, cabinet configuration, detector type, interconnection status, and phasing data — the full set of attributes that a signal management programme requires. The GIS map layers these assets onto the road network so the Asset Manager can see the complete roadside infrastructure context for any corridor. Replacement values and remaining useful life are calculated automatically for each asset class, supporting GASB-34 modified approach compliance.
GIS capability: Complete roadside asset context per corridor with automated valuation and useful life calculation.
Multi-Asset GIS · Condition Heat Maps · Spatial Queries · Mobile Field Collection
The Asset Manager Who Can Open a Single Map and See Every Pavement Segment, Sign, Guardrail, Culvert, and Signal — With Condition Colour-Coded Across the Entire Network — Never Has to Say 'I Do Not Know' Again.
iFactory builds the unified asset inventory directly from your existing data sources and AI-powered field collection — so the Asset Manager manages the network from a single spatial platform, not from disconnected spreadsheets and institutional memory.
The Four Pillars of AI-Powered Road Asset Inventory and Condition Visualisation
Building a complete, current, and queryable road asset inventory requires four capabilities that together form a closed-loop asset intelligence system — from initial data capture through condition visualisation, spatial analysis, and field update. Each pillar serves a distinct function in the Asset Manager's workflow, and all four are integrated into the iFactory platform as a single unified interface.
Pillar 01
AI-Powered Asset Detection and Inventory Creation
The inventory begins with data capture. The iFactory platform ingests video imagery from any source — a dash-mounted smartphone during routine inspection drives, dedicated survey vehicle camera systems, or uploaded drone footage. Computer vision models trained on millions of labelled road asset images automatically detect and classify pavement segments, traffic signs, guardrails, drainage assets, pavement markings, and roadside infrastructure. Each detected asset is assigned a GPS coordinate, a confidence score, and a preliminary condition assessment. The Asset Manager reviews the AI-detected inventory in the platform, verifies and edits asset attributes, and saves the final inventory to the GIS database. Up to 80 percent of assets are captured automatically, with the remainder added or corrected through a simple manual review interface. The initial inventory for a typical county network is completed in weeks rather than the months or years that a manual field survey would require.
Typical outcome: Initial inventory complete in 2–4 weeks for a county network of 500–1,000 lane-miles.
Pillar 02
Condition Visualisation and Spatial Analytics Engine
Once the inventory is loaded, the condition visualisation engine creates a multi-layer GIS map that the Asset Manager can configure by asset class, condition threshold, date range, geographic boundary, and traffic or risk overlay. Each asset class is displayed with a colour-coded condition scale — green for good, amber for fair, red for poor — and the map layers can be toggled on and off. The spatial analytics engine supports queries that the Asset Manager uses daily: show all guardrail segments in poor condition on roads with speed limits above 45 mph; identify all culverts in flood zone A with a condition rating below 3 and an installation date before 1990; map every stop sign on the network with retroreflectivity below the MUTCD minimum. Queries return results as a map overlay, a table, and a summary report simultaneously. The analytics engine also calculates network-level metrics — the percentage of each asset class in good, fair, and poor condition; the total replacement value by asset class; and the annual depreciation based on remaining useful life.
Typical outcome: Network-wide condition reports and spatial queries generated in seconds instead of days.
Pillar 03
Mobile Field Collection and Inventory Update
The asset inventory is not a one-time project — it must be continuously updated through field inspections, maintenance activities, and asset replacements. iFactory's mobile field application runs on any smartphone or tablet and provides field crews with the current inventory for their assigned area, displayed on an offline-capable GIS map. Crews can update asset condition, add newly installed assets, retire removed assets, attach photographs, and record maintenance actions — all with GPS coordinates captured automatically. The update is synchronised to the central inventory in real time when the device is connected, or queued for synchronisation when connectivity is restored. For agencies that conduct annual or biennial network-wide condition surveys, the mobile application also supports walking or driving inspection modes with structured condition assessment forms per asset class. The Asset Manager sees every field update on the central GIS map within minutes of synchronisation, eliminating the lag between inspection and inventory update that makes most asset inventories obsolete before they are completed.
Typical outcome: Field updates reflected in central inventory within minutes — not weeks or months.
Pillar 04
Compliance Reporting and Audit Documentation
The asset inventory must serve the compliance requirements that the Asset Manager faces from multiple directions — GASB-34 modified approach for infrastructure asset valuation and condition documentation; FHWA Transportation Asset Management Plan (TAMP) requirements under 23 CFR Part 515; state-level reporting mandates; and internal audit requests. iFactory's compliance reporting module generates structured reports for each regulatory requirement directly from the GIS inventory. For GASB-34, the platform calculates asset replacement values, accumulated depreciation, and condition-level documentation for each asset class. For TAMP, the platform produces the required condition data summaries, lifecycle cost projections, and risk management outputs. For internal audits, the platform provides a searchable trail of every inventory change, every condition update, and every inspection record — with the original GPS coordinates, timestamp, and user identification attached to each record. The Asset Manager can respond to any audit or compliance request by generating the relevant report from the platform within minutes, rather than spending days compiling data from multiple sources.
Typical outcome: Compliance reports generated in minutes — GASB-34, TAMP, and internal audit ready.
The Spatial Analytics Queries That Transform Asset Inventory From a Record Into a Decision Tool
An asset inventory that only tells the Asset Manager what exists is a record. An asset inventory that answers spatial, conditional, and risk-based questions is a decision tool. The iFactory platform is built around the spatial queries that Asset Managers need to answer daily, and it presents the results as map overlays, summary tables, and exportable reports simultaneously — so the answer to every question drives action, not just documentation.
Asset condition by geographic district — what is the percentage of assets in poor condition in each district, and how does it compare to the network average?
The query returns a district-by-district condition breakdown for any selected asset class, with a comparison column showing the variance from the network average. The Asset Manager uses this to identify districts that are underperforming the network average and investigate whether the cause is higher traffic loading, older asset installation, different climate conditions, or a gap in the maintenance programme. The output is colour-coded for immediate visual comprehension — districts worse than the network average appear in amber or red.
Time to answer with GIS inventory: 8 seconds. Time without: 3–5 days of manual data compilation.
Assets approaching end of useful life within the next 3 years — which assets need replacement or major maintenance, and what is the total estimated cost?
The query selects all assets of any class whose remaining useful life falls below 3 years based on installation date and the class-specific useful life benchmark. The platform aggregates the estimated replacement or major maintenance cost for the selected assets and displays the result both as a total and as a year-by-year projection. The Asset Manager uses this output to build the capital budget request for the next 3 to 5 years, with each asset's estimated cost linked to its specific GIS location and condition record for audit traceability.
Time to answer with GIS inventory: 12 seconds. Time without: 2–4 weeks of manual record review.
Corridor-level asset context — what is the complete asset inventory for a specific corridor, including pavement, signs, guardrails, drainage, markings, and signals, with condition status for each asset?
The Asset Manager draws a corridor boundary on the GIS map or selects a road segment range, and the platform returns a complete asset inventory for that corridor — every sign, guardrail section, culvert, inlet, signal, and pavement segment within the defined corridor, with condition status for each. The corridor view is used for project scoping (what assets are affected by a planned reconstruction?), budget estimation (what is the total replacement value of this corridor?), and emergency response (what assets are in the flood-affected area and what is their condition?).
Time to answer with GIS inventory: 15 seconds. Time without: 1–2 weeks of field verification.
High-risk asset identification — which assets combine poor condition with high traffic exposure, flood zone location, or critical network function?
The query combines condition data with risk factors such as traffic volume, flood zone classification, emergency route designation, and school zone proximity. The output is a ranked list of assets that present the highest risk to safety, network function, or regulatory compliance. The Asset Manager uses this to prioritise maintenance and replacement funding toward the assets where failure would have the greatest consequence, rather than treating all assets of the same class equally. The query distinguishes between assets that are in poor condition on low-risk segments (schedule for routine replacement) and assets that are in fair condition on high-risk segments (prioritise for early intervention).
Time to answer with GIS inventory: 10 seconds. Time without: typically unavailable without spatial analysis tools.
"
When I took over asset management for the county, we had pavement condition data in one spreadsheet, sign inventory in a paper binder last updated in 2017, guardrail records that did not exist in any central system, and drainage infrastructure that nobody had ever systematically inventoried. The county board wanted a replacement value for our road network assets for the annual financial statement, and I could not produce it — not because I did not know the network, but because I had no single system that could aggregate condition and replacement cost across all asset classes. We deployed the GIS asset inventory platform and completed the initial inventory of 7,200 signs, 340 guardrail segments, 1,800 drainage structures, and 520 lane-miles of pavement in six weeks. The board had the asset valuation within the first month. The real impact came when we used the condition map to identify that 40 percent of our stop signs had retroreflectivity below the MUTCD minimum — something our manual inspection programme had missed because it sampled only 15 percent of signs annually. The replacement programme was scoped, budgeted, and tendered within one quarter. Nobody in the county questions the asset management budget anymore because we can show exactly what every dollar is buying and where it is going.
— Asset Management Director, County Public Works Department — 520 Lane-Mile Network, 8,900 Total Assets Across Six Classes
Conclusion
A road asset inventory is not a project with an end date — it is an operational capability that must be built, maintained, and continuously improved across every asset class, every condition cycle, and every compliance requirement the Asset Manager faces. When the inventory lives in disconnected spreadsheets, paper field notes, and institutional memory, the Asset Manager cannot answer the three questions that every stakeholder — the board, the auditor, the emergency response coordinator, and the public — expects to be answerable at any moment: what assets do we own, where are they, and what condition are they in? AI-powered GIS asset inventory and condition visualisation closes this gap by unifying every asset class in a single spatial platform that the Asset Manager queries visually, updates from the field, and reports from directly — eliminating the gap between asset data and asset decisions.
The GIS asset management software market is projected to reach $10.6 billion by 2034 as transportation agencies worldwide recognise that location intelligence is the foundation of effective asset management. The FHWA mandate for Transportation Asset Management Plans under 23 CFR Part 515, the GASB-34 modified approach requirements for infrastructure condition documentation, and the increasing public expectation for transparent infrastructure reporting all converge on the same conclusion: the Asset Manager needs a unified, spatial, condition-coded inventory that covers every road asset from pavement to signpost to culvert. The agencies that build this capability are the ones that defend their budgets, pass their audits, and maintain their networks at target condition levels — not because they have more funding, but because they allocate it to the right assets at the right time based on the right data.
iFactory's road asset intelligence platform is purpose-built for Asset Managers who need a complete, current, and queryable GIS inventory of every road asset in their network — with AI-powered condition visualisation, mobile field collection, and automated compliance reporting for GASB-34, TAMP, and internal audit requirements. Book a Demo to see the platform configured for your asset inventory scope, or talk to an expert about a free asset inventory readiness assessment for your road network.
Frequently Asked Questions
The platform ingests existing asset data from any source — GIS shapefiles, pavement management system exports, sign inventory spreadsheets, maintenance management databases, CAD drawings, and paper records that can be digitised through the AI detection pipeline. Most agencies already hold a partial asset inventory in one or more of these formats; the platform consolidates them into a single GIS inventory rather than requiring the Asset Manager to start from nothing. For asset classes where no digital inventory exists, the AI detection engine can build the initial inventory from a single drive-by video collection pass using a dash-mounted smartphone or dedicated camera system. The platform also supports selective inventory build — the Asset Manager can prioritise asset classes by risk or compliance need and build the inventory progressively, starting with the highest-priority classes and adding others in subsequent cycles. Book a Demo to see a data source assessment for your agency.
AI-powered detection accuracy varies by asset class, image quality, and environmental conditions — but independent studies and agency deployments consistently report detection rates above 85 percent for traffic signs, guardrails, and pavement markings in good lighting conditions, with false positive rates below 5 percent when the model is configured for the agency's asset types and road environment. The platform operates on a human-in-the-loop validation model: AI-detected assets enter a review queue where the Asset Manager or designated staff can verify, edit, or reject each detection before it becomes a permanent inventory record. For agencies that require validation sampling, the platform supports a structured review workflow where a statistically significant sample of detections is verified in the field, and the validation results calibrate the detection confidence thresholds for subsequent cycles. The key advantage of AI detection over manual surveys is not that it is perfectly accurate on every detection — it is that the same AI model applied to the same road network produces consistent results, unlike human surveyors whose condition ratings vary by experience level, fatigue, and subjective judgment. The Xweather RoadAI repeatability study found AI condition assessments were twice as consistent as trained human inspectors on the same roads. Talk to an expert about configuring validation workflows for your agency's quality standards.
GASB-34 modified approach compliance requires three elements: a complete asset inventory with location and condition data, a documented condition assessment system that demonstrates assets are being preserved at or above a defined condition level, and an annual condition estimate that supports the assertion that the modified approach is being properly applied. iFactory's platform addresses all three elements automatically. The inventory module captures and maintains the complete asset register with GPS location, installation date, and condition rating per asset. The condition assessment module documents every inspection event with a timestamp, condition score, and the name of the inspector — creating the audit trail that demonstrates systematic condition assessment is in place. The annual condition report module generates the condition summary by asset class, the year-over-year condition trend, and the estimated replacement value, all of which are required for the modified approach disclosure in the financial statements. The platform also tracks condition preservation actions — maintenance and replacement activities that demonstrate the agency is actively maintaining assets at the target condition level. This documentation is sufficient for both the annual financial audit and the GASB-34 modified approach compliance review. Book a Demo to see the GASB-34 compliance module configured for your asset classes.
Field crews use the iFactory mobile application on their existing smartphones or tablets. The app downloads the relevant section of the asset inventory for the crew's assigned work area before they leave the depot — including the GIS map layer with all assets and their current condition. During maintenance activities, crew members can update asset condition, replace or repair assets, add new assets (with GPS location captured from the device's built-in GPS receiver), attach photographs of the work completed, and record the materials used and the work order reference. If the crew is working in an area without cellular connectivity, all updates are stored locally on the device and queued for synchronisation when connectivity is restored. The synchronisation process is automatic — when the device reconnects to the network, all queued updates are pushed to the central inventory and reflected on the GIS map within minutes. The platform maintains a complete change log that records who made each update, when, and from which device — providing full audit traceability for every inventory change. For agencies with field crews that do not use smartphones, the platform supports a paper-based update workflow where field notes are scanned and entered by an office data entry team, though this introduces the same lag that the digital workflow eliminates. Talk to an expert about configuring mobile devices and field workflows for your crew structure.
Yes. The platform is designed as an integration layer that connects the GIS asset inventory to the agency's existing operational systems rather than replacing them. The platform supports API-based integration with the most widely deployed pavement management systems (dTIMS, MicroPAVER, StreetSaver, RoadPlan), work order and asset management systems (Cityworks, Cartegraph, AssetWise, IBM Maximo), and financial systems (for replacement value and depreciation data). The integration is bi-directional where appropriate: condition data from the PMS flows into the GIS inventory for visualisation, and field updates from the mobile app flow into the work order system to trigger maintenance actions. For agencies that use ArcGIS as their enterprise GIS platform, the iFactory inventory is published as an ArcGIS feature service and can be viewed and queried directly within the agency's existing ArcGIS portal alongside other GIS data layers. For agencies that do not use ArcGIS, the platform includes a built-in GIS viewer with all the spatial query and visualisation capabilities that the Asset Manager needs, eliminating the requirement for a separate GIS software licence. Book a Demo to see a system integration assessment for your current software stack.
If You Cannot Open One Map and See Every Asset, Its Location, and Its Condition Across Your Entire Network, Your Asset Inventory Is Not a Decision Tool — It Is a Collection of Records. Get a Free Asset Inventory Readiness Assessment.
iFactory's road asset intelligence platform for Asset Managers — AI-powered asset detection and inventory creation, multi-layer GIS condition visualisation, spatial analytics and risk-prioritised queries, mobile field collection, and automated compliance reporting for GASB-34, TAMP, and internal audit requirements.