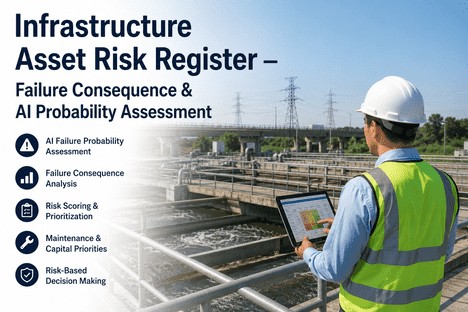
Infrastructure Asset Risk Register — Failure Consequence & AI Probability Assessment
By Grace on June 27, 2026
The bridge was inspected eleven months ago and rated in satisfactory condition. Nobody saw the four-inch crack in the primary girder because the inspection protocol did not require ultrasonic testing on that joint at that interval. When the crack propagated through the web during a cold snap and the bridge was closed for emergency repairs, the operations director learned about it from the news — not from the risk register. The asset had been listed, the consequence of failure had been scored as high, but the probability assessment had not been updated in fourteen months because it depended on condition data that was collected annually and reviewed quarterly. The probability had shifted from improbable to likely somewhere between the last two review cycles, and the system that was supposed to flag the change had no way of knowing because nobody had re-run the assessment. This is the failure mode that a static risk register cannot prevent — and that iFactory's AI-driven probability assessment engine was built to eliminate.
Your Risk Register Has the Right Formula. It Just Needs Data That Moves Faster.
iFactory replaces static probability estimates with AI-calibrated risk scores that update in real time. See how it works for your portfolio.
US infrastructure investment gap over the next decade — the funding that does not exist to address risks already identified in asset registers across every sector
C grade
America's overall infrastructure grade from ASCE in 2025 — the highest in 27 years but still indicating mediocre condition across most asset classes
3x to 9x
Cost multiplier of reactive repairs over planned maintenance — the financial consequence of a risk register that fails to reprioritise assets as conditions change
46%
Share of global infrastructure assets over 40 years old — assets whose failure probability curves are steepening while most risk registers still treat them as static entries
The Infrastructure Asset Risk Register Is Not Broken. It Is Just Sitting Still While the Assets Keep Moving.
Most infrastructure asset risk registers follow a standard format that has not changed meaningfully in two decades. Assets are listed, assigned a criticality category, given a condition score from the most recent inspection, and ranked by a risk score calculated as the product of likelihood and consequence. The register is reviewed quarterly or annually, updated when inspection data arrives, and used to inform capital planning and maintenance prioritisation. This process is logical, defensible, and familiar to every operations director managing public or private infrastructure. It is also structurally incapable of telling you which asset will fail next.
Five Ways a Static Risk Register Fails — and Why Every One Is a Consequence of Infrequent Probability Reassessment
1
Annual inspection data arrives too late to inform the current risk score
An asset inspected in January receives a condition score that is entered into the risk register in February. The probability of failure calculated from that score is valid for the day the inspection was conducted. By July, a leak has developed, a support has corroded, and a crack has propagated — but the risk register still reflects the January condition score because the next inspection is not scheduled until November. The probability score drifts further from reality with every passing week, and the operations director making capital allocation decisions in August is working with failure probability data that is seven months stale.
2
Consequence scoring stays static while the operating environment shifts
A water main serving a light industrial area receives a consequence score of moderate because a failure would affect a small number of commercial customers. Five years later, the area has been rezoned and now includes a hospital, two schools, and a data centre. The consequence score has not been updated because the risk register has no mechanism to ingest land-use changes, population shifts, or new critical facility designations. The asset is still ranked as moderate-consequence risk on paper while the actual consequence of its failure has escalated to critical without anyone updating the register.
3
Risk ranking is a snapshot, not a signal — prioritisation does not update between reviews
When a bridge or a culvert or a pump station moves from medium-risk to high-risk because its condition is deteriorating faster than projected, that change needs to trigger an immediate review of its position in the maintenance queue. In a static register, the risk ranking is recalculated at the next quarterly review at the earliest. The asset continues to receive the attention appropriate to its previous risk level while the gap between its actual risk and its documented risk grows. If failure occurs in the window between review cycles, the post-incident review will show that the asset was on the register — but the system did not flag the escalation.
4
Probability assessment relies on human judgment that varies between assessors
Two experienced engineers inspecting the same cracked concrete beam will produce different probability assessments because failure probability estimation is inherently subjective when based on visual observation alone. One assessor has seen similar cracking fail catastrophically and scores it high. Another has seen it survive for years and scores it moderate. Both are qualified. Both are honest. Neither is wrong based on their experience. But the risk register treats both scores as equally valid data points, introducing an inconsistency that propagates through every downstream prioritisation decision. Without objective condition data and AI-driven probability calibration, the register reflects the assessor as much as the asset.
5
Cascading failure consequences are invisible to single-asset registers
Most risk registers assess each asset independently. A fire pump failure is scored on its own consequence. A stormwater pump failure is scored on its own consequence. What the register does not capture is that both pumps serve the same flood management system and the failure of either alone is manageable while the failure of both simultaneously creates a catastrophic flood risk that is an order of magnitude greater than the sum of the individual scores. Network interdependencies amplify consequences in ways that single-asset registers cannot model — and that AI-driven systemic risk assessment is specifically designed to detect.
Risk = Likelihood x Consequence — Why the Formula Is Simple but the Calculation Is Not
The standard risk scoring formula is the foundation of every properly structured asset risk register. Likelihood scores the probability that an asset will fail within a given timeframe. Consequence scores the impact of that failure across safety, operational, financial, regulatory, and environmental dimensions. The product of the two produces a risk score that determines the asset's position in the maintenance and capital priority queue. Every operations director knows the formula. What most have not yet solved is how to populate the likelihood side of the equation with data that updates faster than the inspection cycle.
How iFactory's AI Probability Engine Differs from a Static Likelihood Score
Factor
Traditional Static Register
iFactory AI-Driven Register
Condition data refresh
Annual or biennial inspection cycle — data is months old when entered
Continuous ingestion from IoT sensors, work order history, mobile inspection reports, and drone surveys — probability recalibrated daily
Probability calibration
Subjective engineer judgment on a 1-5 scale — varies by assessor
AI model trained on actual failure histories across similar asset classes — calibrated against outcomes, not opinions
Consequence scoring
Manual assignment at registration — rarely updated unless asset use changes
Dynamic scoring that ingests land-use data, population density shifts, critical facility proximity, and network dependency models
Risk escalation trigger
Quarterly or annual review cycle — risk ranking updates after scheduled review
Real-time trigger — any change in condition data, consequence factor, or interdependency automatically recalculates risk score and alerts
Systemic risk visibility
Single-asset view only — cannot model cascading failure across interdependent assets
Network-level risk model that maps dependencies between assets — detects compounding risk that single-asset scoring misses
Audit trail
Spreadsheet or database with manual change log — version control depends on user discipline
Immutable audit trail with time-stamped probability recalibrations, data source attribution, and automated change documentation — audit-ready at any moment
AI Probability Engine · Dynamic Risk Scoring · Consequence Assessment · Network Dependency Modeling
Your Risk Register Has the Right Formula. It Just Needs Data That Moves Faster Than Your Inspection Cycle.
iFactory's AI probability engine connects every asset's condition data, work order history, sensor telemetry, and environmental context into a single dynamic risk score that updates in real time — so your register reflects today's risk, not last quarter's estimate.
How iFactory Builds a Living Asset Risk Register That Scores Probability and Consequence in Real Time
iFactory does not replace the risk register framework. It replaces the data pipeline that feeds it. Instead of relying on periodic inspection data and manual probability estimates, the platform continuously ingests condition data from multiple sources — IoT sensors, mobile inspection reports, work order histories, drone surveys, and external data feeds — and uses AI models calibrated against actual failure outcomes to produce probability scores that update as frequently as the data arrives. The consequence side is equally dynamic, drawing on GIS data, land-use records, population density information, and network dependency maps to adjust consequence scores when the operating environment changes rather than when the next review is scheduled.
Probability Inputs
Continuous Condition Intelligence Feeds the Probability Side of Every Risk Score
iFactory's AI probability engine ingests data from four continuous streams: IoT sensor telemetry capturing vibration, temperature, pressure, and strain readings in real time; mobile inspection reports from field crews that update condition observations immediately rather than waiting for the next scheduled inspection cycle; work order histories that reveal failure patterns and repair frequency trends invisible to visual inspection alone; and external data feeds including weather exposure, seismic activity records, and usage intensity data that accelerate deterioration curves. The AI model weights each input by its historical correlation with actual failure events for that asset class and produces a probability score that is updated every time new data arrives — not once per quarter from a manual assessment form.
IoT sensor telemetry ingestionMobile inspection data integrationWork order failure pattern analysis
Consequence Inputs
Dynamic Consequence Scoring That Adapts When Your Operating Environment Changes
Where static registers assign a consequence score once and rarely revisit it, iFactory recalculates consequence dynamically by ingesting GIS land-use and zoning updates that detect when new critical facilities open within an asset's failure impact zone; population density shifts that change the safety and economic consequence profile of a failure; network dependency models that identify cascading failure paths where the failure of one asset amplifies the consequence of another; and financial data streams that capture replacement cost estimates, regulatory fine exposure, and business interruption cost projections. When a new hospital opens within the flood zone of an aging stormwater pump station, the consequence score for that pump station adjusts automatically — without a manual register review.
GIS land-use integrationPopulation density analyticsNetwork dependency mapping
Risk Scoring Engine
Real-Time Risk Calculation That Escalates Automatically When Thresholds Are Crossed
Every asset in the iFactory risk register has a continuously calculated risk score derived from the product of its AI-calibrated probability score and its dynamically updated consequence score. When either input changes, the risk score recalculates instantly. If the new score crosses a configurable threshold, the system generates an escalation alert to the designated risk owner, operations director, and capital planning team — depending on the severity of the change. A bridge whose probability score moves from 3 to 4 because sensor data shows accelerated deck deterioration generates an alert that triggers a review of its position in the maintenance queue. A culvert whose consequence score moves from 2 to 5 because a new school opened downstream generates a capital reprioritisation alert. The escalation happens in minutes, not months.
From Risk Ranking to Capital Allocation — One Integrated Decision Workflow
The final output of iFactory's risk register is not a ranked list of assets. It is an integrated capital prioritisation workflow that connects risk scores directly to maintenance and capital budgets. When risk scores change, the platform recalculates the priority of every unfunded or deferred maintenance item and capital project in the portfolio — showing the operations director which investments have moved up or down the priority list as a direct consequence of the risk recalibration. This closes the loop between risk assessment and resource allocation: the risk register is no longer a document that informs capital planning meetings. It is the capital planning system's real-time data source, and every dollar is allocated against the current risk-weighted priority order.
Risk-linked capital planningDynamic priority recalculationBudget scenario modeling
Managing Failure Consequence Across Asset Classes — Why One Risk Framework Does Not Fit All Infrastructure
Different infrastructure asset classes produce fundamentally different failure consequence profiles. The consequence of a bridge failure is measured in potential loss of life, economic disruption, and community access. The consequence of a water main failure is measured in service interruption duration, water quality impact, and repair cost. The consequence of an electrical substation failure is measured in grid stability, critical facility backup activation, and cascading blackout risk. A risk register that applies the same consequence framework to all three produces prioritisation that is consistent but not correct — because the dimensions that matter for each asset class are weighted differently.
How iFactory Configures Consequence Dimensions by Asset Class
Asset Class
Primary Consequence Dimensions
Dynamic Data Feeds for Consequence Updates
Risk Score Impact on Capital Priority
Bridges & Structures
Safety (life safety risk), economic (detour cost and time), community access (route criticality), repair cost severity
Seepage monitoring sensors, structural deformation data, rainfall and flood frequency projections, downstream population GIS layer
Highest criticality class — any score change above threshold triggers immediate capital plan review and emergency action plan update
I inherited a risk register with 847 assets scored on a spreadsheet that was last fully updated eighteen months before I joined. The top twenty high-risk assets had not changed in three years — not because the risks had been mitigated, but because nobody had updated the probability scores. The first month with iFactory, the AI engine recalibrated probability scores against actual work order data and inspection histories. Eight assets that had never appeared in the top twenty suddenly ranked in the top ten. One of them was a stormwater pump station whose probability score had been sitting at 2 for two years. The actual condition data showed it was operating at 40% of rated capacity with a failure probability of 4. We repaired it the following week. The original register would not have flagged it for another nine months.
— Director of Infrastructure Operations, Metropolitan Public Works Authority — 22 Years Managing Infrastructure Risk
Conclusion
The infrastructure asset risk register is one of the most important management tools an operations director has. It is also one of the most consistently outdated. Built on inspection cycles measured in months and probability assessments measured in subjective judgment, the static register provides a defensible framework for risk scoring but an unreliable picture of which asset is going to fail next. In an era when the US faces a $3.7 trillion infrastructure investment gap, when reactive repairs cost 3 to 9 times more than planned maintenance, and when 46% of global infrastructure assets are over 40 years old, the cost of a stale risk score is not a documentation problem — it is a safety, financial, and operational liability that compounds with every week the register goes unrefreshed.
iFactory transforms the static risk register into a living risk management system. AI-calibrated probability scores update continuously from IoT sensor data, work order histories, mobile inspection reports, and external condition feeds. Dynamic consequence scoring adjusts automatically when land use, population density, or network dependencies change. Real-time risk calculation generates escalation alerts the moment an asset crosses a threshold — not the next time someone opens the spreadsheet. And capital prioritisation is linked directly to current risk-weighted scores, so every maintenance and capital dollar is allocated against the assets that need it most at the moment the decision is made. Book a Demo to see how iFactory connects your existing risk register data to AI probability and consequence engines, or talk to an expert about configuring a live risk register pilot for your highest-criticality asset class.
Frequently Asked Questions
iFactory imports existing risk register data from spreadsheets, databases, and asset management systems through a standardised data ingestion process. Existing asset records, condition scores, consequence ratings, and risk rankings are preserved and mapped into the iFactory risk register structure as the baseline. Once imported, the AI probability engine begins overlaying its continuous recalibration on top of the existing scores — generating updated probability estimates based on available condition data, work order histories, and sensor feeds without requiring manual re-entry of existing information. The legacy consequence scores are retained as the starting point and updated dynamically as GIS, land-use, and network dependency data becomes available. For organisations that need to maintain parallel reporting for regulatory or audit reasons, iFactory can export risk register data in the format required by existing compliance frameworks. Talk to an expert about your specific data landscape and integration requirements.
iFactory's AI probability calibration ingests three tiers of data: organisation-specific data including work order histories, inspection records, sensor telemetry, and known failure events for the assets in your portfolio; peer-aggregated anonymised failure pattern data from similar asset classes across the iFactory user base, which provides statistical reference points for asset types that have not yet failed in your portfolio but have failed in comparable operating contexts; and industry-standard deterioration curves and failure probability distributions for each asset class, drawn from published research, manufacturer data, and engineering standards. For asset classes with limited or no failure history in your portfolio, the AI model uses Bayesian inference that starts with the industry-standard prior probability distribution and updates it as your specific data accumulates. This means the probability score becomes more accurate over time as your asset-specific failure pattern data grows, but it never starts from zero — the model always has a defensible baseline derived from the broader population of similar assets. Book a Demo to see the probability calibration interface configured for your asset classes.
iFactory's consequence scoring supports multi-dimensional scoring where each asset can be assigned consequence profiles across multiple operating contexts. A flood control asset, for example, has a different consequence score in the dry season when its failure would have minimal impact than in the wet season when its failure could cause catastrophic flooding. The platform ingests seasonal calendars, weather forecasts, and hydrological data to adjust consequence scores dynamically based on the current operating context. Similarly, an asset that serves both emergency services routing and commercial traffic receives separate consequence scores for each function, with the higher of the two determining its risk ranking for capital prioritisation purposes. The system supports up to five simultaneous consequence dimensions per asset, each with its own data feed, update frequency, and weight in the composite risk score. Talk to an expert to configure multi-dimensional consequence scoring for your specific asset classes.
Not every asset in the infrastructure portfolio requires or has continuous sensor monitoring. iFactory's probability engine tiers its data inputs by availability and reliability. For assets with IoT sensors, the probability score is updated in real time from the sensor telemetry stream. For assets with periodic inspection data only, the probability score is calculated from the most recent inspection condition score combined with the asset's age, class-specific deterioration curve, and work order history — and updated whenever a new inspection report is submitted through the mobile inspection module. This approach means that assets without sensors still benefit from AI-calibrated probability scoring that is more consistent and objective than manual estimation, while the highest-criticality assets with continuous monitoring produce the most granular probability timeline. As sensors are added to additional assets over time, the probability engine seamlessly incorporates the new data stream into its existing calibration. Book a Demo to see how the probability engine works for mixed portfolios with varying data availability.
Your Risk Register Is Outdated the Moment the Data Stops Flowing. iFactory Keeps It Current Every Second.
AI-calibrated probability scores, dynamic consequence assessment, real-time risk escalation, and capital prioritisation linked to current risk. The living risk register your infrastructure portfolio has been waiting for.