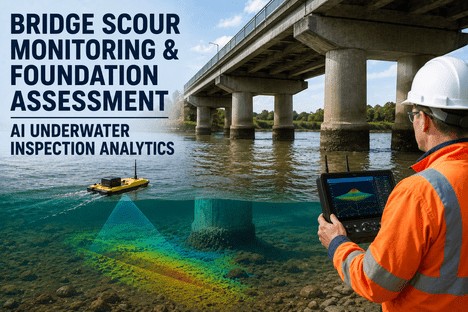
Scour is one of the leading causes of bridge failure in the world, and it is also one of the hardest failures to see coming, because the damage happens underwater, around a foundation nobody can walk up to and inspect during the exact conditions that cause it. A pier can look structurally sound from the deck while the riverbed material supporting its footing has already washed away several feet below the surface, and the first visible sign is sometimes the bridge itself. Routine visual inspections, typically conducted on a two-year cycle, tell you almost nothing about scour depth during the flood event that actually caused it, since the scour hole often refills with sediment once flow recedes, hiding the evidence by the time an inspector arrives. Bridge and water resource engineers have long known that scour risk needs to be tracked continuously rather than periodically, and AI-driven scour analytics from iFactory turn sonar, water level, and structural sensor data into a live, updated foundation risk picture, with the underlying methodology available through iFactory's support team.
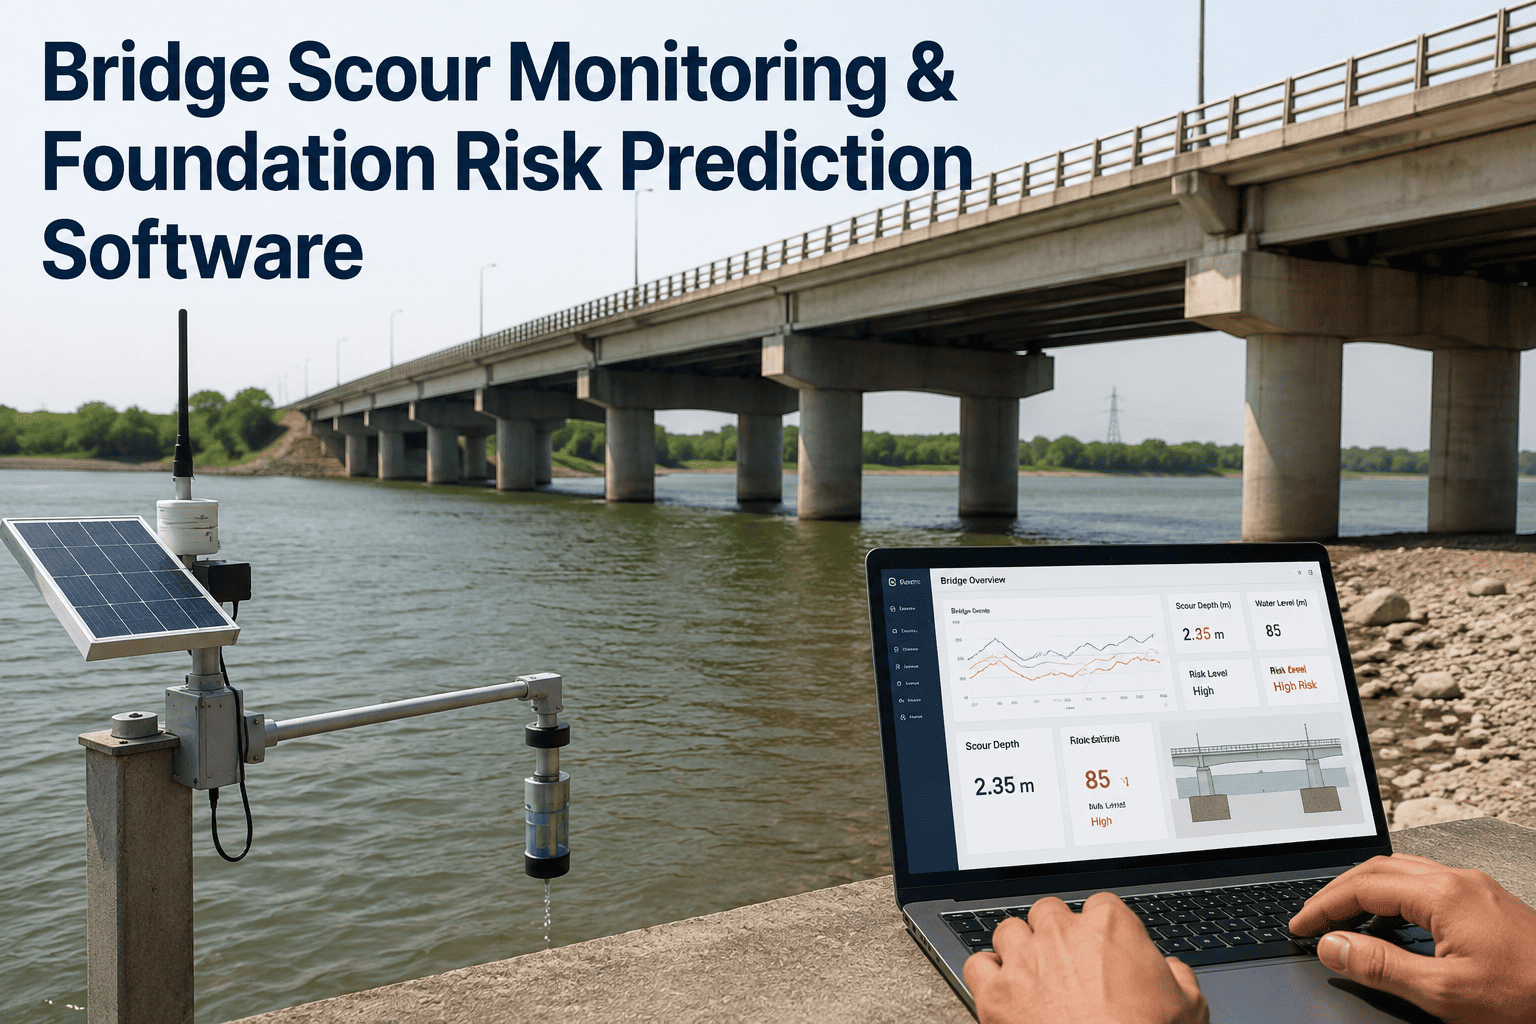
Bridge Scour Monitoring & Foundation Risk Prediction Software
Continuously monitor riverbed elevation, water level, and structural response around every monitored pier and abutment, and let AI models flag foundation risk before a flood event turns a developing scour hole into a structural emergency.
Why Scour Is the Silent Bridge Failure Mode
Most structural risks to a bridge accumulate slowly and leave visible clues along the way — spalling concrete, corroding rebar, cracked welds. Scour does the opposite. A pier foundation can lose several feet of supporting riverbed material during a single high-flow event that lasts only hours, and by the time the water recedes and an inspector can safely access the site, sediment has often partially or fully refilled the scour hole, masking exactly how deep it went and how close the foundation came to failure. This is precisely why relying on visual inspection and water level alone gives engineers a rough, unreliable estimate of true scour risk. Continuous instrumentation is the only way to actually capture what happened at the moment it mattered, rather than reconstructing it afterward from indirect evidence.
The consequence of getting this wrong is not a minor maintenance delay — it is one of the more severe structural failure modes a transportation agency can face, precisely because it tends to strike without the gradual warning signs that give engineers time to plan a response. A bridge that has been rated structurally sound based on its most recent biennial inspection can still be at genuine risk if that inspection happened to fall between two significant flood events, since neither the pre-flood baseline nor the post-flood refill state necessarily reflects what the foundation actually experienced during peak flow. Agencies that have experienced a scour-related failure or near-failure typically describe the same pattern afterward: the data that would have shown the risk developing existed somewhere, whether in a gauge reading, a flow forecast, or a partial field observation, but it was never fused into a single picture in time to act on it.
Sensor Layers That Build a Complete Scour Picture
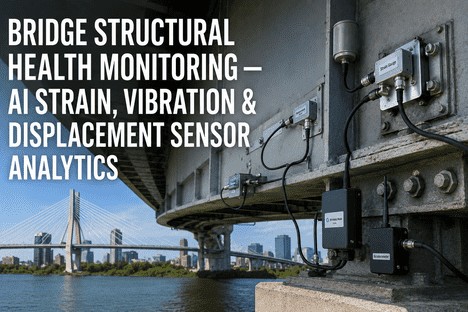
No single sensor type tells the whole scour story on its own, which is why a reliable monitoring system fuses several complementary measurement layers into one foundation risk model rather than depending on any one signal in isolation.
What Happens Before, During, and After a Flood Event
Scour risk is not constant — it spikes sharply during high-flow events and then partially resolves as water recedes and sediment redeposits. A monitoring system only earns its keep if it behaves differently across these three phases, shifting from routine baseline tracking to active early warning and back to post-event verification.
Why Fused Sensor Data Beats Any Single Measurement
It is tempting to treat scour depth as the single number that matters, but relying on sonar readings alone leaves an engineer guessing at exactly the moments when guessing is most dangerous. A scour hole can appear deep on a sonar reading simply because turbulent flow is temporarily suspending sediment near the transducer, or it can appear shallow because loose, unconsolidated material has partially refilled a hole that still leaves the foundation genuinely undermined underneath. Tilt and vibration data cut through that ambiguity because they measure the structure's actual physical response rather than an indirect proxy for it — a pier that has not moved and whose modal frequency has not shifted is structurally sound regardless of what the bed elevation reading alone might suggest, and a pier showing early tilt or frequency drift deserves urgent attention even if the sonar reading looks borderline.
This is the core reason iFactory's foundation risk model is built as a fused, multi-sensor score rather than a single-channel alert system. Each sensor type contributes a different piece of evidence, and the combined model is deliberately built to weight structural response signals more heavily than bed elevation alone when the two disagree, since a moving pier is unambiguous evidence of a real problem in a way that a single noisy sonar reading is not. Over time, as more flood events are logged and verified against post-event survey data, the model's weighting for a given bridge is refined further, so the risk score for a structure that has been monitored through several flood seasons becomes increasingly specific to how that particular pier, soil type, and river geometry actually behave under stress.
Risk Tiers and the Action Each One Triggers
A raw scour depth number means little on its own — what matters is how that depth compares to the foundation's design tolerance and how quickly it is trending. iFactory's risk model translates continuous sensor data into the same tiered structure bridge engineers already use for inspection ratings, so the output slots directly into existing asset management workflows.
| Risk Tier | Signal Pattern | Recommended Action | Review Timing |
|---|---|---|---|
| Stable | Bed elevation and structural readings within historical baseline range | Continue routine monitoring interval | Standard cycle |
| Developing | Bed elevation dropping steadily during elevated flow | Increase sonar sampling rate, notify duty engineer | Within 24 hours |
| Elevated | Scour depth approaching design tolerance threshold | Dispatch field inspection, prepare countermeasure plan | Within hours |
| Critical | Tilt or modal frequency shift combined with deep scour reading | Restrict or close bridge, emergency structural assessment | Immediate |
Visual inspection cycles and post-flood surveys tell you what happened after the danger has already passed. iFactory's AI scour analytics fuse sonar, tilt, vibration, and flow data into a live foundation risk score, so your engineers know a problem is developing while there is still time to act on it.
Rolling Out Monitoring Across a Bridge Network Without Disrupting Traffic
Instrumenting a bridge pier for continuous scour monitoring does not require closing lanes or taking the structure out of service. Sonar transducers and tiltmeters are typically mounted from the pier face or deck using arms and brackets designed for installation during normal maintenance access windows, and telemetry equipment is housed in weatherproof enclosures on the deck or abutment rather than requiring permanent construction. For a network of scour-critical structures, the practical rollout question is rarely whether a given bridge can be instrumented — it almost always can be — but which structures should be prioritized first given limited budget and installation crew time in a given construction season.
iFactory's onboarding process starts with a structured review of your existing scour-critical bridge inventory, cross-referencing scour rating, structure age, traffic volume, and detour cost if the bridge were to be closed unexpectedly. That combined score produces a prioritized instrumentation list rather than a purely age-based or purely rating-based one, since a moderately-rated bridge carrying a critical evacuation route or a high daily traffic count may warrant earlier monitoring than an older but lower-consequence structure. Most agencies phase the rollout across two or three construction seasons, instrumenting the highest-priority tier first, validating the sensor performance and alerting workflow against a real flood season, and then expanding coverage to the next tier once the process has been proven internally.
Data from every instrumented bridge flows into the same platform regardless of when it was added to the program, so engineers managing a growing network do not need to learn a new system each time a new structure comes online. Historical bathymetry and inspection records from bridges not yet instrumented can also be loaded in, giving planners a network-wide view of relative scour risk even for structures where live sensor data is not yet available, which is often useful for justifying the next phase of the instrumentation budget to agency leadership.
A DOT Bridge Engineer on Managing Scour at Scale
What Continuous Data Adds to a Scour Countermeasure Program
Countermeasure decisions — riprap placement, sheet pile installation, grout bag armoring — have traditionally been made from a combination of design-stage hydraulic modeling and periodic post-event survey data, both of which describe what a river channel is expected to do or has already done rather than what is happening in real time. Continuous monitoring data changes the basis for those decisions in two practical ways. First, it lets engineers validate whether a countermeasure already installed at a given pier is actually performing as designed across multiple flood events, rather than assuming it is working simply because the bridge has not failed. Second, it gives engineers a genuine before-and-after comparison at the same structure, since the exact same sensor array that logged conditions before a countermeasure was installed continues logging afterward, producing a direct performance record rather than a comparison across two different inspection methods separated by years.
Frequently Asked Questions
Visual inspection cycles and post-flood surveys tell you what happened after the danger has already passed. iFactory's AI scour analytics fuse sonar, tilt, vibration, and flow data into a live foundation risk score, so your engineers know a problem is developing while there is still time to act on it.