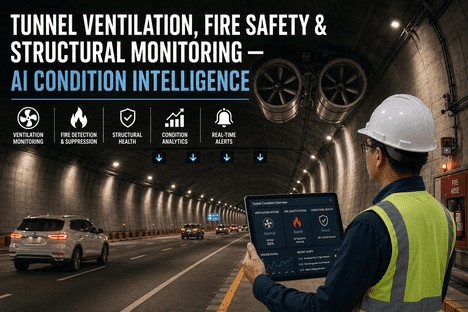
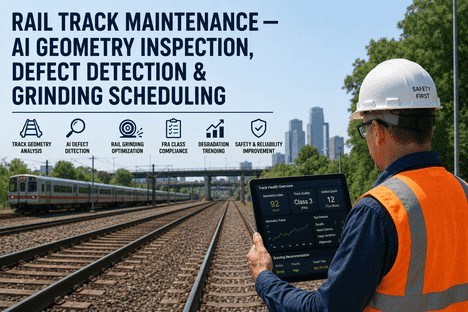
A railway tunnel rarely fails without warning, but the warning usually shows up as a damp patch on the lining, a hairline crack near a joint, or a slow rise in invert groundwater long before anyone treats it as a structural signal. Water intrusion is the single most common early indicator of tunnel deterioration, and it is also the easiest one for a maintenance team to miss when inspection still depends on a technician walking the bore with a torch and a notepad twice a year. Between scheduled walkthroughs, seepage patterns shift, lining voids grow, and drainage systems silently lose capacity, all while the tunnel keeps carrying trains on a schedule that leaves almost no room for reactive closures. Continuous condition monitoring changes that picture by turning water intrusion and structural drift into data the moment they start, instead of a discovery made on the next scheduled walk. Rail infrastructure teams evaluating how this fits their own tunnel network can start by reaching out to iFactory support.
Every Tunnel Has a Drip Before It Has a Defect. Most Networks Just Aren't Listening Yet.
iFactory connects moisture, strain, and displacement sensors across your tunnel network into one continuous monitoring model, so a seepage pattern or a lining shift shows up as a tracked trend weeks before it becomes an emergency possession.
The Signals Your Tunnel Is Already Sending Between Inspections
A scheduled walkthrough captures a single moment in a tunnel's life, and the months between two of those moments are exactly when seepage paths widen, voids behind the lining grow, and drainage capacity quietly erodes. None of that shows up on a report until someone happens to be standing in the right spot at the right time.
Efflorescence and Damp Staining
Mineral staining on the lining surface signals water has already been moving through the concrete for some time, usually well before it is noted on a visual inspection log.
Rising Invert Groundwater
A slow climb in groundwater level around the invert often precedes drainage system overload, particularly during seasonal rainfall when sump capacity is already stretched thin.
Joint and Construction Seam Seepage
Segmental joints and construction seams are the most common seepage entry points, and a change in flow rate at one joint frequently indicates movement at the lining behind it.
Micro-Displacement at Crown or Springline
Small, gradual shifts in lining position at the crown or springline rarely trigger a visible alarm, but they are frequently the earliest measurable sign of a developing void.
Walking the Bore vs Watching It Continuously
Most rail tunnel networks still rely primarily on periodic walkthroughs supplemented by the occasional geotechnical survey, and that approach was reasonable when tunnels were newer and traffic density was lower. Neither of those conditions describes most operating networks today.
Tunnel Lining Defects and the Warning Window Each One Gives
Not every defect develops at the same pace, and knowing the difference is what separates a planned repair from an emergency possession. Some patterns unfold over weeks of gradual change; others narrow to days once groundwater conditions shift.
| Lining Defect | Typical Cause | Monitoring Signal | Risk if Undetected |
|---|---|---|---|
| Joint Seepage | Gasket wear, seam movement | Localized moisture and flow rate increase | Progressive washout, reduced lining bond |
| Crack Propagation | Load cycling, ground movement | Strain gauge drift beyond baseline | Reduced structural capacity, spalling risk |
| Void Behind Lining | Grout loss, erosion over time | Displacement trend at crown or springline | Sudden localized collapse potential |
| Invert Heave or Settlement | Groundwater pressure change, ground swelling | Vertical displacement and pore pressure shift | Track geometry deviation, ride quality loss |
| Drainage System Overload | Sediment build-up, seasonal inflow | Sump level and flow rate trend | Standing water, accelerated lining deterioration |
A Damp Patch on a Monthly Report Is Not the Same as a Tracked Trend
iFactory turns tunnel sensor data into a running condition model for every chainage in your network, so drift gets caught and scheduled long before it reaches an inspection report.
Which Tunnel Types This Applies To
Tunnel age, construction method, and geology all shape how water intrusion develops, and a monitoring program adapts to whatever structure and instrumentation already exist rather than requiring a full retrofit first.
Bored Rock Tunnels
Groundwater pressure and fracture flow through surrounding rock are the dominant seepage drivers, tracked through pore pressure and joint moisture sensors.
Cut-and-Cover Urban Tunnels
Shallow urban tunnels see more surface water infiltration and utility interaction, so the model weighs seasonal rainfall and adjacent construction activity heavily.
Immersed and Underwater Crossings
Segment joint integrity is the primary concern here, with continuous seepage and displacement tracking at every segment interface along the crossing.
Aging Legacy Tunnels
Older bores built without embedded instrumentation still benefit from retrofit sensor deployment focused on known problem chainages identified by prior inspection history.
Why Water Intrusion Data Belongs in Your Asset Management Plan
Most rail asset registers track a tunnel's structural condition and its drainage performance as two separate line items, reviewed on different schedules by different teams. That separation misses the relationship between them, because rising groundwater and drainage strain are frequently the earliest measurable driver behind a lining defect that later shows up as a structural finding. Folding continuous water intrusion data into the same asset management plan that already tracks lining condition, geometry, and clearance gives planners a single, current picture of tunnel health instead of two partial ones that only get reconciled once a year during the capital planning cycle. It also gives budget owners something concrete to point to when arguing for a grouting repair now instead of a full relining project later, since a documented trend line is a far stronger case for early intervention funding than a description of visible staining written up after the fact. It also helps prioritize capital spend fairly across a network, since chainages can be ranked by measured trend severity instead of by which tunnel happened to get walked most recently.
From a Sensor Reading to a Scheduled Possession
A trend line that only lives on a dashboard doesn't protect a tunnel network from an emergency closure. The value only materializes once a detected drift becomes a planned work order on a calendar someone actually works from.
Distributed Sensor Network
Moisture sensors, strain gauges, piezometers, and displacement monitors are placed at chainages identified from prior inspection history and known geotechnical risk zones.
Zone-Specific Baseline
Each chainage gets its own behavior baseline instead of one fixed threshold applied across the whole tunnel, since a portal zone and a mid-bore crown behave very differently.
Continuous Drift Detection
Live readings are compared against each zone's baseline around the clock, surfacing gradual seepage or displacement trends long before they cross a fixed alarm threshold.
Risk-Ranked Failure Window
Detected drift is converted into a specific predicted risk window for that chainage, ranked against every other flagged zone across the network.
Scheduled Work Order
The prediction is pushed into your maintenance system as a scheduled inspection or repair task, timed against actual possession windows instead of sitting in an unread report.
A Composite Scenario: The Joint Leak That Never Reached the Track Bed
A regional rail operator's tunnel network had a recurring pattern of joint seepage near a mid-bore chainage on one of its older bores, historically discovered only when standing water reached the ballast during heavy seasonal rainfall. After moisture and flow sensors were installed across the suspect joint run and connected to a continuous monitoring model, the system flagged a rising seepage trend fourteen days before rainfall volumes were forecast to peak for the season.
The maintenance team scheduled a grouting repair during a planned overnight possession, coordinated around freight and passenger timetables with weeks of notice instead of an emergency slow order, and closed the joint before the seasonal rainfall arrived. When the seasonal peak did hit, the repaired joint held with no measurable seepage increase, while two other network chainages that had not yet been instrumented saw standing water reach the drainage channel as they had in prior years.
Mistakes Rail Networks Make With Tunnel Water Management
Treating Seepage as Cosmetic
Staining and minor drips often get logged as a maintenance note rather than a structural signal, delaying attention until the underlying joint or void has grown considerably.
Inspecting on a Fixed Calendar Only
Annual or biannual inspection cycles miss seasonal seepage spikes entirely if the scheduled visit happens to fall outside the wet period when the risk is highest.
Instrumenting Only the Worst Chainage
Focusing sensors on one known problem area leaves the rest of the bore blind to a new defect forming somewhere the team wasn't already watching.
Separating Drainage Data from Structural Data
Groundwater and drainage readings are usually tracked apart from strain and displacement data, missing the correlation between rising water and lining movement.
Is Your Tunnel Network Ready for Continuous Monitoring
You can name the chainages with a history of seepage or staining
If maintenance and inspection teams already agree on the recurring problem spots, that list is the right starting scope for initial sensor deployment.
Your network has some existing inspection and geotechnical history
Past inspection reports and geotechnical survey data speed up baseline modeling considerably, though a model can still be built from fresh instrumentation alone.
Your maintenance system can accept scheduled work order triggers
A prediction only becomes protection once it can generate or flag a task directly, rather than requiring someone to manually translate a chart into a possession request.
Leadership is willing to act on a predicted trend, not just a failed inspection
The program only pays off if planned work gets scheduled off the forecast instead of waiting for the next scheduled walkthrough to confirm the defect.
Frequently Asked Questions
How is continuous monitoring different from our current inspection schedule?
A scheduled walkthrough or geotechnical survey captures a single snapshot of tunnel condition, and everything that happens between two visits stays invisible until the next one. Continuous monitoring instead tracks moisture, strain, and displacement data around the clock at each instrumented chainage, comparing live readings against that zone's own baseline so drift gets flagged as it develops rather than after it has already progressed for months. Teams can see this comparison mapped against their own network by contacting iFactory support.
Do we need to instrument the entire tunnel network at once?
No, most deployments start with the chainages already flagged by inspection history or known geotechnical risk, then expand coverage once the model has proven out on that initial scope. This keeps the first phase focused on the areas most likely to produce an early warning worth acting on, rather than spreading limited sensor budget thin across an entire network on day one.
What kind of sensors does this rely on, and do we need new hardware?
The model works with the moisture, strain, displacement, and pore pressure data your existing instrumentation already produces where available, and layers additional sensors only at chainages that currently lack the readings needed for an accurate trend. Most networks combine some existing geotechnical monitoring equipment with targeted new sensor placement rather than a full instrumentation replacement.
How much advance warning can we realistically expect before a defect worsens?
Warning windows vary by defect type, ranging from roughly three to six weeks for gradual issues like joint seepage or crack propagation down to under two weeks for faster-developing conditions like drainage overload during heavy rainfall. The model produces a specific predicted window for each flagged chainage rather than a single fixed number, since the exact lead time depends on which pattern is developing at that location.
How does a detected trend actually turn into a scheduled repair?
Once a chainage is flagged, the prediction is pushed directly into your maintenance system as a scheduled task with the affected location, likely defect type, and a recommended possession window already attached, instead of sitting in a report someone has to remember to review. Book a demo to see how this workflow is typically scoped for a first deployment across a tunnel network.
Catch the Seepage Before It Becomes a Possession Emergency
iFactory builds a continuous condition model around your tunnel network's actual chainages, turning moisture, strain, and displacement data into early warnings and scheduled maintenance work before water intrusion becomes a structural problem.