A rural county bridge built in 1955 carries a posted weight limit of 18 tons. The local grain elevator receives its largest shipments in October. Every truck leaving the facility during harvest season exceeds the posted limit by 4 to 8 tons. The legal detour adds 37 kilometres each way. For the 200 trucks that make the trip during a two-week harvest window, the additional distance costs the cooperative USD 18,000 in fuel and driver time — and every one of those trucks passes over three other posted bridges on the detour route that are in no better structural condition than the bridge the detour was meant to protect. Meanwhile, the bridge engineer managing the county's 64 posted bridges has no automated system to check whether the permit vehicles requesting access to the network are actually compatible with the posted limits on their declared route. Each permit is evaluated manually — bridge by bridge, axle configuration by axle configuration, using paper load rating charts and a calculator — or routed through a system that can only check load capacity against a single standard vehicle type. The asset manager knows that some of the bridges in the network are stronger than their posted limit suggests because the posting was based on a conservative analysis that has not been updated since the bridge was rated 15 years ago. And some bridges are weaker than their posted limit suggests because the inspection since the last rating revealed section loss that was never reflected in the load rating database. The gap between the posted limit and the actual capacity is the structural and commercial risk that defines bridge load management in every asset manager's portfolio — and AI-powered load analysis is the tool that closes it.
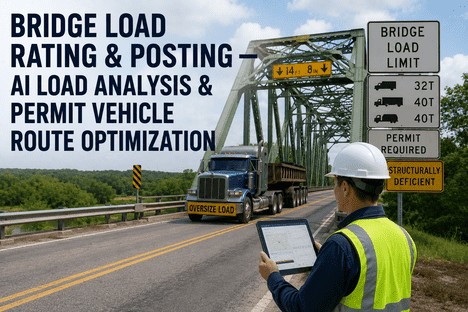
The Bridge Has a Posted Limit. The Truck Has a Permit. The Route Has a Detour. AI Ensures All Three Are Based on the Same Data.
iFactory's AI-powered load rating platform connects bridge capacity data, posting limits, and permit vehicle routing into a single system — so asset managers approve permits with confidence that the load matches the bridge, and trucking operators get routes that minimise detour cost without exceeding safe capacity.
The Economics of Bridge Posting — What Every Posted Bridge Costs the Network
A bridge posting is a safety measure that becomes an economic event. When a bridge is restricted to a load below the legal maximum truck weight, every heavy vehicle that would have crossed it must either detour, reduce its load, or exceed the posted limit illegally. The economic cost of posting is distributed across three categories that the asset manager must balance against the cost of strengthening or replacing the bridge — and the balancing calculation is only as accurate as the load rating data that determines whether the posting is necessary in the first place.
Direct Cost Per Posted Bridge
USD 18,000–45,000
Annual detour cost imposed on trucking operators per posted bridge in a rural county network — based on additional distance, fuel, and driver time for the average daily truck traffic that must reroute around the restriction.
Network-Level Impact
75,000+ Jobs
Projected job losses by 2036 in a single US state due to cumulative bridge weight restrictions increasing freight costs, reducing business competitiveness, and forcing supply chain reconfiguration around posted routes.
Permit Revenue Gap
2–14 cents / ton-mile
Range of damage cost recovery per ton-mile across different permit fee structures — compared to estimated actual infrastructure damage ranging from USD 0.33 per ton-mile in integrated studies covering both pavement and bridge deterioration.
The Load Rating Lifecycle — Five Stages That Define Every Bridge's Relationship With Heavy Vehicles
Every bridge that carries traffic over water or a roadway passes through five distinct stages in its relationship with vehicle loads. The asset manager's ability to manage the bridge inventory depends on how accurately each stage is documented, how frequently it is updated, and whether the data from each stage flows into the next without manual re-entry or reinterpretation. The following vertical flow represents the lifecycle that every bridge in the load rating inventory follows — and the points at which the current manual process introduces the delays and inaccuracies that AI-powered load analysis eliminates.
01
Initial Load Rating
The bridge is rated using AASHTO LRFR or LFR methods based on design plans, material properties, and section dimensions. The rating produces an inventory rating factor and an operating rating factor for each vehicle type — typically H-15, H-20, HS-20, Type 3, Type 3S2, and Type 3-3. The lower of the two determines the posting limit. The rating is stored in the agency's bridge management system as a static record that is not updated until the next scheduled re-rating cycle, which can be 5 to 15 years later.
Every 5–15 years
02
Posting Determination
When the operating rating factor for legal loads falls below 1.0, the bridge must be posted with a weight limit. The posting limit is calculated from the lowest-rated member and the governing vehicle type. State DOTs and county agencies post approximately 7 to 10 percent of the national bridge inventory. The posting sign displays the maximum gross vehicle weight and may include axle configuration restrictions. A bridge that is posted but has not been re-rated in 10 years may carry a limit that is either unnecessarily conservative or unsafely liberal — and the asset manager has no data to determine which.
7–10% of bridges
03
Permit Vehicle Evaluation
When a trucking operator applies for an overweight permit, the route must be evaluated for every bridge the vehicle will cross. The evaluation compares the permit vehicle's axle configuration and gross weight against each bridge's load rating. Current practice in many agencies involves manual lookup from load rating tables or batch processing through AASHTOWare BrR. For a route with 12 bridges and a permit vehicle with 7 axles, a manual evaluation requires 84 individual member checks — and the result is valid only if the load rating data for every bridge on the route is current. Thirty US states now use automated permit systems, but the bridge load data feeding those systems is often updated on a schedule that lags behind field conditions.
30 states automated
04
Route Optimisation and Compliance
For the permit to be approved, the vehicle must follow a route where every bridge can support its weight — or a route where the bridges that cannot support it are avoided. Route optimisation selects the path that minimises travel distance, detour cost, and the number of bridges requiring individual evaluation, while respecting posting limits, vertical clearances, road width restrictions, and temporary construction closures. Current systems optimise for distance and clearance but typically lack the ability to incorporate real-time load rating updates or to compare multiple permit vehicle configurations against the same bridge set to find the optimal load distribution for a given trip.
Real-time gap
05
Re-Rating and Limit Adjustment
When a bridge is re-rated — because of a scheduled cycle, a structural change, or a permit request that triggers a refined analysis — the new rating factor may increase or decrease the posting limit. Refined analysis using 3D finite element modelling typically increases the rating factor by 15 to 20 percent compared to the AASHTO line-girder method, which is often enough to move a bridge from posted to open status. AI-powered load analysis accelerates this process by predicting refined rating factors from available bridge parameters, enabling the asset manager to identify which posted bridges are most likely to have their posting removed through refined analysis — and target investigation resources accordingly.
15–20% uplift possible
The Three Barriers to Efficient Load Management — and How AI Addresses Each One
Every asset manager managing a bridge inventory with posted bridges and permit vehicles faces the same three structural barriers. These barriers are not caused by a lack of engineering skill — they are caused by a mismatch between the volume of data that accurate load management requires and the manual or semi-automated processes that most agencies use to process it.
Barrier 01
Stale Load Rating Data
Load ratings are updated on cycles of 5 to 15 years. In the interval, section loss from corrosion, impact damage from vehicle strikes, and deterioration of bridge members can reduce actual capacity by 10 to 25 percent below the rated value. The asset manager approves permits against a rating that no longer reflects the bridge's actual condition — or maintains a posting that was conservative when calculated but is now unnecessarily restrictive because the structure has been rehabilitated and the rating was never updated. AI addresses this by continuously correlating inspection condition data with rating parameters, flagging bridges where the gap between rated capacity and estimated current capacity exceeds a configurable threshold, and prioritising those bridges for re-rating.
AI fix: Continuous condition-to-rating correlation with re-rating priority alerts.
Barrier 02
Manual Permit-to-Bridge Matching
Each permit request requires matching the specific axle configuration, axle spacing, and gross vehicle weight of the permit vehicle against the load rating of each bridge on the proposed route. A single permit with a 7-axle truck on a route with 15 bridges requires 105 individual member evaluations. Agencies processing 500 to 2,000 permits per month must either maintain a large engineering staff dedicated to permit evaluation or accept evaluation backlogs that delay permit issuance by days or weeks. AI automates this matching process: the permit vehicle configuration is compared against the bridge rating database in milliseconds, and the system returns a pass-fail result for each bridge on the route with the governing member and load effect identified.
AI fix: Automated axle-by-axle, bridge-by-bridge permit evaluation in milliseconds.
Barrier 03
Detour Cost Without Optimisation Data
When a bridge is posted below the legal load, trucks that would cross it must detour. The asset manager knows the posting exists but typically has no system to quantify the economic cost of that posting in terms of cumulative detour distance, fuel consumption, and time delay for the trucking operators who use the corridor. Without this data, the cost-benefit analysis for strengthening or replacing the posted bridge is incomplete — the cost of the intervention is known, but the benefit in terms of reduced detour cost is estimated from average daily truck traffic rather than calculated from actual permit and routing data. AI bridges this gap by tracking permit routes, identify the bridges that are the most frequent detour bottlenecks, and compute the detour cost that each posted bridge imposes on the network.
AI fix: Detour cost computed per posted bridge. Cost-benefit analysis for intervention based on actual routing data.
AI Load Model · Permit Bridge Matching · Route Score · Detour Cost Analytics
Every Permit Request Is a Set of Axle Loads Looking for a Route. AI Finds the Route Where Every Bridge Can Safely Carry Them.
iFactory connects posted bridge data, load ratings, and permit vehicle configurations into a single AI-powered routing engine — so asset managers issue permits faster, trucking operators pay less for detours, and every bridge on the route is protected from overloads that its current rating cannot support.
How AI-Powered Load Analysis and Route Optimisation Work — the iFactory Platform
The iFactory platform for bridge load management integrates three functional modules that correspond to the asset manager's core responsibilities: maintaining accurate load ratings, evaluating permit vehicles against those ratings, and optimising routes to minimise detour cost while respecting every bridge's capacity. Each module operates as a standalone function, and all three share a common data model that ensures the rating used for permit evaluation is the same rating displayed on the asset manager's dashboard and the same rating referenced in the permit document issued to the trucking operator.
Module 01
Load Rating Management
Centralised repository with AI-driven prioritisation for re-rating
The load rating module ingests existing rating data from AASHTOWare BrR, Pontis, or any standard bridge management system, creating a centralised repository of inventory and operating rating factors by vehicle type for every bridge in the network. The AI engine cross-references each bridge's rating data with its inspection history, condition ratings, and structural characteristics to identify bridges where the gap between the rated capacity and the estimated current capacity is most likely to have changed. Bridges flagged by the AI engine are prioritised for re-rating, with the system recommending whether a refined analysis — 2D or 3D finite element modelling that typically yields 15 to 20 percent higher rating factors — is likely to remove or reduce the posting. The module also tracks the effective date of each rating and generates alerts when a rating exceeds its configurable review period.
Centralised rating repository
AI re-rating priority engine
Refined analysis opportunity flagging
Module 02
Permit Vehicle Evaluation
Real-time axle-by-axle load matching against bridge ratings
The permit evaluation module accepts a permit vehicle configuration — axle count, axle spacing, axle weights, and gross vehicle weight — and compares it against the inventory and operating rating factors for each bridge on the proposed route. The comparison is performed at the member level: the module identifies the governing member for each bridge under the permit vehicle configuration, calculates the load effect ratio, and returns a pass-fail result with the governing member and the margin by which the vehicle passes or fails. For routes where the permit vehicle fails one or more bridges, the module identifies the failed bridges, the governing member, and the load reduction required for the vehicle to pass — information that the permit officer can communicate directly to the applicant to explore alternative vehicle configurations or route adjustments without starting the evaluation process from scratch.
Member-level load matching
Pass-fail with governing member ID
Load reduction advisory output
Module 03
Route Optimisation and Economic Analytics
Minimise detour cost while maximising bridge safety across the network
The route optimisation module computes the optimal route for a permit vehicle by minimising a weighted cost function that includes travel distance, detour time, bridge restriction penalties, road width and vertical clearance constraints, and temporary restriction events. The route cost function is configurable by the agency: some agencies prioritise minimising the number of bridges crossed, others prioritise minimising total travel distance, and others prioritise avoiding bridges with low condition ratings regardless of the posted limit. The module also maintains a historical route database that allows the asset manager to analyse network-level impacts — which bridges are the most frequent detour constraints, what the cumulative detour cost is per posted bridge per year, and which strengthening or replacement projects would deliver the greatest network-level reduction in detour cost. This analysis is the economic evidence that supports budget requests for bridge strengthening or replacement projects.
Configurable route cost weighting
Detour bottleneck identification
Network-level cost-benefit analytics
What the Asset Manager's Dashboard Shows — Four Views That Transform Load Management
The iFactory dashboard is designed around the specific information architecture that an asset manager needs to manage posted bridges, permit vehicle requests, and route optimisation across a network. Every view answers a question that the current disconnected system leaves unanswered: Which posted bridges in my network have the oldest load ratings and the highest probability of being unnecessarily restrictive? Which permit requests could be approved faster if the vehicle configuration were adjusted by one axle? And what is the economic cost of every posted bridge in my network, measured in detour dollars per year?
View 01
Posted Bridge Network Map with Rating Currency Status
A map-based view of all posted bridges in the network, colour-coded by the age of the current load rating. Bridges shaded green have ratings less than 3 years old. Yellow bridges have ratings 3 to 8 years old. Red bridges have ratings more than 8 years old — the zone where the rating is most likely to diverge from actual capacity. Each bridge card displays the current posted limit, the governing vehicle type, the inventory and operating rating factors, and the date of the last rating. The AI engine overlays a re-rating priority score on each bridge, calculated from the rating age, the condition rating trend, and the estimated probability that refined analysis would increase the rating factor above the posting threshold.
Action: Target re-rating resources to bridges where the rating is oldest and the probability of posting removal is highest.
View 02
Permit Evaluation Queue with Automated Bridge Matching
The permit queue displays all pending permit requests with the vehicle configuration, the proposed route, the current status, and the automated evaluation result. For each permit, the system has already performed the axle-by-axle, bridge-by-bridge comparison and displays a route-level pass-fail result. If the permit fails, the failed bridges are listed with the governing member and the load margin. The permit officer can select an alternative vehicle configuration from the system's recommendation list, adjust the route to avoid the failed bridges, or issue the permit with the condition that the vehicle avoids the failed bridges on the route. The evaluation result is generated in under one second for a typical route of 15 bridges, compared to 30 to 60 minutes for a manual evaluation.
Action: Approve or adjust permits in seconds with automated bridge-by-bridge matching and alternative route recommendations.
View 03
Detour Cost Dashboard — Per Bridge and Network-Wide
The detour cost view displays the cumulative economic impact of each posted bridge in the network. For each posted bridge, the system calculates the annual detour cost based on the average daily truck traffic that crosses the bridge, the additional distance of the detour route, the fuel cost per kilometre, and the driver time cost per hour. Bridges are ranked by total annual detour cost, and the system displays the cost-benefit ratio for each candidate strengthening or replacement project: the project cost versus the annual detour cost avoided. Below the per-bridge ranking, a network-wide summary shows the total annual detour cost imposed by all posted bridges, the number of bridges where strengthening would pay for itself in detour savings within 5 years, and the number of bridges where the posting could be removed through refined load rating analysis alone — without structural intervention.
Action: Build budget cases for bridge strengthening based on quantified detour savings, not estimated traffic counts.
View 04
Compliance and Audit Record Export
The compliance module aggregates every record required for FHWA load rating compliance and permit audit documentation. Each permit record contains the vehicle configuration, the complete route with every bridge evaluated and the evaluation result for each bridge, the date and time of evaluation, the rating data used for each bridge (including the rating date and method), and the permit document issued. The permit audit trail is exportable by permit number, date range, vehicle type, or bridge number. Each load rating record contains the rating method, the governing vehicle type, the inventory and operating rating factors, the date of the rating, and the engineer of record. The compliance export is generated in under 30 seconds for any date range or bridge subset and is formatted for direct submission to FHWA reviewers or inclusion in the bridge file for legal discovery purposes.
Action: Generate the complete permit and load rating compliance record for any bridge or any permit in 30 seconds.
"
We manage 84 posted bridges in a county with a significant agricultural economy. Every harvest season, we would get 300 to 400 permit applications from grain haulers and livestock carriers, and each one required a manual check against the bridge ratings on the declared route. Our permit officer could process about 15 permits per day. At peak season, the backlog stretched to three weeks. Farmers were either waiting or running illegally. The AI system changed this completely. Now the permit officer enters the vehicle configuration and the proposed origin and destination, and the system evaluates every bridge on every possible route in under two seconds. It returns a recommended route that avoids all bridges the vehicle would overload, and it calculates the detour cost so the hauler can see exactly what the restriction costs them. Our permit processing time dropped from three weeks to same-day issuance for 90 percent of applications. And for the first time, we have data showing that Bridge 34 on County Road 7 costs the local economy USD 26,000 per year in detour costs — a number we used to justify its replacement in the next capital budget cycle.
— County Asset Manager, Midwestern US — 84 Posted Bridges, Agricultural Freight Corridor
The Financial Case for AI-Powered Load Management
The return on investment for AI-powered load rating and permit routing is calculated across three dimensions that map directly to the asset manager's budget and operational performance targets. Reduced permit processing cost — from 30 to 60 minutes per manual evaluation to under one second per automated evaluation — frees engineering staff to focus on structural analysis and bridge preservation rather than data lookup. Increased permit revenue — faster processing encourages more haulers to apply for permits rather than travelling illegally, and accurate bridge-specific evaluation allows the agency to approve permits for bridges that are stronger than the conservative default rating suggests. And reduced detour cost — quantified at the bridge level and presented in the capital budget submission — strengthens the case for strengthening or replacement projects that would otherwise compete for funding against projects with more visible but less analytically supported benefit claims.
99%
Reduction in per-permit evaluation time — from 30–60 minutes for a manual bridge-by-bridge check to under one second for automated matching against the full network rating database.
15–20%
Increase in rating factor achievable through refined 3D finite element analysis compared to AASHTO line-girder methods — enough to remove or reduce the posting on a significant fraction of posted bridges.
3 Weeks
Peak-season permit processing backlog before AI deployment — reduced to same-day issuance for 90 percent of applications after deployment, eliminating the bottleneck that delayed harvest-season freight movements.
5x
Return on investment within the first permit season reported by agencies deploying automated permit evaluation with AI route optimisation — measured as permit revenue increase plus detour cost reduction versus platform cost.
Conclusion
Bridge load rating, posting, and permit vehicle management form a continuous data cycle in which every element depends on the accuracy and currency of every other element. A posting that is based on a 12-year-old rating may be unnecessarily restricting freight movement — or unsafely permitting loads that the bridge can no longer carry. A permit that is evaluated against a rating that has not been updated since the last inspection may approve a vehicle for a bridge that has lost 15 percent of its capacity to corrosion. And a route that optimises for distance without considering bridge-specific capacity data may send a fully loaded permit vehicle across the one bridge in the network that cannot support it. The cycle breaks when any of these data elements is stale, disconnected, or manually processed in isolation from the others.
AI-powered load analysis closes the gaps in this cycle by centralising the rating data, automating the permit-bridge matching process, and computing the economic impact of every posting decision. The asset manager sees not just which bridges are posted and which permits are pending, but which ratings are most likely to be outdated, which permits could be approved with a configuration adjustment, and which posted bridges impose the greatest economic cost on the network. The permit officer processes applications in seconds rather than hours. The trucking operator receives a route that is optimised for both safety and cost. And the capital budget submission includes quantified detour cost data that demonstrates the economic case for strengthening or replacing the bridges that are most costly to the local economy.
The industry evidence is consistent: agencies that deploy automated permit evaluation with real-time bridge rating data reduce permit processing time by over 90 percent, increase permit revenue by enabling accurate bridge-by-bridge evaluation that conservative default methods prevent, and generate the network-level economic data that transforms bridge load management from a reactive compliance function into a strategic asset management capability. The technology to connect load ratings, posting limits, and permit routes into a single AI-powered system exists now — and the agencies that deploy it are the ones that will manage their bridge inventories through increasing freight demand, aging infrastructure, and constrained budgets.
iFactory's AI-powered load rating platform is designed for asset managers who need to connect bridge capacity data, posting limits, and permit vehicle routing into a single system. Book a Demo to see the platform configured for your bridge inventory and permit vehicle profiles. Or talk to an expert about a free load management assessment for your highest-impact posted bridges and permit routes.
Frequently Asked Questions
The iFactory platform is designed to work with existing load ratings from the agency's bridge management system — AASHTOWare BrR, Pontis, or any standard BMS — not to replace the rating generation process. The platform imports inventory and operating rating factors by vehicle type for every bridge in the network and maintains them as the central repository for all permit evaluation and route optimisation functions. What the platform adds is the AI layer that cross-references rating data with inspection condition ratings, structural characteristics, and rating age to identify bridges where re-rating is most likely to change the posted limit. For bridges prioritised for re-rating, the platform integrates with AASHTOWare BrR or other rating software to track the re-rating workflow and update the repository when the new rating is completed. The platform can also incorporate rating factors from refined 3D finite element analysis when available, and it tracks which rating method was used for each bridge so the permit evaluation result includes the method information required for FHWA compliance. Talk to an expert about integration with your specific bridge rating system.
The permit evaluation module accepts any vehicle configuration — axle count, axle spacing, individual axle weights, and gross vehicle weight — regardless of whether it matches a standard AASHTO vehicle type. The system converts the permit vehicle into an equivalent load effect on each bridge by calculating the moment and shear envelopes for the specific axle configuration and comparing them against the rating factor envelopes stored for each bridge. For bridges where the rating was performed for standard vehicle types only, the system interpolates between the rating factors of the two standard vehicles that bracket the permit vehicle's load effect, applying a safety factor calibrated to AASHTO MBE guidance for permit load evaluation. This interpolation approach allows the system to evaluate non-standard vehicle configurations against bridges that have only been rated for standard vehicles, without requiring a new rating for each permit request. If the permit vehicle is significantly heavier or longer than any standard vehicle type in the bridge's rating set, the system flags the bridge for refined permit analysis and provides the load effect data needed to perform that analysis in AASHTOWare BrR. Book a Demo to see the permit evaluation engine configured for your typical vehicle types.
Yes. The platform distinguishes between permit types in both the evaluation logic and the routing algorithm. Single-trip permits are evaluated against operating rating factors with the AASHTO MBE permit load factors for routine or special permits, depending on the vehicle weight relative to the legal limit. Annual or multi-trip permits are evaluated against a more conservative threshold that accounts for the cumulative fatigue effect of repeated crossings — typically using a factor that reduces the allowable load effect by 10 to 20 percent compared to the single-trip evaluation. The route optimisation algorithm also treats permit types differently: single-trip permits may be routed through a bridge with a low safety margin if the vehicle passes the evaluation, while annual permits are routed to maximise the margin of safety across all bridges on the route to account for the higher number of crossings. The permit type is displayed on every evaluation result and on the permit document issued to the carrier, so the trucking operator understands whether the approved route is valid for a single crossing or for repeated trips under an annual permit. Talk to an expert about configuring permit type evaluation parameters for your agency's permit categories.
The detour cost calculation accounts for the specific vehicle types and axle configurations affected by each posting. A bridge posted at 18 tons for a 3-axle single-unit truck but open to 32 tons for a 5-axle tractor-semi-trailer combination imposes detour cost only on the vehicle types that exceed the posted limit. The platform's detour cost model uses the vehicle classification distribution from weigh-in-motion data or traffic count data to determine which vehicle types in the traffic stream are affected by each posting. For each affected vehicle type, the system calculates the number of vehicles per day that must detour, the additional distance and time of the detour route, the fuel cost per kilometre, and the driver time cost per hour — and aggregates these into an annual detour cost for the bridge. The result is a detour cost that reflects the actual traffic composition, not a generic cost per heavy vehicle. For bridges where the posting applies only during specific seasons — for example, spring load restrictions on thaw-weakened roads — the detour cost calculation is prorated for the restriction period only. Book a Demo to see the detour cost model configured for your traffic data and posting schedule.
The platform integrates with weigh-in-motion sites through standard data exchange protocols — XML, CSV, or API — to ingest axle weight, axle spacing, gross vehicle weight, and vehicle classification data for trucks crossing each bridge on the network. The WIM data is used for two purposes. First, it validates that permit vehicles are travelling within their approved weight limits by comparing the WIM-measured axle weights against the permit record for that vehicle. If a permit vehicle is detected with axle weights exceeding the permit conditions, the system generates a compliance alert that is logged in the permit record and notified to the enforcement team. Second, WIM data feeds the detour cost model by providing accurate vehicle classification counts and weight distributions for each bridge, replacing the default traffic count estimates with measured data. For agencies with WIM sites on the permit route network, the platform can also perform real-time route compliance monitoring — checking that the truck detected at the WIM site matches the permit vehicle configuration and weight — and generate an alert if a non-compliant vehicle is detected on a route that includes posted bridges. Talk to an expert about WIM integration for your bridge network.
Every Posted Bridge in Your Network Has a Detour Cost and a Permit Revenue Impact. AI Connects Both to the Load Rating Data That Determines Whether the Posting Is Still Correct. Get a Free Load Management Assessment.
iFactory's AI-powered load rating and permit routing platform for asset managers — centralised load rating repository, automated permit vehicle evaluation with axle-by-axle bridge matching, route optimisation that minimises detour cost, and compliance documentation generated automatically from the data your bridges and permits already produce.