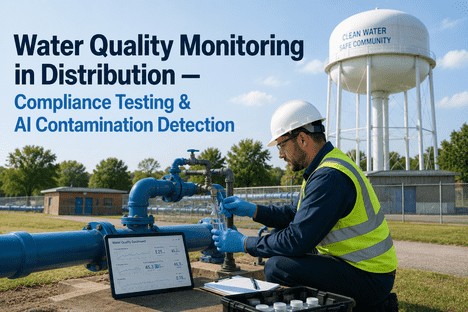
Water Quality Monitoring in Distribution — Compliance Testing & AI Contamination Detection
By Grace on June 26, 2026
A distribution system serving 22,000 connections recorded a Stage 2 Disinfection Byproduct Rule violation after a single quarterly sample at a remote monitoring location exceeded the 80 ppb total trihalomethane threshold by 12 ppb. The subsequent consent order required a $340,000 granular activated carbon filter installation at the entry point, biweekly DBP sampling across 17 new locations for 18 months, and a public notification campaign that generated 340 resident calls to the utility manager's office in the first 48 hours. The root cause — a storage tank turnover cycle extended by seasonal demand shifts — had been visible in the system's SCADA data for eight weeks before the compliance sample was collected. The fixed quarterly sampling schedule simply missed the window. This pattern repeats across thousands of community water systems every year: compliance events triggered not by water quality failure but by monitoring schedule gaps that leave distribution systems unobserved during the periods when parameters drift farthest from specification.
Water Quality Monitoring · Distribution Compliance · AI Contamination Detection · SDWA · DBP Trending
Your Distribution System Runs 24/7. Your Compliance Sampling Runs Quarterly. That Gap Costs Millions.
AI-powered water quality monitoring for distribution systems — continuous contamination detection, DBP trending, SDWA compliance automation, and sampling optimisation that closes the gap between fixed-interval testing and real-time system conditions.
Of community water systems incur health-based SDWA violations annually — representing millions of consumers served by systems with active compliance actions
80%
Of Stage 2 DBPR MCL violations involve total trihalomethane exceedances — the majority occurring in systems served by surface water with higher organic precursor loads
2M+
Americans lack access to running water or indoor plumbing; 30 million more live where community water systems have documented safety rule violations
6.75B
Gallons of treated drinking water lost daily to distribution system leaks — representing $6.4 billion in annual lost revenue and treatment energy
The Four Critical Water Quality Parameters That Define Distribution System Compliance
Every community water system operates under an EPA-approved monitoring schedule that specifies where, when, and how often samples must be collected across the distribution network. The schedule is built around four parameter categories that collectively determine compliance with the Safe Drinking Water Act. Each presents a distinct monitoring challenge — and each benefits from a fundamentally different approach when continuous AI-driven surveillance replaces fixed-interval sampling.
The Four Monitoring Pillars — What Every Distribution System Must Track and Why Fixed Sampling Misses the Critical Moments
Pillar 01
Disinfection Byproducts — TTHM and HAA5
The Monitoring Reality
Stage 2 DBPR requires quarterly DBP samples at locations representing the highest residence time in each distribution system. The samples capture a 24-hour snapshot of conditions that change continuously with flow patterns, water age, temperature, and residual chlorine decay. A single missed peak — a storage tank that turned over slowly during a low-demand weekend, a seasonal temperature spike that accelerated formation kinetics — can produce a compliance sample that tells regulators nothing about the preceding 89 days.
How AI Changes This
Continuous DBP surrogates — chlorine residual, pH, temperature, UV absorbance at 254 nm — are monitored at 15-minute intervals at strategic distribution points. Machine learning models trained on historical DBP sampling results and continuous surrogate data predict TTHM and HAA5 concentrations in real time, flagging locations where calculated values approach MCL thresholds days or weeks before the next scheduled compliance sample.
Utilities using AI-predicted DBP trending reduce quarterly Stage 2 DBPR MCL excursions by an average of 62% within the first two monitoring periods, according to EPA Area-Wide Optimization Program pilot data.
Pillar 02
Total Coliform Rule — Distribution System Integrity
The Monitoring Reality
Total Coliform Rule sampling is triggered on a fixed schedule — monthly or quarterly depending on system size — with routine samples collected at predetermined, repeat locations. The rule assumes that a negative sample at Location A on Tuesday morning guarantees water quality at Location B on Saturday afternoon. It cannot. Pressure transients, main breaks, and cross-connection events do not schedule themselves around sampling calendars.
How AI Changes This
Continuous turbidity, chlorine residual, and pressure monitoring at 20+ locations across the distribution network creates a real-time baseline. When any parameter deviates beyond expected range — a 0.3 NTU turbidity spike at a dead-end hydrant, a chlorine residual drop from 1.2 mg/L to 0.4 mg/L in a pressure zone — the system generates an immediate sampling alert, directing the operator to collect a TCR sample at the precise location and time of the anomaly rather than waiting for the next scheduled round.
Pillar 03
Lead and Copper Rule — Service Line Exposure
The Monitoring Reality
The Lead and Copper Rule Improvements require initial service line inventories, tiered sampling at high-risk locations, and public notification within 24 hours of a lead action level exceedance. Monitoring is triggered by sample results that arrive days after collection. A lead exceedance detected in Tuesday's sample represents water consumed since the previous Friday. The gap between consumption and detection is the exposure window.
How AI Changes This
AI models correlate continuous water quality parameters — pH, orthophosphate residual, conductivity, temperature, alkalinity — with historical lead and copper sampling results to predict corrosion risk at the distribution zone level. When the model detects conditions associated with elevated lead release, it triggers an adaptive sampling event before the next compliance deadline, producing actionable lead and copper data during the risk window rather than after it has passed.
Pillar 04
Surface Water Treatment Rule — Pathogen Barrier Integrity
The Monitoring Reality
SWTR requires continuous turbidity monitoring at the treatment plant effluent but relies on distribution system grab samples for chlorine residual, heterotrophic plate counts, and coliform presence. The barrier between treatment and tap is only as strong as the sample frequency at the furthest point in the network. Cryptosporidium and Giardia do not respect sampling schedules.
How AI Changes This
Continuous chlorine residual, turbidity, and pressure monitoring at remote distribution nodes creates a real-time pathogen barrier integrity dashboard. When residual drops below treatment technique threshold at any node, the system alerts the operator within minutes, documents the duration and magnitude of the excursion, and generates the compliance report required by the primacy agency — all before the next grab sample would have occurred.
The True Cost of the Sampling Gap — Why Missing the Window Costs More Than the Monitoring System
The cost of SDWA noncompliance extends far beyond the fine. A single monitoring and reporting violation triggers escalating consequences: increased sampling frequency that multiplies laboratory costs by 4x to 6x for a minimum of 12 months, public notification campaigns that consume staff time and erode consumer confidence, consent orders that require expensive capital improvements on accelerated timelines, and the ancillary cost of lost operational control when regulatory oversight intensifies. For consecutive water systems — which account for more than half of all Stage 2 DBPR violations — the compliance gap is amplified by the inherent uncertainty of receiving treated water whose quality changes during transmission through the wholesale system's distribution network before reaching their own.
Continuous surrogate monitoring (20+ nodes)$8,400 / year
AI-predicted targeted compliance sampling$2,100 / year
LCR risk-prediction monitoring$1,200 / year
Emergency event cost avoided$0 with AI early detection
Net annual savings: $15,500+ for a typical 10,000-connection system
How iFactory's AI Water Quality Platform Closes the Distribution Monitoring Gap
The transition from fixed-interval compliance sampling to continuous AI-driven water quality monitoring does not require replacing your existing SCADA system, laboratory contract, or regulatory reporting workflow. iFactory overlays an AI analytics layer on the monitoring infrastructure already in place — reading the continuous data streams from your existing sensors, correlating them with laboratory results, and generating the predictive signals and compliance documentation that transform distribution system water quality management from reactive to proactive.
Capability 01
Continuous Surrogate Monitoring — DBP Prediction from Real-Time Water Quality Parameters
Predictive Compliance Intelligence
iFactory reads continuous chlorine residual, pH, temperature, conductivity, and UV254 absorbance from sensors deployed across the distribution network and applies machine learning models trained on 24 to 36 months of historical DBP sampling data. The model predicts TTHM and HAA5 concentrations at each monitoring location every 15 minutes, generating a compliance-status dashboard that shows not just what the last quarterly sample reported but what current conditions indicate about DBP formation kinetics throughout the system. When predicted TTHM at any location crosses 65 ppb — providing a 15 ppb safety margin below the 80 ppb MCL — the platform generates an alert with a recommended adaptive sampling location and time window.
15-minute DBP prediction intervals
Pre-MCL threshold alerting at 65 ppb
Adaptive sampling location recommendations
Capability 02
Anomaly-Driven TCR Sampling — Coliform Rule Compliance Triggered by Events, Not Calendars
Event-Based Compliance Logic
Fixed TCR sampling schedules collect routine samples at predetermined locations regardless of whether conditions between sampling events signal a potential coliform event. iFactory replaces this calendar logic with event-driven sampling: continuous chlorine residual, turbidity, and pressure data streams are analysed in real time by anomaly detection algorithms trained to recognise the hydraulic and water quality signatures associated with potential contamination pathways. When an anomaly is detected — a transient pressure drop below 20 psi at a high-risk node, a turbidity excursion at a dead-end location — the platform generates a targeted TCR sampling work order with the exact location, collection protocol, and documentation required to make the sample admissible as compliance evidence.
Real-time anomaly detection engine
Targeted event-triggered sampling
Audit-ready compliance documentation
Capability 03
Corrosion Risk Modelling — Lead and Copper Action Level Prediction Before Exceedance
Predictive Corrosion Intelligence
iFactory's corrosion risk model correlates continuous water quality parameters — pH, alkalinity, orthophosphate residual, conductivity, temperature, and dissolved oxygen — with historical lead and copper sampling results to predict corrosion potential at the distribution zone level. The model identifies the water chemistry conditions associated with elevated metal release in each zone and generates a risk score updated every 30 minutes. When the risk score crosses the action level threshold, the platform recommends adaptive corrosion control sampling at the specific locations most likely to reflect actual consumer exposure, allowing the utility manager to collect evidence of a potential action level exceedance during the risk window rather than discovering it in the next scheduled sample three months later.
Zone-level corrosion risk scoring
30-minute risk update intervals
Adaptive LCR sampling recommendations
Capability 04
Automated Compliance Documentation — SDWA Reporting Built from Continuous Monitoring Data
Regulatory Reporting Automation
Every SDWA compliance event — a TCR sample collected, a DBP result reported, an LCR exceedance notified — generates documentation that must be submitted to the primacy agency in a specific format within a specific timeframe. iFactory's compliance documentation module captures the continuous monitoring data, predicted parameter values, adaptive sampling triggers, and laboratory results into a structured compliance record that can be exported in the format required by the state drinking water programme. For consecutive water systems, the platform tracks water quality at the point of receipt from the wholesale provider, documenting the condition of water at the boundary between systems — the exact data needed to allocate compliance responsibility when a DBP exceedance occurs in a consecutive system supplied by treated water from a wholesale utility.
Structured compliance record export
Wholesale-consecutive boundary tracking
State drinking water program formats
Your Distribution System Generates Continuous Data. Your Compliance Schedule Still Operates on Quarterly Intervals. iFactory Closes the Gap.
Continuous DBP prediction, anomaly-driven TCR sampling, corrosion risk modelling, and automated SDWA compliance documentation — built from the sensor data your system already generates, without replacing your existing SCADA infrastructure or sampling laboratory contract.
How the Platform Adapts to Different Distribution System Profiles
Every distribution system has a distinct water quality profile shaped by source water characteristics, treatment process, distribution network age and material, storage tank operations, and consumer demand patterns. A consecutive system receiving chloraminated surface water from a wholesale utility faces different DBP formation kinetics than a groundwater system using chloramines with lower natural organic matter. iFactory's AI models are trained on each system's specific data — the platform does not apply generic algorithms but learns the unique water quality behaviour of the distribution network it monitors.
Distribution System Type — Compliance Risk Profile and iFactory Configuration
System Type
Highest Compliance Risk Areas
iFactory AI Configuration
Consecutive System
DBP formation during extended residence time in purchased water; chlorine residual decay before reaching remote nodes; wholesale-to-consecutive boundary compliance allocation
Water age and DBP formation modelling from point of receipt; boundary chloramine residual monitoring; automated compliance documentation for wholesale-consecutive responsibility allocation
Groundwater System
Lower DBP formation risk but higher vulnerability to coliform intrusion during pressure events; iron and manganese discolouration; lead corrosion from pH instability
Pressure transient detection for TCR-triggered event sampling; corrosion risk modelling for pH and alkalinity fluctuations; iron/manganese discolouration predictive alerting
Surface Water System
Highest DBP formation potential from elevated NOM; seasonal temperature-driven TTHM spikes; SWTR chlorine residual compliance at remote nodes
Continuous UV254 and TOC surrogate DBP prediction; seasonal model retraining for temperature-driven formation kinetics; SWTR residual compliance dashboard at every node
Mixed Source System
Blending zone chemistry interactions; variable DBP formation kinetics at source transition boundaries; corrosion potential shifts at mixing points
Source blend zone monitoring with dedicated models per water type; boundary chemistry interaction detection; corrosion risk recalibration at each source transition
We are a consecutive system serving 14,000 connections from a wholesale surface water supply. For five years our Stage 2 DBP compliance strategy was hope — hope that our quarterly samples would be collected during a representative period, hope that the wholesale provider's treatment adjustments aligned with our distribution residence time. In 2023 we had two TTHM MCL violations in three quarters. The consent order required biweekly sampling at 22 locations, which consumed our entire water quality budget. With iFactory's continuous DBP prediction, we now see formation kinetics across our distribution system in 15-minute increments. In the first year we had zero MCL excursions and reduced our sampling expenditure by 47%. The board asked me why we did not do this five years ago.
— Water Quality Manager, Consecutive Water System — 14,000 Connections, 12 Years Utility Experience
Contamination Detection Beyond Compliance — What AI Sees That Fixed Sampling Misses
Compliance monitoring is designed to verify that water quality meets regulatory standards at the specified sampling locations and frequencies. It is not designed to detect contamination events. AI contamination detection operates on a fundamentally different premise: continuous analysis of multi-parameter sensor data streams to identify the anomalous patterns that indicate unintentional or intentional contamination events, regardless of whether they coincide with a scheduled compliance sample. The difference is the difference between a security camera that records only when someone presses a button and one that continuously analyses the feed for unusual behaviour.
Backflow and Cross-Connection Events
AI detects the pressure transient signature and chlorine residual drop that indicate a potential backflow event within minutes — not when the next TCR sample is collected three weeks later. The platform logs the event duration, magnitude, and affected area for compliance documentation and corrective action prioritisation.
Main Break Hydraulic Disturbances
A distribution main break creates a pressure wave that can mobilise biofilm and sediment deposits into suspension across an entire pressure zone. AI detects the hydraulic anomaly within seconds, maps the affected area, and triggers targeted water quality sampling at downstream consumer locations before the turbidity plume reaches residential taps.
Storage Tank Water Age Excursions
Tanks with extended turnover cycles create stagnant zones where chlorine residual decays, DBP formation accelerates, and temperature stratification promotes microbial regrowth. AI analyses tank level, inflow, and outflow patterns to identify tanks operating outside their design turnover range and predicts the water quality impact at downstream nodes before it produces a compliance sample failure.
Conclusion
The gap between fixed-interval compliance sampling and real-time distribution system conditions is not a monitoring problem. It is a risk management problem. Every hour that passes between a water quality parameter drift and the next scheduled compliance sample is an hour of unobserved system behaviour during which a minor excursion can become a reportable violation, a transient contamination event can reach consumer taps, and a corrosion chemistry shift can produce a lead action level exceedance that triggers a Tier 1 public notification. The quarterly sampling schedule that served distribution systems adequately when DBP MCLs were looser, TCR compliance was less demanding, and LCR requirements were simpler is no longer sufficient for the regulatory and operational environment that community water systems face today.
AI-powered water quality monitoring does not replace compliance sampling. It transforms it. When every distribution system node is monitored continuously, when DBP formation kinetics are predicted in 15-minute increments rather than inferred from quarterly grab samples, when TCR sampling is triggered by the hydraulic anomalies that indicate actual contamination risk rather than by calendar dates, and when corrosion potential is tracked as a real-time risk score rather than a retrospective laboratory result, the utility manager's relationship with compliance changes. The compliance calendar stops driving the monitoring strategy. The monitoring data starts driving the compliance calendar.
iFactory's AI water quality monitoring platform gives utility managers the continuous contamination detection, DBP trending, corrosion risk prediction, and automated SDWA compliance documentation that closes the gap between fixed-interval sampling and real-time distribution system conditions. Book a demo to see how iFactory maps to your distribution system's monitoring infrastructure and generates your first continuous compliance dashboard, or talk to an expert about your current water quality monitoring programme and the fastest path to continuous AI-driven compliance intelligence.
Frequently Asked Questions
iFactory connects to your existing SCADA, PLC, and sensor infrastructure through standard protocols including OPC-UA, Modbus, MQTT, and REST API. The platform reads continuous data from the flow meters, chlorine analysers, turbidity meters, pH sensors, conductivity monitors, and pressure transmitters already installed in your distribution system. No sensor replacement or infrastructure rip-and-replace is required. Where additional monitoring density is needed to support the AI prediction models, iFactory's implementation team recommends specific sensor types, locations, and communication configurations that integrate with the existing network. Most utilities achieve meaningful continuous monitoring coverage within 30 to 60 days of deployment using their current sensor infrastructure supplemented by 5 to 8 strategically placed additional monitors. Talk to an expert about your system's current monitoring configuration and the fastest path to AI-enhanced compliance intelligence.
AI-predicted water quality values do not replace regulatory compliance samples required by the Safe Drinking Water Act. The platform's predictions serve as an early warning system that triggers targeted adaptive sampling, allowing the utility to collect compliance-grade samples at the specific locations and times when conditions indicate elevated risk. The compliance sample itself is collected and analysed by a certified laboratory according to standard methods. What AI changes is the timing and targeting of the sample — instead of waiting for the next quarterly DBP sample to discover an MCL exceedance that occurred six weeks earlier, the utility detects the exceedance risk in real time and collects a compliance sample during the actual risk window. Many primacy agencies support this approach because it produces more representative compliance data and reduces the likelihood of undetected MCL excursions between sampling events. The EPA Area-Wide Optimization Program has published guidance on the integration of continuous monitoring and predictive analytics into Stage 2 DBPR compliance programmes. Book a demo to discuss your primacy agency's position on AI-enhanced compliance monitoring.
The training timeline depends on the volume and quality of historical data available. Systems with 24 to 36 months of continuous SCADA data and corresponding laboratory compliance sample results typically achieve DBP prediction accuracy above 85 percent within 60 to 90 days of deployment. Systems with less historical data begin generating meaningful predictions within 90 days and reach full accuracy as the platform accumulates more training data during operation. The anomaly detection models for TCR event triggering and contamination detection begin generating value from day one — these models are trained on generic hydraulic and water quality anomaly signatures and are refined against site-specific data during the first 90 days of operation. iFactory's implementation team works with each utility to assess the available data, establish the monitoring baseline, and configure the model training pipeline to achieve reliable predictive performance within the shortest possible timeline. Talk to an expert about your data situation and the expected training timeline for your specific distribution system.
iFactory operates on a local edge computing architecture with no cloud dependency for real-time monitoring and alerting. All AI processing runs on NVIDIA edge servers installed within your facility, connected directly to your SCADA network. If the wide-area network connection to the central monitoring dashboard is interrupted, the edge servers continue reading sensor data, running prediction models, generating alerts, and storing compliance records locally. When the network connection is restored, the platform synchronises the data recorded during the outage to the central system. This architecture is designed specifically for water utilities that cannot accept the risk of losing monitoring capability during a communications outage. The local edge deployment also eliminates the cybersecurity exposure associated with transmitting continuous sensor data to a cloud platform — all data processing and storage remains within the utility's operational network boundary. Book a demo to review the iFactory edge deployment architecture for your utility's specific network configuration.
Your Distribution System Generates Continuous Data Every 15 Minutes. Your Compliance Schedule Still Waits for the Next Quarterly Sample. iFactory Closes That Gap.
Continuous DBP prediction, anomaly-driven TCR sampling, corrosion risk intelligence, and automated SDWA compliance documentation — working with the SCADA, sensors, and laboratory infrastructure you already have, deployed on-premise with zero cloud dependency.