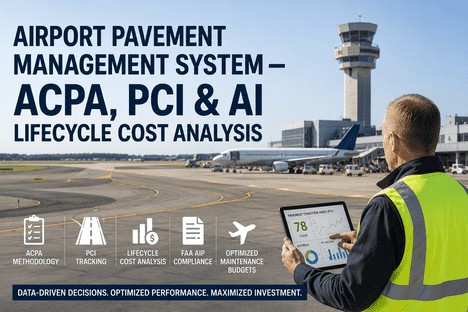
Airport Pavement Management System — ACPA, PCI & AI Lifecycle Cost Analysis
By Grace on June 26, 2026
A regional airport in the Midwest deferred a runway surface treatment for three consecutive budget cycles. The PCI was 72 — satisfactory — and the cracks were sealed. Two years later, after a winter with forty-two freeze-thaw cycles, the same pavement section measured PCI 48. Water infiltration through unsealed longitudinal joints had saturated the base layer, freeze-thaw action had expanded the subgrade, and what would have been a $1.2 million mill-and-overlay at PCI 72 became a $4.8 million full-depth reconstruction at PCI 48. That four-to-one cost escalation is not a budget anomaly. It is the mathematical consequence of pavement deterioration kinetics that the FAA has documented for decades — and it is the reason that every dollar spent on preventive pavement maintenance at the right time avoids four to five dollars of rehabilitation cost later. Across the 3,300 airports in the National Plan of Integrated Airport Systems, more than half of all Airport Improvement Program funds are directed toward pavement construction and rehabilitation. The question every airport operations director must answer is not whether the pavement needs work — it is whether the work is being done at the point in the deterioration curve where the investment delivers maximum lifecycle value.
$1 of Preventive Pavement Maintenance Today Avoids $4-5 in Rehabilitation Later. iFactory Turns Your Airport Pavement Data Into a Lifecycle-Optimised Capital Programme.
AI-powered airport pavement management system with PCI tracking, ACPA-based lifecycle cost analysis, deterioration curve modelling, and FAA AIP-compliant capital documentation that turns pavement condition data into a fundable, defensible infrastructure investment programme.
Cost multiplier when pavement rehabilitation is deferred from fair to poor condition — every dollar of preventive maintenance at PCI 70+ avoids four to five dollars at PCI 50
50%+
Of all FAA Airport Improvement Program funds are directed toward pavement construction and rehabilitation — the single largest category of AIP grant expenditure
3,300+
Airports in the National Plan of Integrated Airport Systems — each requiring a compliant pavement management programme per FAA grant assurance obligations
82%
AI-based PCI classification accuracy from automated crack detection — machine learning now reduces manual inspection effort by up to 40% while improving consistency
Why Airport Pavement Deterioration Follows a Non-Linear Curve — and Why Annual PCI Surveys Alone Cannot Capture the Rate of Change
Every airport operations director knows that pavement deteriorates. What is less widely understood is the shape of the deterioration curve — and why the standard PCI survey interval of twelve months is mathematically incapable of capturing the acceleration that occurs when pavement condition crosses from the fair range into the poor range.
Airport pavement deterioration is not a straight line. In the first years after construction or major rehabilitation, the PCI declines slowly — losing perhaps two to four points annually as the surface oxidises, minor cracking develops, and joint sealant begins to degrade. This is the preventive maintenance window, when crack sealing, surface treatment, and thin overlays can restore the pavement to near-original condition at a cost of $3 to $8 per square yard. Once the PCI crosses below approximately 65, the deterioration rate changes fundamentally. Water that enters through unsealed cracks saturates the base course, reducing its structural support. Traffic loading that was distributed across a sound pavement structure now concentrates at crack edges, producing spalling, faulting, and accelerated fatigue cracking. The deterioration rate shifts from two to four points per year to eight to fifteen points per year — and the treatment required shifts from preventive maintenance at $3-$8 per square yard to structural overlay or reconstruction at $15-$40 per square yard. The PCI survey conducted twelve months earlier that showed a satisfactory rating provides no warning that the pavement is approaching the inflection point — because the inflection point is defined by the deterioration rate, not by the condition score itself.
The Three Phases of Airport Pavement Deterioration — and the Intervention Window That Annual PCI Surveys Routinely Miss
Phase 1 — Good to Satisfactory (PCI 100 to 71)
The preventive maintenance window — low annual deterioration rate, high return on intervention
In the first phase, pavement deterioration is dominated by surface-level mechanisms: asphalt oxidation from UV exposure, raveling of the surface aggregate, initial crack formation from thermal cycling, and joint sealant degradation in concrete pavements. The annual PCI loss in this phase ranges from two to four points, and the pavement surface remains structurally sound — meaning that preventive treatments applied at PCI 75 to 85 can restore the pavement to near-original condition at a fraction of reconstruction cost. Crack sealing extends service life by three to five years at $0.50 to $1.50 per linear foot. A thin hot-mix asphalt overlay of 1.5 to 2.0 inches at PCI 72 restores structural capacity and surface friction for twelve to fifteen additional years at roughly one-quarter the cost of full reconstruction. The FAA's own lifecycle cost guidance demonstrates that a pavement receiving preventive treatment at PCI 75 will cost approximately one-fifth per year of service life compared to a pavement that is allowed to deteriorate to PCI 50 before intervention. Yet the annual PCI survey conducted in this phase shows a slowly declining score that creates no urgency — and the maintenance window closes while the budget cycles pass.
Phase 2 — Satisfactory to Fair (PCI 70 to 56)
The inflection zone where deterioration rate accelerates and treatment costs escalate
Phase 2 is the most dangerous segment of the pavement lifecycle — because the PCI score still reads as adequate while the deterioration kinetics have fundamentally changed. When the PCI drops below 70, crack densities have reached the threshold at which water infiltration into the base course becomes systematic rather than isolated. In asphalt pavements, fatigue cracking begins to interconnect, creating alligator pattern distress that indicates structural failure of the surface layer. In concrete pavements, joint spalling accelerates as incompressible materials in unsealed joints concentrate compressive stresses during thermal expansion. The annual PCI loss in this phase accelerates to five to eight points per year — meaning a pavement that measured PCI 68 in the annual survey may be at PCI 58 within eighteen months, having crossed into the range where preventive maintenance is no longer feasible. The treatment required at PCI 58 is a structural overlay of three to five inches at $12 to $18 per square yard or, in many cases, full mill-and-replace of the surface layer at substantially higher cost. This is the phase where the annual PCI survey interval creates its most costly information gap: the inspection that shows PCI 68 provides no indication that the pavement will reach PCI 58 before the next inspection — and the window for preventive intervention closes between survey cycles.
Phase 3 — Poor to Failed (PCI 55 to 0)
Structural failure requiring full-depth reconstruction at four to five times preventive treatment cost
Below PCI 55, airport pavement is no longer a candidate for surface-level intervention. Water damage to the base and subbase layers has reduced the structural number of the pavement section below the design requirement for the aircraft traffic index. In asphalt pavements, the surface exhibits extensive alligator cracking, rutting exceeding 0.5 inches, and raveling that creates foreign object debris (FOD) risk to aircraft engines and airframes. In concrete pavements, corner breaks, punchouts, and slab settlement create roughness that exceeds FAA ride quality standards for the aircraft types served. The annual PCI loss in this phase can reach ten to fifteen points, and the only viable treatment is full-depth reconstruction at $25 to $45 per square yard depending on pavement thickness, base course requirements, and drainage improvements. At this stage, the cost of intervention has escalated from $3-$8 per square yard in Phase 1 to $25-$45 per square yard in Phase 3 — a four-to-five-fold increase that the FAA pavement lifecycle curve has documented consistently across decades of airport pavement management data.
The Deterioration Rate Gap — Why Annual PCI Surveys Miss the Critical Intervention Point
The information gap between inspection cycles is the single largest driver of pavement lifecycle cost escalation
The fundamental limitation of an annual PCI survey is not that the data is inaccurate — it is that the data arrives too late to detect the acceleration of deterioration rate that defines the transition from Phase 1 to Phase 2. A pavement that loses four PCI points in the first year after resurfacing and eight PCI points in the second year will measure PCI 68 in the Year 2 annual survey — still in the satisfactory range. But the deterioration rate has doubled, and the pavement is on track to reach PCI 56 within the next twelve months. The annual survey conducted eleven months later will confirm the pavement has reached PCI 58 — confirming the deterioration but arriving after the window for preventive intervention has closed. The airport operations director receives accurate condition data, but the data arrives too late to change the treatment strategy from preventive maintenance at $8 per square yard to structural rehabilitation at $30 per square yard. This is not a failure of the PCI methodology. It is a failure of measurement frequency. The deterioration rate that defines the lifecycle cost outcome changes between surveys — and annual inspections are not designed to capture it.
What iFactory's AI Pavement Management System Does That Annual PCI Surveys and Spreadsheet Tracking Cannot
Most airport pavement management programmes rely on a combination of annual PCI surveys conducted per ASTM D5340, spreadsheet-based condition tracking, and periodic pavement management plan updates commissioned every three to five years. These tools produce a point-in-time picture of pavement condition, but they cannot generate the continuous deterioration rate analysis, lifecycle cost projection, and treatment optimisation that pavements require to be managed at maximum lifecycle value. iFactory replaces this cycle with continuous pavement intelligence across four integrated capabilities.
The PCI survey conducted per ASTM D5340 remains the industry standard for airport pavement condition assessment, but a single annual data point cannot distinguish between a pavement that is deteriorating at two points per year with a flat trend and a pavement that is deteriorating at two points per year with an accelerating trend. iFactory's pavement intelligence module integrates PCI data from annual surveys with intermediate condition indicators — traffic loading data from the airport's operations records, crack progression measured through automated drone-based imaging, and surface friction test results — to calculate a continuous deterioration rate per pavement section between formal survey cycles. When the deterioration rate exceeds the established baseline for the pavement section — indicating the transition from Phase 1 to Phase 2 deterioration — the platform generates an alert with the specific section, the measured rate change, and the projected PCI at the next survey date under the current trajectory. For the airport operations director managing a pavement network spanning runways, taxiways, and aprons, this continuous rate detection converts the PCI survey from a backward-looking condition report into a forward-looking deterioration warning system — showing where the deterioration rate is accelerating and which sections will cross the preventive maintenance threshold before the next scheduled survey.
Continuous deterioration rate tracking
Automated PCI trend analysis
Early rate acceleration alerts
Capability 02
Lifecycle Cost Analysis & Treatment Optimisation — ACPA-Based Modelling of Preventive vs. Reactive Intervention Economics
Lifecycle Cost Intelligence
The FAA pavement lifecycle curve is one of the most widely referenced concepts in airport infrastructure management — but translating that curve into a per-section treatment sequence requires modelling that most pavement management spreadsheets cannot perform. iFactory's lifecycle cost analysis module applies ACPA-based treatment selection logic to each pavement section in the airport's inventory, evaluating the cost per year of service life for each applicable treatment at the section's current PCI and projected deterioration rate. A runway section at PCI 74 with a deterioration rate of three points per year is evaluated for crack sealing plus surface treatment (extending service life four to six years at $4-$6 per square yard), a two-inch overlay (extending service life twelve to fifteen years at $10-$14 per square yard), and do-nothing until PCI 50 (requiring full reconstruction at $30-$40 per square yard within eight years). The platform ranks each treatment option by net present value over a twenty-year analysis period per FAA LCCA guidance, presenting the airport operations director with the treatment sequence that minimises total lifecycle cost for each section. For AIP grant applications that require lifecycle cost analysis as part of project justification, the platform generates the FAA-compliant LCCA documentation directly from the pavement inventory data and treatment cost database — eliminating the need to commission a separate engineering analysis for each grant application.
Per-section LCCA modelling
20-year NPV treatment comparison
FAA-compliant grant documentation
Capability 03
Automated Distress Detection & Classification — AI Vision for Crack Mapping, Spalling Quantification, and FOD Risk Assessment
Automated Inspection Intelligence
ASTM D5340 PCI surveys require trained inspectors to walk every pavement section, identify distress types by category, rate severity, and measure extent — a process that typically takes two to five days for a mid-size airport and produces results that are subject to inter-inspector variability of ten to fifteen percent even among certified surveyors. iFactory's computer vision module processes high-resolution imagery collected by drone or survey vehicle to detect, classify, and quantify pavement distress automatically — identifying cracking by type (longitudinal, transverse, fatigue/alligator, block), measuring spalling extent at joints in concrete pavements, quantifying rutting depth, and raveling area. The AI detection model achieves crack identification accuracy comparable to certified inspectors while reducing survey time by approximately sixty percent and eliminating inter-inspector variability entirely. For airports operating under FAA Part 139 certification, the automated distress detection output provides the documented pavement condition record that satisfies both the annual inspection requirement and the more rigorous pavement management programme documentation that FAA grant assurances require. The distress data feeds directly into the PCI calculation engine, producing a condition score that is consistent year over year and auditable to the individual distress measurement.
AI-based crack classification
60% faster inspection cycles
FOD risk area identification
Capability 04
Capital Improvement Plan & Grant Documentation — FAA AIP-Ready Pavement Project Packages Generated from Your Own Condition Data
AIP Grant Intelligence
An FAA AIP grant application for pavement rehabilitation requires a project justification that includes current pavement condition data, deterioration trend analysis, lifecycle cost comparison of treatment alternatives, and a project scope with cost estimate — documentation that typically requires commissioning a pavement management plan update from an engineering consultant at a cost of $30,000 to $80,000 for a mid-size airport. iFactory's capital planning module generates the grant-ready documentation package from the pavement condition data already in the system — PCI per section with trend data, deterioration rate analysis, LCCA for the proposed treatment versus alternatives, engineer's cost estimate based on local unit prices, and the priority ranking within the airport's five-year capital plan. For airports that have been using iFactory for twelve months or more, the continuous PCI trending and deterioration rate data provides the longitudinal condition evidence that FAA reviewers look for in project justification — showing not just that the pavement needs work but that the deterioration rate has been tracked continuously and the proposed intervention is timed at the optimum point on the lifecycle cost curve. The platform's output is structured to match the documentation format that FAA Airports District Offices expect for AIP grant applications, including the pavement condition summary tables, treatment cost analysis, and project priority ranking that form the core of the project justification package.
AIP grant-ready documentation
5-year capital plan generation
FAA-compliant project justification
An Annual PCI Survey Tells You What Your Pavement Condition Was. iFactory's Continuous Deterioration Tracking Tells You What It Will Cost If You Wait.
Continuous PCI trending, ACPA-based lifecycle cost analysis, AI distress detection, and FAA AIP-ready capital documentation — built from the pavement data you already collect, without commissioning a separate pavement management plan update.
How the AI Pavement Framework Applies Across Airport Infrastructure Types
An airport pavement network spans structurally and operationally distinct surface types — each with different deterioration mechanisms, treatment protocols, and criticality to airport operations. A primary runway serving commercial air carrier operations has a different PCI threshold for intervention than a general aviation taxiway or an apron used for aircraft parking and de-icing. iFactory's pavement management engine accounts for pavement type, functional classification, traffic loading profile, and operational criticality in its condition assessment, treatment recommendation, and capital prioritisation output.
Airport Pavement Type — Deterioration Profile and iFactory Pavement Management Configuration
Fatigue cracking from landing gear load repetition, rutting in wheelpath zones, joint spalling in concrete runways, friction degradation from rubber buildup, FOD generation from raveling aggregate. Intervention threshold: PCI 70 for preventive, PCI 60 for structural
Reduced PCI intervention threshold at 70 with automated FOD risk flagging from raveling and spalling detection; friction trend monitoring from runway friction tester data integration; rubber removal scheduling at threshold accumulation; accelerated inspection frequency for air carrier runways
Taxiways & Taxilanes
Longitudinal cracking along construction joints, fuel and oil spillage softening asphalt binder, vegetation growth at pavement edges, differential settlement at bridge approaches and culvert crossings
Joint condition index tracking with automated sealant failure detection from imagery; spill zone mapping with chemical exposure severity scoring; edge vegetation encroachment monitoring from drone survey data
Aprons & Ramps
Fuel spill chemical degradation of asphalt binder, heavy static loading from parked aircraft producing permanent deformation, de-icing fluid chemical attack on concrete surface, hydraulic fluid staining and binder softening
Chemical exposure index mapping with material degradation modelling; static load deformation monitoring from LiDAR survey comparison; de-icing zone pavement condition tracking with accelerated inspection cycle; spill containment area condition logging
General Aviation & GA Aprons
Vegetation and weed growth through cracks and joints, oxidation and raveling from lower traffic frequency but higher UV exposure, drainage ponding at low spots, edge deterioration from lack of containment
Extended PCI survey interval with automated intermediate condition assessment from satellite imagery; vegetation encroachment tracking; drainage deficiency mapping from storm event ponding detection; grant eligibility flagging for GA pavement improvement programmes
"
Our annual PCI survey would give us a number, and we would file it. The number told us the pavement was satisfactory. It did not tell us that the rate of cracking had tripled since the previous survey, that water was already entering the base course through unsealed joints on the primary taxiway, or that we had a twelve-month window before the PCI would drop below the threshold where anything less than full reconstruction would be effective. iFactory's deterioration rate tracking flagged the acceleration within sixty days of our first data upload — showing us that three sections on the main taxiway were deteriorating at eight points per year rather than the three points we had assumed from the PCI history. We scheduled a thin overlay for all three sections in the same construction season at $1.7 million. The full reconstruction those sections would have required in two more years was estimated at $6.2 million. The board did not approve the overlay because we showed them the PCI. They approved it because we showed them the rate of change and the cost consequence of waiting.
— Director of Operations, Mid-Atlantic Commercial Service Airport — 850,000 Annual Enplanements, 20 Years Airport Operations Leadership
Conclusion
The four-to-one cost escalation between preventive pavement maintenance and full-depth reconstruction is not a theoretical ratio from an FAA advisory circular. It is the mathematical expression of pavement deterioration kinetics that every airport operations director confronts when the annual PCI survey shows a score that has dropped by fifteen points since the previous inspection — and the treatment required has changed from a surface treatment at $6 per square yard to a structural overlay at $28 per square yard. That moment is not a failure of the pavement. It is a failure of the information system that could not detect the acceleration of deterioration rate between survey cycles.
AI-powered pavement management changes the fundamental economics of airport infrastructure stewardship. When every pavement section in the airport's inventory has a continuous deterioration rate, a lifecycle cost projection updated with every new data point, and a treatment sequence optimised for net present value over the analysis period — the operations director's role shifts from reacting to PCI survey results to managing a portfolio of known deterioration trajectories with predictable intervention timelines and optimised capital allocation. The data that the annual PCI survey provides is a starting point, not a management system. The rate of change between surveys is where the economic value of pavement management is determined — and that rate is what continuous AI monitoring captures that no annual inspection can.
iFactory's airport pavement management system gives airport operations directors the continuous PCI trending, ACPA-based lifecycle cost analysis, automated distress detection, and FAA AIP-ready capital documentation that transform annual pavement condition data into a continuously optimised, fundable infrastructure investment programme. Book a demo to see how iFactory maps to your airport's pavement inventory and generates your first continuous deterioration rate baseline, or talk to an expert about your current pavement management programme and how to structure the PCI data you already have into a continuous lifecycle-optimised capital plan.
Frequently Asked Questions
iFactory supplements and enhances the annual PCI survey rather than replacing it. The formal PCI survey conducted per ASTM D5340 by a certified inspector remains the required condition assessment method for FAA Part 139 compliance and AIP grant project justification. iFactory integrates the annual PCI data as the baseline for each pavement section and maintains the continuous deterioration rate model between formal survey cycles using intermediate condition indicators — drone-based crack progression imaging, friction test results, traffic loading data, and maintenance history. The platform's automated distress detection module can perform intermediate condition assessments between formal surveys, but the output is designed as a deterioration rate monitoring tool rather than a substitute for the ASTM D5340 survey. The practical result is that the formal PCI survey continues at its required annual frequency while the continuous deterioration rate model provides the early warning system that the annual survey interval alone cannot deliver. Talk to an expert about how iFactory integrates with your current PCI survey schedule and FAA compliance programme.
For pavement sections with limited PCI history, iFactory's deterioration model uses a hybrid approach that combines available survey data with condition proxies to establish the initial deterioration rate. The platform ingests pavement design data — surface type, base course thickness, subgrade classification, and design traffic index — and applies family deterioration curves developed from the FAA's National Airport Pavement Test Facility research and ACPA pavement performance databases. A newly surveyed section with a PCI of 82 and a design traffic index of 30,000 annual equivalent departures on a fair subgrade is assigned an initial deterioration rate of three to four points per year from the family curve for that pavement configuration. As subsequent PCI data points are added — whether from formal surveys or intermediate automated assessments — the platform updates the section-specific deterioration rate, progressively replacing the family curve prediction with the measured deterioration trend. After three PCI data points spanning two survey cycles, the model transitions fully from family curve estimation to section-specific deterioration rate calculation. This hybrid modelling approach ensures that the platform delivers actionable deterioration rate information from the first data upload while improving in accuracy as the PCI history accumulates. Book a demo to see how the deterioration model calibrates to your airport's pavement inventory.
Yes. iFactory's capital planning module generates pavement project documentation packages structured to match the information requirements that FAA Airports District Offices expect for AIP grant applications. The standard package includes per-section PCI data with multi-year trend charts, deterioration rate analysis showing the annual rate of condition loss, lifecycle cost analysis comparing the proposed treatment against alternatives per FAA LCCA methodology, an engineer's cost estimate based on local unit price data loaded into the platform, and a priority ranking within the airport's five-year capital improvement programme. Where an airport's ADO requires a specific project justification format or additional supporting data, iFactory's implementation team works with the airport to configure the export templates to match. Airports that have been using iFactory for twelve to eighteen months have the continuous PCI trending and deterioration rate data depth that FAA reviewers prioritise in project justification — showing year-over-year condition trends rather than a single survey snapshot. Talk to an expert about your airport's AIP documentation requirements and how iFactory can be configured to meet them.
iFactory supports both flexible (asphalt) and rigid (concrete) airport pavement types across all functional classifications — runways, taxiways, aprons, and general aviation areas. The platform's distress detection and PCI calculation engine is configured per ASTM D5340 distress type catalogues for both asphalt and concrete pavements, including the different distress families, severity levels, and deduction value curves applicable to each surface type. For asphalt pavements, the platform tracks fatigue cracking, longitudinal and transverse cracking, rutting, raveling, bleeding, corrugation, and depression. For concrete pavements, it tracks corner breaks, longitudinal and transverse cracking, durability cracking (D-cracking), spalling at joints, faulting, punchouts, and blow-ups. The treatment selection and lifecycle cost analysis modules apply the appropriate maintenance and rehabilitation strategies for each pavement type — crack sealing, chip seal, and thin overlay for asphalt versus joint sealing, partial-depth repair, and slab replacement for concrete. Airports with mixed pavement types across their network — the most common configuration — manage all surface types within a single platform with consistent PCI methodology and capital prioritisation logic applied across the entire pavement inventory. Book a demo to see the platform configured for your airport's specific pavement types and condition data.
Your Airport Pavement Is Deteriorating Right Now. iFactory Turns Annual PCI Data Into a Lifecycle-Optimised Capital Programme Your FAA ADO Can Fund.
Continuous PCI trending, ACPA-based lifecycle cost analysis, AI distress detection, and FAA AIP-ready capital documentation — built from the pavement data you already collect, starting from day one without disrupting your existing survey cycle.