A medium-sized city serving 68,000 connections received a Notice of Violation from its state environmental agency after chronic sanitary sewer overflows at six locations triggered a Clean Water Act complaint. The engineering consultant's initial estimate for trunk sewer rehabilitation and pump station upgrades totalled $28 million — requiring an 18% rate increase phased over five years that two city council members publicly stated they would not support. An 18-month flow monitoring programme with 31 area-velocity sensors and EPA telemetry access revealed a different problem entirely: the dominant cause at the most costly sewersheds was fast inflow from cross-connections, not the pipe capacity deficiency the hydraulic model had identified. The monitoring-driven corrective action plan reduced total programme cost from $28 million to $4.44 million, replaced the 18% rate increase with a 6.5% phased increase, resolved five of six SSO locations within 24 months, and produced a 34-point improvement in community satisfaction scores — while achieving full EPA consent decree compliance. The difference between the $28 million estimate and the $4.44 million solution was not engineering skill. It was data.
Sewer Capacity · System Modeling · AI Growth Projection · SSO Prevention · Hydraulic Analysis
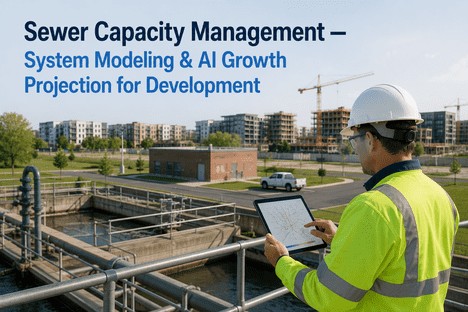
A $28 Million Engineering Estimate Became a $4.4 Million Solution. The Difference Was Data Your System Already Generates.
AI-powered sewer capacity management — continuous hydraulic modeling, RDII analysis, growth projection for development planning, and SSO prevention intelligence that turns a consent decree liability into a defensible, fundable capital programme.
23,000-75,000
Estimated annual SSO events in the United States — each representing a Clean Water Act violation with penalty exposure of $1,000 to $50,000 per day per overflow
$630B
EPA-estimated wastewater and stormwater infrastructure investment need over the next 20 years — with pipe rehabilitation representing 80-85% of total requirements
84%
CIP reduction achieved when AI-driven flow monitoring replaced engineering estimates for SSO corrective action — from $28M to $4.4M in one documented case
50+ years
Average age of nearly half of US sewer system infrastructure — aging pipes, increased infiltration, and capacity constraints that compound with every year of deferred assessment
The Four Primary Drivers of Sewer Capacity Failure — and Why Traditional Modeling Misses the Real Causes
Every SSO event has a proximate cause, but the root cause is almost always one of four capacity-limiting conditions that traditional periodic hydraulic modeling — calibrated against sparse data collected years earlier — cannot capture at the temporal and spatial resolution required. The gap between a model running on 5-year-old flow data and a collection system responding to real-time rainfall, infiltration, and development demand is where SSOs form.
01
RDII — Rainfall-Derived Infiltration and Inflow
RDII is the single largest source of unaccounted flow in most sanitary sewer systems. A model calibrated against dry-weather flow data will underestimate wet-weather capacity demand by 40% to 300% at critical nodes. Traditional periodic flow monitoring provides a point-in-time RDII assessment that becomes less accurate as pipe defects, root intrusion, and deteriorating manhole seals increase infiltration rates each year. AI-driven continuous flow monitoring detects RDII contributions at 15-minute resolution, distinguishing between fast inflow from cross-connections and slow infiltration through pipe defects — the distinction that determines whether the corrective action is targeted point repair or wholesale pipe replacement.
02
Hydraulic Bottlenecks and Pipe Capacity Deficiency
A hydraulic model built on design drawings and theoretical flow rates will identify capacity deficiencies at locations where the model says flow should exceed pipe capacity. But real sewer systems do not behave the way design drawings predict. Grease accumulation, root intrusion, pipe offset joints, sediment deposition, and sagging pipe sections all reduce effective capacity below the theoretical design value at rates that change with time, season, and upstream development. iFactory's AI hydraulic model ingests continuous level and velocity data from in-pipe sensors and recalibrates capacity against measured flow conditions in near real time — identifying actual bottlenecks rather than theoretical pinch points.
03
Development-Driven Flow Growth Projection
Every new residential subdivision, commercial development, or mixed-use project adds flow to the collection system. Traditional capacity planning uses static peaking factors and assumed per-capita flow rates that are updated every five to ten years during master plan updates. By year four of a five-year master plan cycle, the difference between projected and actual development-driven flow growth can reach 30% or more in fast-growing communities. AI growth projection models ingest building permit data, plat approvals, and zoning changes from municipal GIS systems in real time, updating flow projections at the sub-basin level every quarter rather than every five years — allowing the utility manager to identify capacity constraints before the first foundation is poured.
04
FOG, Sediment, and Structural Degradation
Fats, oils, and grease accumulation, sediment deposition in flat-grade sections, and structural defects such as cracks, fractures, and offset joints reduce pipe effective capacity progressively. A 24-inch pipe that tests at 22 inches effective diameter during a post-construction CCTV inspection may operate at 16 inches effective diameter after five years of unaddressed FOG deposition. Traditional capacity models that assume pipe diameter equals effective capacity overstate true conveyance by 10% to 35%. AI anomaly detection models trained on continuous level-to-diameter ratio data identify the specific pipe segments where effective capacity is degrading — before the capacity loss produces a backup or SSO.
The Cross-Capacity Effect:
Each driver compounds the others. RDII fills pipes that already have FOG-related capacity loss. Development growth increases peak flows in systems with unaddressed hydraulic bottlenecks. The AI advantage is detecting and separating these signals in the continuous data stream — identifying which capacity constraint at which location is causing the SSO risk that demands capital investment.
The True Cost of Capacity Uncertainty — What Engineering Estimates Miss When Data Is Sparse
A hydraulic model is only as reliable as the flow data used to calibrate it. Most municipal collection system models are calibrated against flow monitoring data collected during a single 8-to-12-week period every five to ten years — at monitoring locations selected for data availability rather than capacity risk. The uncertainty in the model's capacity predictions at unmonitored nodes is absorbed into engineering conservatism: safety factors that inflate pipe size estimates, pump station capacity requirements, and ultimately capital programme costs. That conservatism is not engineering error. It is the rational response to missing data. But it produces capital plans that systematically overestimate the scope of required investment — or worse, underestimate it because the model missed a real bottleneck that only continuous monitoring can reveal.
Periodic Model-Based Planning
8-12 week calibration data every 5-10 years
95% unobserved
Engineering safety factor on capacity
20-40% overbuild
SSO risk from unmodeled bottlenecks
undetected
Consent decree penalty exposure
$1M+/year
CIP cost confidence
low
AI Continuous Flow Intelligence
Continuous 15-minute level/velocity data
100% observed
Data-driven capacity without safety factor
actual capacity
Real-time bottleneck identification
detected at onset
Consent decree compliance cost
84% lower
CIP cost confidence
high
Monitoring investment: 1-5% of the capital programme it informs
How iFactory's AI Sewer Capacity Platform Delivers Continuous Collection System Intelligence
iFactory connects to the flow meters, level sensors, rain gauges, and SCADA systems already installed in your collection system and overlays an AI analytics layer that transforms raw flow data into continuous capacity intelligence. The platform does not replace your existing hydraulic model — it feeds it with live calibration data, runs the model continuously rather than in batch, and generates the growth projections, bottleneck alerts, and capital planning outputs that periodic model updates cannot provide.
Capability 01
Continuous Hydraulic Model Calibration — Live Flow Data Feeds Your Model at 15-Minute Resolution
Live Model Intelligence
iFactory ingests continuous depth and velocity data from area-velocity sensors deployed at strategic nodes across the collection system — locations selected to capture the flow contributions of each major sub-basin. The AI platform compares measured flow against the hydraulic model's predicted values at each node, identifying where and when the model diverges from observed conditions. When divergence exceeds a configurable threshold — typically 15% sustained deviation over 48 hours — the platform alerts the modeller to the specific node and the likely cause: a changed RDII contribution, a developing blockage, or a capacity constraint that the model does not represent. This continuous calibration transforms the hydraulic model from a periodic assessment artefact into a living digital twin of the collection system that becomes more accurate with every rainfall event.
15-minute flow data ingestion
Live model vs measured comparison
48-hour divergence alert threshold
Capability 02
RDII Source Identification — Separating Inflow from Infiltration for Targeted Corrective Action
RDII Characterisation Intelligence
The most consequential decision in SSO corrective action planning is whether capacity deficiency is caused by rainfall-derived inflow from direct stormwater connections or by groundwater infiltration through deteriorating pipe infrastructure. Inflow requires targeted point repairs and cross-connection removal. Infiltration requires pipe rehabilitation or replacement. Building the wrong solution at the wrong location wastes capital. iFactory's RDII characterisation engine analyses the hydrograph response of each monitored sub-basin to every rainfall event, separating the fast inflow component from the slow infiltration component using machine learning models trained on the specific rainfall-runoff characteristics of each catchment. The output is a sub-basin-level RDII source map showing where inflow reduction will produce the highest capacity recovery per dollar and where infiltration rehabilitation is the required corrective action.
Event-based inflow vs infiltration separation
Sub-basin RDII source mapping
ROI-ranked corrective action plan
Capability 03
Development Growth Impact Simulation — Project Future Capacity Demand from Live Land-Use Data
Growth Projection Intelligence
iFactory connects to the municipal GIS system to ingest building permit applications, plat approvals, zoning amendments, and comprehensive plan updates as they are recorded. The AI growth projection module translates each development action into an estimated flow contribution at the sub-basin level using basin-specific peaking factors continuously calibrated against measured flow data. When projected buildout flow in any sub-basin approaches 80% of the measured capacity at the downstream bottleneck node, the platform generates a capacity alert showing the specific development pipeline responsible, the threshold year when capacity is projected to be exceeded, and the capital investment required to accommodate growth. This shifts development impact assessment from a reactive process — responding to developer inquiries one application at a time — to a proactive capacity management function that shows the cumulative effect of the entire development pipeline on each sub-basin.
GIS-integrated development tracking
Sub-basin flow capacity threshold alerts
CIP growth impact scenario modelling
Capability 04
SSO Risk Prediction and Consent Decree Compliance Documentation
Compliance Risk Intelligence
Every SSO event triggers a compliance chain that must be documented for the primacy agency: event time, duration, volume, location, cause, and corrective action. iFactory captures SSO precursor events from the continuous flow monitoring data — water level approaching pipe crown at critical nodes during wet weather events — and generates a pre-event risk log that documents the hydraulic conditions leading to each capacity exceedance. When an SSO occurs, the platform records the event parameters automatically from the sensor data, calculates overflow volume from the level and duration record, and generates the compliance report in the format required by the NPDES permit or consent decree. For utilities operating under consent decrees with stipulated penalties of up to $50,000 per day per overflow event, this automated documentation is not a convenience — it is the difference between a defensible compliance record and an escalating penalty liability.
Automated SSO event documentation
Pre-event risk condition logging
Consent decree compliance reporting
Your Collection System Generates Continuous Flow Data. Your Capacity Model Still Runs on Five-Year-Old Calibration. iFactory Closes the Gap.
Continuous hydraulic model calibration, RDII source identification, development-driven growth projection, and automated SSO compliance documentation — working with the flow meters, level sensors, and SCADA infrastructure you already have in your collection system.
How the Platform Adapts to Different Collection System Profiles
Every collection system has a unique combination of pipe age, material distribution, topographic setting, development pressure, and regulatory environment. A combined sewer system in a dense northeastern city faces different capacity dynamics than a separate sanitary system in a fast-growing southeastern suburb. iFactory's AI models are calibrated against each system's specific flow data — the platform learns the unique hydraulic behaviour of the collection network it monitors rather than applying generic capacity factors.
Collection System Type — Capacity Risk Profile and iFactory Configuration
System Type
Highest Capacity Risk Factors
iFactory AI Configuration
Separate Sanitary System
RDII from private lateral cross-connections and manhole infiltration; FOG accumulation in flat-grade collector pipes; development-driven flow growth in expanding service areas
Continuous RDII characterisation per rainfall event; FOG deposition trending from level-to-diameter ratio; GIS-integrated growth projection with quarter-update frequency
Combined Sewer System
CSO permit compliance with maximum treatment and storage requirements; wet-weather peak flow management at interceptor and treatment plant capacity; tidal gate and regulator performance
CSO event prediction from rainfall forecast and live system level data; interceptor capacity headroom monitoring; LTCP compliance documentation with automated event volume calculation
Pressure Sewer / Pump Station System
Pump station capacity during wet-weather peak inflow; force main capacity constraints; wet-well overflow risk during power loss or pump failure events
Pump station inflow/outflow balance monitoring; force main capacity utilisation trending; predictive wet-well level modelling with rainfall forecast integration
Rapid Growth Suburban System
Development pipeline exceeding master plan projections; phased infrastructure not keeping pace with permit approvals; impact fee calculations requiring defensible capacity data
Buildout flow projection with live development pipeline tracking; phased CIP scenario modelling; impact fee basis documentation with auditable capacity data
We were facing a consent decree that the engineering estimate said would cost $28 million to resolve six SSO locations. The council was not going to approve an 18% rate increase without proof that every dollar was necessary. We deployed 31 flow meters across the affected sewersheds and ran continuous monitoring for 18 months. The data showed that the dominant problem was fast inflow from cross-connections, not the pipe capacity deficiency the original model had flagged. We built a targeted corrective action programme for $4.44 million that resolved five of the six locations within two years. The monitoring programme cost less than 3% of the original capital estimate and saved $23.6 million. The board now requires flow data before any major capacity project goes to design.
— Public Works Director, Mid-Sized Municipal Utility — 68,000 Connections, 20 Years Utility Leadership
SSO Prevention Through Predictive Capacity Intelligence — What Continuous Data Reveals That Periodic Modeling Cannot
The fundamental limitation of periodic hydraulic modeling is not the quality of the model — it is the assumption that the data collected during the calibration window represents the system's behaviour across all seasons, all rainfall intensities, and all stages of development buildout. A model calibrated against dry-weather summer flows will not predict the capacity response to a 10-year winter storm when the water table is high and infiltration rates are at their annual peak. Continuous flow intelligence replaces the static calibration assumption with a dynamic model that is recalibrated with every rainfall event, every development approval, and every season — producing capacity predictions that become more accurate with each cycle of data rather than less accurate with each year since the last model update.
Bottleneck Identification Before SSO Events
AI detects the specific pipe segments where level-to-diameter ratio crosses 0.8 during wet weather events — the precursor signal that indicates effective capacity is being approached or exceeded. Each identified bottleneck includes the rainfall intensity, flow contribution, and duration data needed to prioritise the corrective action.
Development Impact Pre-Assessment
Before a developer submits a site plan, the AI platform can project the flow contribution of the proposed development at the sub-basin level using the current measured capacity headroom. The developer receives a capacity impact statement that can be used to size on-site detention, schedule off-site improvements, or calculate capacity buy-in fees based on measured system conditions.
Rainfall Forecast Integration for Proactive Operations
iFactory ingests forecast rainfall data from NOAA and the National Water Model, running the calibrated hydraulic model against forecast rainfall to predict which nodes will approach capacity during the incoming storm. The platform generates pre-storm operational recommendations — pump station adjustments, storage facility activation, pre-event sewer flushing — that can prevent SSOs hours before the first raindrop.
Conclusion
Sewer capacity management sits at the intersection of three converging pressures: aging infrastructure that loses effective capacity every year through structural degradation, development growth that adds flow to systems already operating near their hydraulic limits, and regulatory enforcement that imposes escalating penalties on SSO events that were once tolerated as unavoidable operational incidents. The utility managers who navigate these pressures successfully will be the ones who replace periodic capacity assessment with continuous capacity intelligence — who know not just what the model predicted five years ago but what the system delivered yesterday, during the last storm, and under the current development pipeline.
AI-powered sewer capacity management transforms the collection system from an asset whose capacity is estimated every five to ten years into one whose capacity is measured continuously, modelled in real time, and projected forward against the development pipeline. The consent decree that consumes the capital budget for a decade becomes a compliance pathway navigated with defensible data. The SSO that triggers a Notice of Violation becomes a documented event with measured volume, identified cause, and auditable corrective action. And the development impact question that used to require a consultant study becomes a dashboard query against the live capacity model.
iFactory's AI sewer capacity management platform gives utility managers the continuous hydraulic model calibration, RDII source characterisation, development-driven growth projection, and automated SSO compliance documentation that transforms a collection system capital programme from an engineering estimate into a data-defensible investment plan. Book a demo to see how iFactory maps to your collection system's monitoring infrastructure and generates your first continuous capacity assessment, or talk to an expert about your current sewer capacity challenges and the fastest path to AI-driven collection system intelligence.
Frequently Asked Questions
Your Collection System Generates Continuous Flow Data Every 15 Minutes. Your Capacity Planning Still Relies on Five-Year-Old Calibration. iFactory Closes That Gap.
Continuous hydraulic model calibration, RDII source characterisation, development-driven growth projection, and automated SSO compliance documentation — working with the flow meters, level sensors, and SCADA infrastructure your system already uses, deployed on-premise with zero cloud dependency.