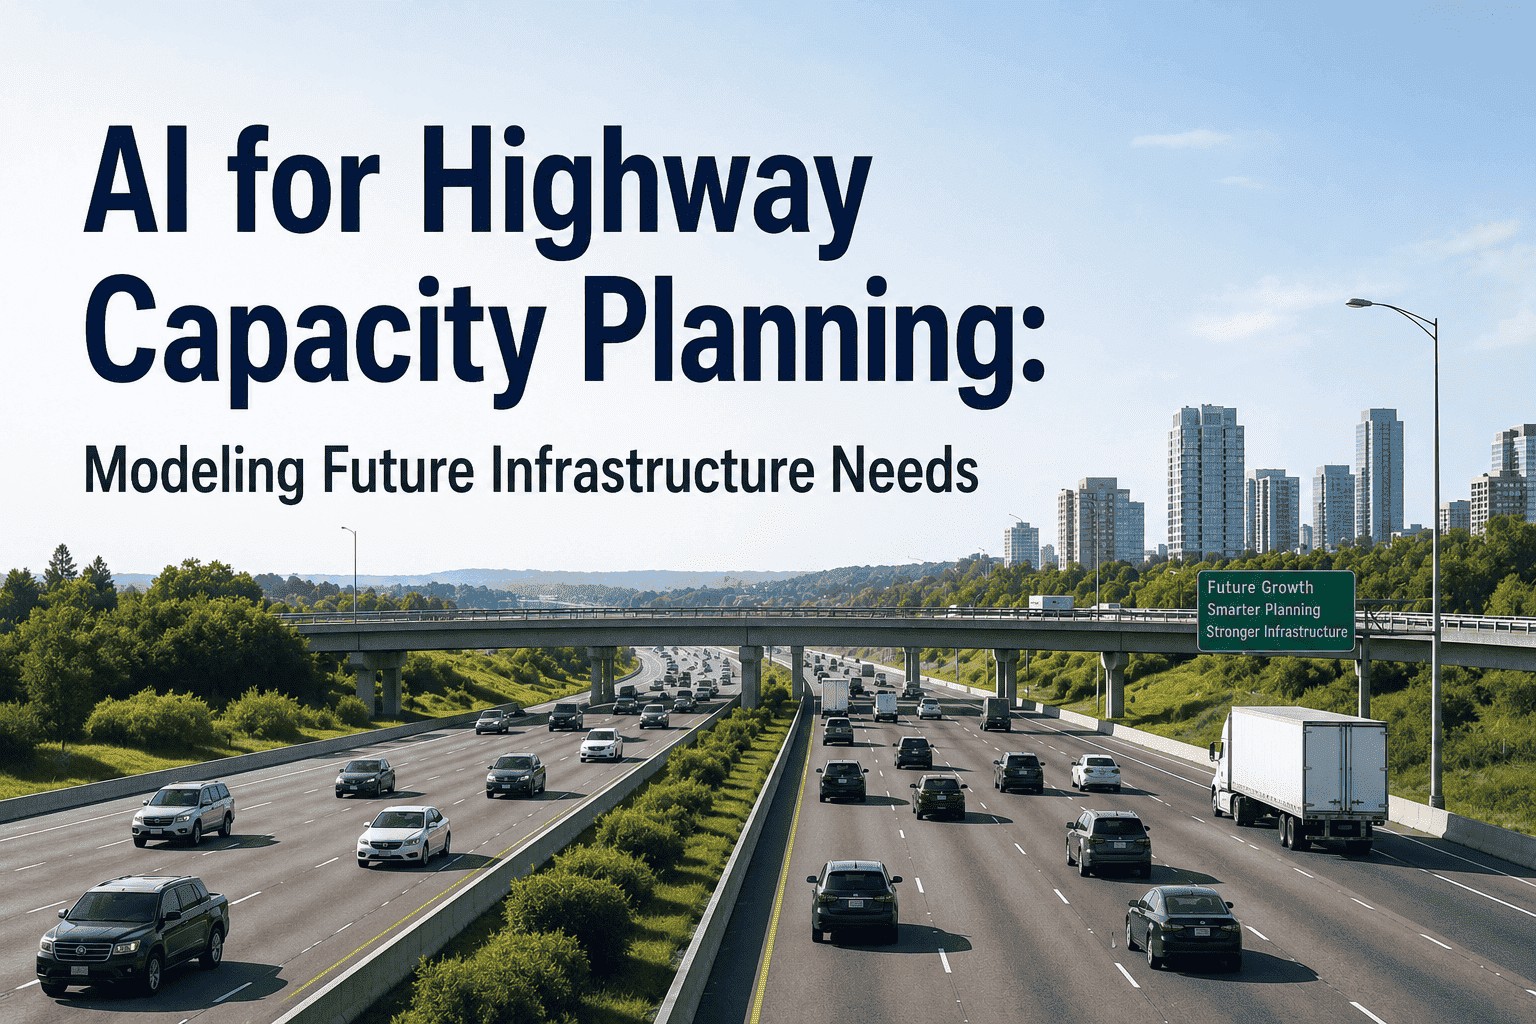
Highway planners have always worked under the same constraint: they are building infrastructure today for a future they cannot see. A new interchange designed for 2025 traffic volumes will be congested by 2035 if the surrounding land develops faster than projected. An arterial sized for today's truck fleet becomes a bottleneck the moment freight patterns shift. Conventional demand forecasting — trend lines drawn from the last decade's traffic counts — cannot model the interactions between population growth, economic development, land-use change, climate stress, and shifting travel behaviour that actually determine whether a highway corridor will have capacity in 2045. AI simulation changes this entirely. By training models on hundreds of variables across dozens of comparable corridors, AI gives highway planners a genuine 20-year demand picture — not a single projection, but a distribution of futures, each with its own capacity implication. This is how it works.
Demand Modeling · Scenario Simulation · Capacity Sizing · 20-Year Planning Horizons
Plan Highways for the Corridor as It Will Be — Not as It Is Today.
iFactory's AI infrastructure platform gives highway planners multi-scenario demand forecasting, corridor simulation, and capacity sizing tools built for 20-year planning horizons — so capital investments land on the right corridors, at the right scale, at the right time.
Why Conventional Demand Forecasting Fails at 20-Year Horizons
The standard four-step travel demand model — trip generation, distribution, mode choice, assignment — was designed in an era when data was scarce, computing was slow, and the main variables were population and employment. It is a legitimate tool for 5-year project-level analysis. At a 20-year corridor planning horizon, its assumptions collapse.
Failure Mode 01
Single-Point Projections
Conventional models produce one traffic volume number per future year. When that number is wrong — and it always varies — planners have no visibility into the range of outcomes and no basis for building in resilience.
Failure Mode 02
Siloed Variable Sets
Traditional models treat land-use, freight, and passenger demand separately. AI captures the interactions — a new logistics hub changes freight volumes AND commuter patterns AND local road demand simultaneously.
Failure Mode 03
Static Baselines
Conventional models are calibrated once and run forward. AI models retrain continuously as real-world traffic data, land-use permits, and demographic shifts update the baseline — so the 20-year forecast improves every year it is used.
What AI Reads to Model Highway Demand Over 20 Years
The accuracy of an AI capacity planning model is determined by the breadth and quality of its input variables. AI demand forecasting outperforms conventional models because it ingests the full set of variables that actually drive highway utilization — not just historical counts, but the demographic, economic, environmental, and behavioural forces that will reshape travel patterns before the planned infrastructure even opens.
Input Layer 01
Demographic & Population Data
Census projections, migration patterns, household formation rates, age distribution shifts. AI models how population growth concentrates along corridors — not just city-wide averages — using block-level resolution.
Census 5-year projections
Migration and commute-shed data
Housing permits and zoning data
Input Layer 02
Freight & Economic Activity
Commodity flow surveys, warehouse and logistics center permits, port throughput forecasts, GDP sector projections by corridor region. Freight volumes are one of the most undermodelled variables in conventional capacity planning.
FHWA Freight Analysis Framework (FAF5)
Logistics hub development pipeline
Sector GDP projections by corridor
Input Layer 03
Land-Use & Zoning Change
Approved development plans, rezoning applications, transit-oriented development zones, industrial park designations. Land-use is the strongest long-term predictor of trip generation — and it changes constantly.
Parcel-level zoning databases
Building permit volumes by corridor
TOD and mixed-use plan overlays
Input Layer 04
Climate & Environmental Risk
Flood zone projections, extreme heat frequency, precipitation intensity trends, wildfire risk corridor overlays. AI models how climate stress reduces effective lane capacity — and which corridors will face accelerated deterioration under 30-year projections.
FEMA flood zone projections
NOAA climate scenario layers
Extreme weather event frequency models
Input Layer 05
Behavioural & Modal Shift Trends
EV adoption curves, remote-work penetration rates, autonomous vehicle deployment timelines, ride-share and transit mode-shift projections. Behavioural change is the variable that most consistently breaks conventional forecasts.
EV uptake and charging infrastructure
Remote-work employment share by sector
Transit investment pipeline by corridor
Input Layer 06
Existing Network Performance
Historical AADT counts, level-of-service by segment, incident frequency, recurring congestion patterns, planned network additions from the STIP. The baseline tells the model what the network can absorb before the demand is added.
AADT and AADTT historical counts
Level-of-service (LOS) by segment
State Transportation Improvement Program (STIP)
How the AI Simulation Model Turns These Inputs into Capacity Recommendations
Ingesting the data is only the start. The AI model does four things that conventional demand forecasting cannot: it runs thousands of future scenarios simultaneously, identifies interaction effects between variables, produces capacity recommendations with confidence ranges, and updates its outputs as real-world data evolves.
Multi-Scenario Generation — Thousands of Futures, Not One
The AI model runs thousands of scenario combinations simultaneously — varying population growth rates, freight volumes, land-use development assumptions, and behavioural shift speeds — producing a probability-weighted distribution of traffic volume outcomes for each corridor segment at each planning milestone. Planners see the P10, P50, and P90 outcomes: "In the median scenario, this interchange reaches LOS D by 2038. In the high-growth scenario, that moves to 2034."
Interaction Effect Modeling — Variables That Amplify Each Other
A new logistics centre affects freight volumes, but it also attracts workers who shift residential patterns, which changes commute flows, which affects AM peak loading on a corridor that wasn't in the freight model at all. AI captures these second- and third-order effects. The US Department of Transportation has identified AI-powered demand forecasting as the tool that "allows planners to identify emerging bottlenecks" precisely because it models these complex economic, demographic, and logistics interactions that conventional four-step models treat as independent.
Capacity Gap Identification — Where and When the Network Breaks
The model maps projected demand against current capacity at every corridor segment, identifies the year each segment is projected to cross LOS thresholds, and ranks capital investment need by both timing urgency and volume of users affected. The output isn't "this highway needs upgrading" — it's "this 4.2km segment will reach LOS E by 2033 under median growth, affecting 68,000 daily trips, and requires a capacity intervention costing an estimated $180M if addressed in the 2029–2031 window versus $340M if deferred to 2035."
Continuous Model Updating — Forecasts That Learn From Reality
Singapore's Land Transport Authority uses AI traffic modeling to update demand forecasts continuously as real-world conditions evolve — integrating live traffic data, new development permits, and event scheduling into forecasts that inform both operational decisions and longer-term infrastructure investment. The model doesn't go stale. Every year of real-world data makes the 20-year projection more accurate, because the model is learning which scenario assumptions are tracking toward reality and recalibrating accordingly.
Planning Output: Three Capacity Scenarios, One Decision Framework
The core output of AI capacity planning isn't a traffic forecast — it's a decision framework. Planners receive three scenarios with associated capacity implications, capital cost estimates, and risk profiles, so the investment decision is grounded in a range of futures rather than a single point projection that will inevitably be wrong.
Scenario A — Conservative
Moderate Growth
Assumption
Population growth tracks low-end projections; freight stays on current trajectory; remote work at 25%
Capacity Implication
2-lane widening sufficient through 2040; interchange modification deferred to 2038
Capital Estimate
Lower — right-size for manageable demand
Scenario B — Median (Plan to This)
Expected Growth
Assumption
Population and freight at consensus projections; EV adoption on current curve; planned transit investments proceed
Capacity Implication
4-lane expansion needed by 2035; new interchange justified by 2032; managed lanes viable on core segment
Capital Estimate
Moderate — base plan for STIP and TIP submission
Scenario C — High Growth
Accelerated Demand
Assumption
Major logistics developments confirmed; above-trend population growth; climate-driven route diversion from coastal corridors
Capacity Implication
Express lane addition by 2030; interchange at capacity by 2031; full corridor redesign needed by 2038
Capital Estimate
Higher — risk of underprovision if this scenario materialises
Scenario Modeling · Corridor Analysis · Capital Prioritization · 20-Year Horizons
See All Three Capacity Scenarios for Your Corridor — Before the Next STIP Cycle.
iFactory's AI planning platform generates multi-scenario demand forecasts and capital investment timelines for highway corridor planning at any scale. Book a Demo to run the model on your priority corridor.
AI Simulation vs Conventional Four-Step Model: The Planning Difference
Both methods produce traffic volume forecasts. The difference is in what those forecasts are based on, how reliable they are at 20-year horizons, and how usable they are when real-world conditions diverge from the original assumptions.
| Planning Capability |
Conventional Four-Step Model |
AI Simulation Model |
| Number of Variables |
Population + employment (primary) |
100+ variables across 6 input domains |
| Scenario Outputs |
1–3 manually built scenarios |
Thousands of scenarios with probability weighting |
| Interaction Effects |
Variables modelled independently |
Cross-domain interactions captured (freight x residential x modal) |
| Model Recalibration |
Manual — every 5–10 years |
Continuous — updated as real-world data flows in |
| Capacity Output |
Single volume estimate per year |
P10/P50/P90 volume range with LOS thresholds and capital cost windows |
| Climate Integration |
Not modelled as standard |
Climate risk overlays adjust capacity projections and lifecycle costs |
Where AI Highway Capacity Planning Is Already Operating
The transition from conventional to AI-driven capacity planning is already underway in forward-leaning agencies. Three programmes show what the shift looks like in practice.
Singapore LTA
Real-Time Demand Modeling Across the Full Network
Singapore's Land Transport Authority integrates real-time traffic data, weather information, and event scheduling into AI demand forecasts — informing both operational signal decisions and longer-term infrastructure investment planning from the same model.
US DOT — AI for TPD Initiative
$15M Federal Programme for AI Planning Tools
A multi-phase federal initiative bringing AI directly to state, regional, and tribal transportation agencies — combining AI analytics, geospatial visualisation, and dynamic simulation so agencies can test scenarios, compare design options, and monitor performance across safety and mobility metrics.
Hamburg — #transmove
Agent-Based AI Mobility Forecasting at City Scale
A 4-year project combining AI-based short- and long-term mobility forecasts with agent-based simulation to model individual travel behaviour across the city's network — used to support infrastructure investment decisions and sustainable mobility planning at the corridor level.
"
For twenty years, we submitted our STIP with one traffic projection per corridor and called it a long-range plan. The problem wasn't that we were incompetent — it was that the tools gave us one number and forced us to build an entire capital programme around it. The first time we ran the AI model and saw a range of futures, with probabilities attached and capital cost implications for each, we realised we had never actually been doing capacity planning. We had been doing single-point guessing with a very long lag time before the guess was proven wrong.
— Deputy Director of Planning, State Department of Transportation — 22 Years FHWA and State DOT Experience
Conclusion
Highway capacity planning at a 20-year horizon has always been a probabilistic problem treated as a deterministic one. Conventional four-step models produce a single projection built on population and employment trends — a useful approximation for near-term project delivery, and a genuinely poor tool for understanding which corridors will need capacity, at what scale, and in what time window over a 20-year planning horizon. AI simulation changes the information environment of that decision. Planners receive demand distributions instead of point projections, interaction effects instead of independent variables, and continuously updating forecasts instead of a static baseline that erodes in accuracy every year it isn't recalibrated.
The agencies already deploying AI demand forecasting — Singapore's LTA, DOT programmes under the AI for TPD initiative, and city-scale agent-based modelling programmes in Europe — are building capital investment programmes that track closer to actual infrastructure needs at delivery. The agencies still on conventional models are building to a single projection that will be wrong, without knowing in which direction or by how much. iFactory's AI infrastructure platform brings multi-scenario demand forecasting and capacity simulation into the planning workflow for highway agencies at any scale. Book a Demo to run the model on your priority corridor, or Get In Touch to begin the data onboarding process.
Frequently Asked Questions
The highway you build in 2028 will still be carrying traffic in 2048. Plan it on a forecast that can see that far.
iFactory's AI planning platform gives highway agencies multi-scenario demand forecasting, corridor capacity simulation, and capital investment prioritisation for 20-year planning horizons. Sign up to start your first corridor analysis, or book a demo to see the model in action on a network like yours.