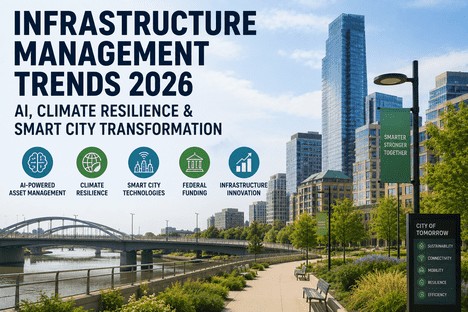
Municipalities and large-scale facility operators across the US and Canada are managing infrastructure portfolios built for a different era — water mains laid in the 1950s, bridges designed before climate stress modelling existed, and civic buildings running on systems that predate modern energy codes. The challenge is not just age. It is invisibility. Without real-time data flowing from those assets, infrastructure managers are making multi-million-dollar maintenance and capital decisions on inspection snapshots that are months or years out of date. IoT changes this entirely. By embedding sensors across infrastructure portfolios and connecting them to AI-driven management platforms, municipalities are achieving 50% reductions in unplanned downtime, 30% maintenance cost savings, and 25% extended asset service life — turning static infrastructure into continuously monitored, dynamically managed systems that generate the condition evidence needed to win federal grants, meet net-zero mandates, and eliminate the 3–5x emergency repair premium. This guide walks you through the complete IoT deployment process for infrastructure management — from sensor selection and zone configuration to CMMS integration and sustainability monitoring. If your organization is still relying on periodic inspections and reactive dispatch, book a free IoT readiness assessment with iFactory to see what a connected infrastructure program delivers.
Step 1: Understand What IoT Infrastructure Monitoring Replaces
IoT deployment for infrastructure management is not an incremental improvement to existing inspection programs — it is a structural replacement of the data architecture that drives every maintenance decision. Before selecting sensors or configuring monitoring zones, infrastructure managers need to map the specific decision failures in their current program that IoT data is designed to eliminate.
Invisible Deterioration
Assets deteriorate continuously — but without sensors, condition is only visible on inspection day. Failures occurring between scheduled visits arrive without warning at 3–5x the cost of a planned intervention.
Climate Stress Blindness
Extreme weather events degrade assets at 37% higher annual cost — but fixed inspection schedules cannot adapt to climate-accelerated deterioration as it happens between scheduled visits.
Silver Tsunami Knowledge Loss
50% of municipal public works staff are nearing retirement. IoT data creates permanent digital condition records that capture what experienced technicians previously knew about each asset's behavior.
Deferred Maintenance Backlog
Without IoT condition evidence, capital requests are anecdotal and grant applications are outcompeted by IoT-equipped peer jurisdictions supplying AI-verified deterioration data.
Not sure where IoT delivers the highest impact in your infrastructure portfolio? Book a free IoT readiness assessment with our infrastructure management specialists.
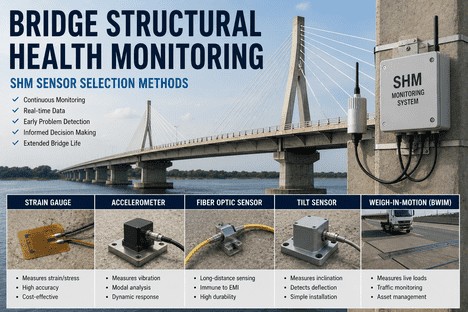
Step 2: Select the Right IoT Sensor Technologies for Your Asset Classes
IoT sensor payloads for infrastructure management combine multiple detection technologies to cover different asset types, failure modes, and condition measurement requirements. Matching the right sensor type to each asset class determines whether your IoT investment generates actionable AI Health Score inputs or just raw data volume.
iFactory IoT Architecture: iFactory ingests data from all five sensor types through a unified cloud API layer — normalizing heterogeneous sensor streams into standardized condition inputs for the AI Health Scoring engine. No separate IoT middleware or custom data transformation required. Sensors from multiple vendors connect to a single iFactory data ingest endpoint, with automatic Health Score recalculation on every new data packet received.
Not sure which IoT sensor combination fits your highest-priority asset classes? Talk to our infrastructure IoT specialists for a no-obligation sensor selection consultation.
Step 3: Configure IoT Monitoring Zones and Asset Condition Baselines
Effective IoT infrastructure monitoring requires strategic sensor placement and zone architecture. The goal is maximizing condition visibility on the highest-risk assets while keeping data ingestion costs proportional to operational value. Here is how to structure the monitoring zone configuration and baseline establishment process for a municipal or large facility portfolio.
Map Infrastructure Risk Zones and IoT Sensor Priority Areas
Identify the highest-consequence infrastructure for priority IoT deployment: assets approaching end of design life, climate-exposed components in flood or freeze-thaw zones, valve manifolds, pump seals, water main sections with corrosion history, single-point-of-failure systems, and pipe joints prone to stress fracture. These locations receive highest sensor density and most frequent data polling intervals — maximizing early warning lead time on assets where failure consequence is highest.
Set IoT Monitoring Frequency by Asset Risk Tier
Define Waypoint Behaviors and Sensor Activation Parameters
For each IoT monitoring point, configure the specific sensor types to activate, data polling interval, local edge processing rules for low-connectivity remote sites, and the Health Score weighting parameters that translate raw sensor readings into AI condition scores. Configure seasonal baseline adjustments for assets in climate-variable zones — ensuring the AI model accounts for normal seasonal operating variation rather than flagging expected winter performance changes as deterioration events.
Establish IoT Condition Baselines for Anomaly Detection
Run initial IoT data collection cycles across all connected assets to capture normal operating signatures for each asset class and each seasonal condition. These baselines enable anomaly detection — identifying when an asset's sensor readings are deviating from its historical operating pattern — rather than relying solely on fixed threshold alerts that miss gradual deterioration. Baseline data forms the founding dataset that seeds iFactory's AI model for increasingly accurate Health Score predictions as operational data accumulates.
Step 4: Configure IoT Alert Thresholds and Automated Maintenance Escalation
IoT monitoring delivers its operational value only when every sensor anomaly is connected to an automated maintenance response. Configure iFactory's IoT alert framework to convert every condition deviation into a tiered escalation — from trend logging through emergency dispatch — automatically and without manual intervention in the data-to-action chain.
IoT Trend
Response:
- Log to asset record with timestamp
- Health Score updated — trend flagged
- Monitoring frequency increased
IoT Warning
Response:
- Planned work order auto-generated
- Skill-matched technician assigned
- Asset manager notified via mobile
IoT Alarm
Response:
- High-priority corrective work order
- Operations team immediately alerted
- Digital Twin scenario activated
IoT Critical
Response:
- Emergency dispatch — bypass queue
- Service continuity protocols activated
- Full incident documentation auto-generated
Seamless IoT-to-Work-Order Integration
iFactory's IoT integration connects every sensor alert directly to escalation workflows — ensuring every condition signal generates the right maintenance response automatically, tracked and documented from detection to work order closure.
Step 5: Integrate IoT Data with CMMS, Capital Planning, and Sustainability Systems
IoT infrastructure monitoring delivers its maximum value when sensor data flows seamlessly into every downstream decision system — maintenance scheduling, capital budget submissions, grant applications, and sustainability compliance reporting. iFactory's integration architecture connects every IoT data stream to these systems automatically through its cloud platform.
IoT Data Sources
- Vibration and strain sensors
- Acoustic emission detectors
- Temperature and thermal sensors
- Flow and pressure transducers
- Energy and power quality meters
iFactory Cloud Platform
Connected Outputs
- Risk-ranked work orders
- State of Good Repair reports
- Federal grant evidence packages
- Net-zero compliance dashboards
- Capital briefing data packages
IoT Infrastructure Integration Checklist
Need help connecting your IoT sensor network to iFactory's AI and sustainability systems? Book a technical integration session with our IoT implementation team.
Step 6: Establish IoT Sensor Calibration and Maintenance Protocols
IoT sensors drift over time as environmental conditions, physical wear, and electromagnetic interference affect measurement accuracy. Without regular calibration and performance auditing, your IoT monitoring program generates unreliable Health Score inputs — potentially missing real deterioration signals or triggering false alarms that erode operator trust in the platform.
Struggling to keep pace with IoT sensor calibration and maintenance across a large portfolio? Our specialists design automated calibration schedules and performance monitoring protocols as part of every iFactory onboarding engagement.
Expert Perspective
"The infrastructure management organizations achieving the best outcomes in 2026 are not the ones deploying the most IoT sensors — they are the ones connecting their sensor data to AI-driven decision systems that convert every condition signal into a scheduled maintenance action before the failure window closes. The value of IoT in infrastructure management is not the data itself; it is the decision quality improvement that data enables at every level of the management hierarchy. A municipality with 500 well-integrated sensors and a connected CMMS will outperform one with 5,000 sensors reporting to disconnected dashboards on every metric that matters: downtime, cost, asset life, grant competitiveness, and net-zero compliance."
Conclusion
Deploying IoT for infrastructure management requires deliberate planning across six interconnected areas: understanding what condition-blind failure modes IoT replaces, selecting the right sensor technologies for each asset class, configuring monitoring zones and condition baselines, establishing tiered alert thresholds with automated escalation workflows, integrating sensor data with CMMS and sustainability systems, and maintaining rigorous calibration and performance protocols. When these elements align, IoT-connected infrastructure management platforms dramatically expand condition visibility, compress the response window from months to hours, and generate the comprehensive audit-ready documentation that federal grant programs and net-zero compliance mandates require. The technology is proven and deployable in 2026 through iFactory's cloud-native platform — purpose-built for municipalities and large-scale facility operators across the US and Canada.
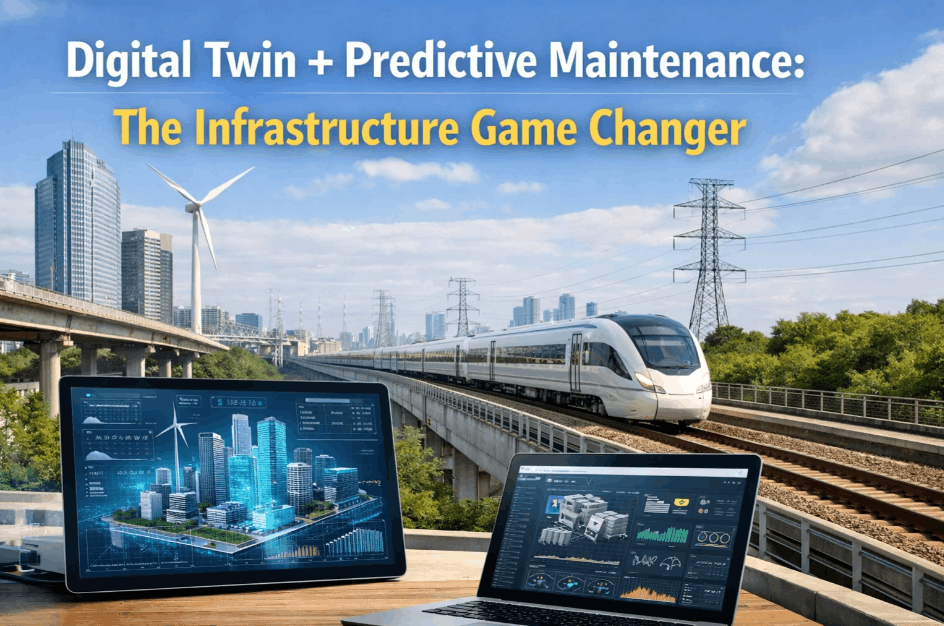
Schedule your iFactory IoT demo to see AI Asset Health Scoring, Digital Twin Simulation, and Real-Time Sustainability Monitoring powered by live IoT data — or connect with our IoT infrastructure specialists for a custom sensor architecture consultation.
Connect Your IoT Sensors to AI-Driven Infrastructure Intelligence
iFactory transforms raw IoT sensor data into AI Health Scores, Digital Twin simulations, skill-matched work orders, and automated sustainability dashboards — one platform connecting every sensor signal to a funded infrastructure outcome.
Deploy iFactory IoT — From Sensor Data to Scheduled Intervention
Join municipalities and facility operators across the US and Canada using iFactory to connect IoT sensors to AI predictions, Digital Twin models, skill-matched dispatch, and net-zero compliance — all in one cloud platform.