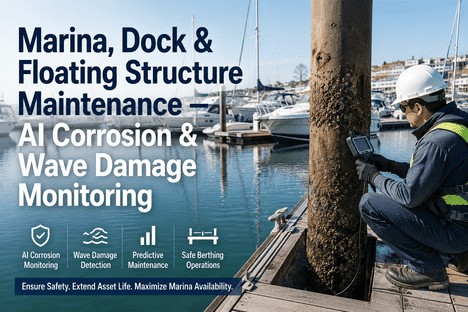
A marina operator in Florida noticed a slight lean in an aluminium gangway connecting the fixed pier to the outer floating dock. The lean was documented, logged in the annual inspection report, and scheduled for review in the next budget cycle. Eleven months later, during a nor'easter with three-metre wave surge, the gangway's corroded hinge assembly failed catastrophically — severing the only pedestrian access to sixty-seven berths, trapping three vessels inside the dock, and triggering emergency removal costs that exceeded the annual marina maintenance budget by a factor of four. That failure was not a weather event. It was a corrosion event that the weather merely exposed. Across the U.S. marina, dock, and port infrastructure sector, deferred structural maintenance on floating structures, pile systems, and wave protection assets is compounding at rates that exceed what periodic visual inspection cycles can catch — and the gap between inspection interval and failure onset is narrowing every year as the infrastructure ages and marine environments become more severe.
Marina Maintenance · Dock Corrosion · Floating Structures · Pile Integrity · Wave Protection · Marine AI
$80 Billion in Annual Marine Corrosion Costs. iFactory Turns Your Floating Infrastructure Into a Continuously Monitored, Predictively Maintained Asset Portfolio.
AI-powered corrosion monitoring, structural integrity assessment, and wave impact analytics for marinas, docks, piers, and floating structures — with real-time pile condition scoring, coating degradation tracking, and the predictive maintenance intelligence that turns reactive repairs into scheduled capital events.
$80B
Annual global cost of marine corrosion across shipping, port, and offshore infrastructure — NACE International / AMPP IMPACT study
15-20x
Cost multiplier for offshore maintenance versus performing work at a yard — making proactive corrosion detection the highest-ROI intervention available
60%
Of offshore maintenance costs are corrosion-related — saltwater exposure, splash zone cycling, and humidity drive structural degradation faster than any other failure mode
93%
AI corrosion prediction accuracy for marine structures — machine learning models now outperform periodic visual inspection schedules for detecting early-stage degradation
Why Marine Infrastructure Degrades Faster Than Inspection Cycles Can Track — and Why Periodic Visual Assessment Cannot Close the Gap
Every marina manager, port engineer, and waterfront facility operator understands corrosion intuitively. What is less understood is the rate at which marine environments accelerate structural degradation beyond what standard inspection intervals are designed to detect — and why the tools most facilities rely on for condition assessment are structurally mismatched to the speed at which damage accumulates in saltwater, splash zone, and wave-loading environments.
A steel pile supporting a floating dock in a coastal marina does not corrode uniformly. It corrodes in zones — atmospheric exposure above the high-tide line, splash zone cycling between wet and dry at the waterline, tidal zone immersion with varying oxygen concentration, and sediment zone burial where microbial corrosion accelerates pitting from below. Each zone corrodes at a different rate, and the most aggressive zone — the splash zone — can degrade steel at five to ten times the rate of full immersion. A visual inspection conducted at low tide may reveal surface rust on the atmospheric zone while the splash zone, where the structural cross-section is thinning fastest, appears visually similar to the previous year's inspection. The difference between a pile that looks acceptable and a pile that has lost thirty percent of its wall thickness is invisible to the human eye — and it is that invisible degradation that produces the catastrophic failure when the next storm surge loads the structure beyond its reduced capacity.
The Four Corrosion Zones of Marine Structures — Why Each Requires Different Monitoring and Why Visual Inspection Misses the Most Critical One
Zone 1 — Atmospheric
Above the high-tide line — the zone where corrosion is visible but least structurally critical
The atmospheric zone of a marine pile or dock structure is exposed to airborne salt spray, humidity, and UV radiation that degrades protective coatings. Corrosion in this zone is readily visible as surface rust, coating blistering, and flange scaling. Because it is visible, it is the zone most likely to be documented in annual inspections — and the zone whose condition least reflects the actual structural integrity of the member. A pile with heavy surface rust in the atmospheric zone may retain full structural capacity, while the same pile with visually minor corrosion at the splash zone may have lost forty percent of its load-bearing cross-section. The atmospheric zone is the inspection trap: the zone that generates the most documentation and provides the least information about real structural risk.
Zone 2 — Splash Zone
The waterline interface where corrosion rates are five to ten times higher than full immersion
The splash zone is the most aggressive corrosion environment for any marine structure. Alternating wetting and drying cycles maintain a thin electrolyte film on the steel surface with high oxygen availability — the conditions that produce the fastest corrosion kinetics. For steel piles, H-piles, and sheet pile walls, the splash zone is where cross-section loss accelerates fastest and where structural failure originates. A pile losing 0.2 mm per year in full immersion may lose 1.0 to 2.0 mm per year in the splash zone. Yet the splash zone is the most difficult to inspect visually — accessible only from a boat at specific tide conditions, often obscured by marine growth, and presenting the same surface appearance across a wide range of remaining wall thicknesses. AI corrosion monitoring with ultrasonic sensor arrays and underwater drone inspection provides the continuous splash zone data that visual inspection cannot — detecting cross-section loss trends that are invisible to the human eye until the structural margin has been exhausted.
Zone 3 — Tidal & Immersion
Continuous submergence where cathodic protection effectiveness determines corrosion outcome
Fully immersed sections of marine piles and dock structures corrode more slowly than the splash zone, but they introduce a different monitoring challenge: cathodic protection system performance. Impressed current and sacrificial anode systems protect immersed steel by shifting the electrochemical potential into the immune range, but these systems degrade over time — anodes deplete, wiring connections corrode, and current distribution shifts as marine growth accumulates on protected surfaces. A cathodic protection system that was adequately protecting a pile array when commissioned may have lost thirty to fifty percent of its effective protection range within five years without any visible indication. AI monitoring of protection potential at multiple points across the structure, combined with anode depletion modelling, provides the continuous cathodic protection performance data that periodic spot measurements cannot — flagging protection gaps before localized corrosion initiates in the immersed zone.
Zone 4 — Sediment & Mud
The zone where microbial corrosion produces pitting rates that exceed all other zones combined
The buried section of a marine pile, below the mudline, operates in a low-oxygen environment where standard electrochemical corrosion models predict minimal corrosion activity. However, sulfate-reducing bacteria in marine sediments create microbiologically influenced corrosion (MIC) conditions that produce pitting rates of 1.0 to 3.0 mm per year — concentrated at discrete points on the pile surface rather than distributed uniformly. MIC pitting is the most dangerous corrosion mode for marine piles because it is entirely invisible from above the waterline, it is not detectable by standard cathodic protection monitoring (which measures average potential, not localized pitting), and a single deep pit at the mudline can reduce the pile's bending capacity below the design load for wave and berthing forces. AI corrosion models trained on sediment chemistry data, pile material records, and adjacent structure failure histories can predict MIC risk zones across a marina or port facility — allowing maintenance managers to target ultrasonic testing and sediment sampling at the specific locations where pitting risk is highest rather than inspecting all piles on the same schedule.
How iFactory's AI Marine Infrastructure Monitoring Changes the Maintenance Paradigm
The tools most marina and port maintenance teams rely on — annual visual inspections, periodic ultrasonic thickness spot checks, and cathodic protection potential surveys commissioned every three to five years — share a fundamental limitation: they produce point-in-time snapshots of structural condition at intervals that are too long to capture the rate of degradation in marine environments. iFactory replaces this periodic assessment cycle with continuous structural intelligence across four integrated capabilities.
Capability 01
Continuous Corrosion Rate Monitoring — Real-Time Wall Thickness Tracking Across All Four Corrosion Zones
Structural Integrity Intelligence
Marine piles, dock structural members, and floating structure hulls lose wall thickness continuously from the moment they are installed. The question is not whether corrosion is occurring — it is at what rate, in which zone, and whether the remaining design margin is sufficient for the loading conditions the structure will face before the next inspection interval. iFactory deploys ultrasonic sensor arrays at the splash zone, immersion zone, and mudline of each monitored structure — collecting thickness data at intervals measured in hours rather than years. The AI corrosion model ingests this thickness data alongside water temperature, salinity, dissolved oxygen, wave height, and cathodic protection potential data to calculate the real-time corrosion rate per zone and project the remaining wall thickness forward across a five-year horizon. When the projected thickness at any zone crosses below the structural design margin for the pile or member, the platform generates an alert with the specific location, corrosion rate trend, and recommended intervention window — converting the maintenance manager's decision from "which piles need inspection this year" to "which piles need intervention before the next storm season."
Zone-specific corrosion rate tracking
5-year remaining wall projection
Automatic structural margin alerts
Capability 02
AI Coating & Cathodic Protection Assessment — Predicting Protection System Failure Before Corrosion Initiates
Protection System Intelligence
The most expensive corrosion event in marine infrastructure is not the one that is detected and repaired — it is the one that begins because a protection system failed between inspection intervals. Coating degradation on floating dock pontoons, steel pile jackets, and concrete deck reinforcement progresses through stages that are invisible to visual inspection until the coating has already lost its barrier function. Cathodic protection anodes deplete at rates that depend on water chemistry, temperature, and the condition of the coating they are protecting — meaning anode life projections based on design assumptions rather than real-time current draw data routinely overstate remaining protection life by twenty to forty percent. iFactory's protection system module monitors coating impedance through embedded sensors and tracks cathodic protection current draw and output potential in real time per anode string. When the coating impedance trend crosses below the threshold at which the cathodic protection system can maintain adequate polarization, or when the remaining anode mass reaches the end of its effective life, the platform schedules a protection system intervention — replacing anodes or recoating a section — before the underlying steel begins to corrode. This is the difference between maintaining the protection system and responding to the corrosion that begins when the protection system fails.
Real-time coating impedance monitoring
Anode depletion tracking per string
Protection system failure prediction
Capability 03
Wave Impact & Floating Structure Motion Analytics — Detecting Mooring, Anchor, and Hull Degradation Through Dynamic Response
Dynamic Load Intelligence
A floating dock, breakwater, or marina walkway is a dynamic structure whose condition is expressed in its response to wave loading, wind, and berthing forces. When the structure is sound — mooring chains at full strength, anchor points secure, hull pontoons with adequate buoyancy — the motion response to a given wave height falls within a predictable envelope. When a mooring chain loses cross-section to corrosion, when a concrete pontoon develops a crack that allows water ingress, or when an anchor pile's holding capacity degrades due to seabed scour, the dynamic response changes before any visible structural damage appears. The floating structure moves differently in the same sea state — a mooring line that was taut at a given wave height now goes slack, a pontoon that rode level now lists two degrees under asymmetric loading, a gangway hinge that operated smoothly now binds under the weight of the structure it was designed to support. iFactory's motion analytics module processes data from inertial measurement units, mooring line load cells, and wave radar to establish the baseline motion envelope for each floating structure in the facility. When the motion response deviates from the envelope — indicating a change in structural condition rather than a change in sea state — the platform flags the specific mooring line, anchor point, or hull section for targeted inspection. This is how continuous motion monitoring converts structural degradation into a detectable signal years before it becomes a visible failure.
Structural motion envelope profiling
Mooring line & anchor condition monitoring
Buoyancy & hull integrity alerts
Capability 04
Predictive Maintenance Scheduling & Capital Planning — Prioritised Repair and Replacement Programme Based on Deterioration Rate, Not Inspection Date
Capital Planning Intelligence
The output of any monitoring system is only as valuable as the maintenance decision it enables. iFactory's predictive maintenance module takes the continuous corrosion rate, coating condition, cathodic protection status, and structural motion data from every monitored asset and produces a prioritised repair and replacement schedule ranked by deterioration urgency — not by inspection cycle date. A steel pile losing wall thickness in the splash zone at 1.8 mm per year with a design margin that projects to zero in three years appears above a pile with the same current thickness that is corroding at 0.6 mm per year with a twelve-year remaining margin. A floating dock mooring chain whose load profile has shifted by twelve percent from baseline appears above a chain with the same visual condition rating but stable load data. For marina and port managers reporting to harbour commissions, municipal authorities, or facility ownership groups, the platform generates the capital planning documentation that translates continuous monitoring data into a fundable, defensible multi-year infrastructure investment programme — with per-structure condition trends, projected failure dates under current deterioration rates, and the cost-benefit comparison of proactive intervention versus reactive repair for each item on the schedule.
Deterioration-rate-based prioritisation
Multi-year capital plan generation
Proactive vs. reactive cost comparison
A Marina Manager Should Know Which Pile Is Losing Wall Thickness Before the Next Storm, Not After the Next Inspection. iFactory Makes Continuous Marine Structural Intelligence the Standard, Not the Exception.
Continuous corrosion rate monitoring, protection system assessment, wave impact analytics, and predictive capital planning — built from sensor data your facility already supports, without drydocking or disruptive inspection campaigns.
How the AI Monitoring Framework Applies Across Marine Infrastructure Types
A port, marina, or waterfront facility spans a wide range of structure types — each with distinct corrosion profiles, loading conditions, and criticality hierarchies. A concrete pier supporting heavy cargo handling equipment has a different degradation profile than a floating dock system supporting recreational vessels, which differs again from a steel sheet pile bulkhead protecting the shoreline. iFactory's AI monitoring engine accounts for structure type, material, age, and exposure conditions in its condition assessment and prioritisation output — ensuring the maintenance sequence it produces reflects the actual risk profile of the facility rather than a generic ranking by structure age.
Marine Infrastructure Type — Degradation Profile and iFactory Monitoring Configuration
Structure Type
Primary Degradation Modes
iFactory Monitoring Configuration
Floating Docks & Pontoons
Concrete pontoon cracking and water ingress, steel hull corrosion at waterline, mooring chain wear and cross-section loss, foam core saturation in encapsulated systems, deck coating degradation
Motion envelope monitoring with IMU sensors per pontoon; ultrasonic hull thickness at waterline band; mooring chain load cell array with cross-section loss model; bilge water sensor for hull breach detection
Steel Pile Systems (Fixed Docks & Piers)
Splash zone corrosion at 5-10x immersion rate, MIC pitting at mudline, cathodic protection underperformance at pile tips, coating breakdown at pile cap connections
Splash zone ultrasonic array with automated thickness trending; sediment MIC risk mapping from chemistry data; CP potential monitoring at pile top and tip with anode depletion modelling
Concrete Structures (Seawalls & Bulkheads)
Chloride-induced rebar corrosion, carbonation of cover concrete, freeze-thaw cycling in tidal zone, abrasion from wave-borne sediment, joint sealant degradation
Embedded corrosion potential sensors in rebar mat; half-cell potential mapping with drone-based deployment; chloride ingress modelling from water quality data; crack width monitoring at known stress points
Floating Breakwaters & Wave Attenuators
Mooring system fatigue from cyclic wave loading, anchor pile uplift and scour, hinge and connector wear between segments, hull fatigue at attachment points
Mooring tension monitoring with load cell clusters per anchor line; segment articulation angle sensors; wave height correlation with mooring load trends; anchor scour detection via seabed sonar
"
We operate a marina with three hundred and twenty berths on a floating dock system installed in 1998. Our inspection protocol called for annual visual inspection of the steel pile system and a cathodic protection survey every three years. The 2022 CP survey showed adequate protection across all measured points. Eight months later, during a maintenance dive to replace a mooring cleat, our diver found a pile in the outer row with a hole completely through the web at the splash zone — the wall thickness had gone from twelve millimetres to zero in a zone less than two metres wide. That pile should not have failed based on our inspection data. But our inspection data was measuring protection potential, not wall thickness. iFactory's continuous monitoring on the remaining piles showed us that three other piles in the same row had corrosion rates approaching the failure threshold. We sleeved all four in a single planned campaign at less than half the cost of an emergency pile replacement. We now monitor thickness, not just potential — and we have not had a single pile failure in the two years since.
— Marina Operations Director, Gulf Coast Recreational Marina — 320 Berths, 18 Years Marine Facility Management
Conclusion
The $80 billion annual cost of marine corrosion is not going to be reduced by increasing the frequency of visual inspections, extending cathodic protection survey intervals, or relying on the same periodic assessment model that has failed to prevent the structural failures that occur between inspection cycles. It will be reduced — pile by pile, dock by dock, structure by structure — by marina operators, port engineers, and waterfront facility managers who deploy continuous AI-powered monitoring that tracks corrosion rate, coating condition, cathodic protection performance, and structural dynamic response in real time, and who translate that data into a prioritised, defensible maintenance programme that intervenes before the structural margin is exhausted.
AI-powered marine infrastructure monitoring changes the fundamental dynamic of waterfront maintenance. When every pile in the facility has a real-time corrosion rate, every mooring line has a continuous load profile, every floating structure has a motion envelope that reveals changes in structural condition, and every protection system has a remaining life projection — the maintenance manager's role shifts from scheduling inspections and hoping nothing fails between them to managing a portfolio of known deterioration rates with predictable intervention timelines. The data does what the annual visual inspection cannot: it reveals the degradation that is happening below the waterline, inside the coating, and between the inspection cycles.
iFactory's marine infrastructure monitoring module gives marina and port maintenance managers the continuous corrosion rate tracking, protection system intelligence, wave impact analytics, and predictive capital planning that transform a reactive repair cycle into a controlled, fundable infrastructure stewardship programme. Book a demo to see how iFactory maps to your facility's structure inventory and generates your first continuous condition baseline, or talk to an expert about your current marine infrastructure situation and how to structure the inspection data you already have into a continuous monitoring programme.
Frequently Asked Questions
Your Marine Infrastructure Is Corroding Right Now. iFactory Turns Continuous Monitoring Into a Predictable Maintenance Programme Your Board Can Fund.
Continuous corrosion rate tracking, protection system intelligence, wave impact analytics, and predictive capital planning — built from sensor data your facility already supports, starting from day one without drydocking or operational interruption.