The U.S. interconnection queue now holds over 2,300 gigawatts of proposed generation and storage capacity — more than twice the nation's entire installed generating fleet. A project entering the queue today faces a median wait of five years before reaching commercial operation, up from seventeen months barely a decade ago. Of every ten projects that apply, fewer than two will ever deliver power. The remaining eight withdraw after burning through study timelines, upgrade cost allocations, and financing windows that expire before the interconnection agreement is signed. This is not a failure of engineering. It is a failure of process velocity — and AI-powered interconnection management is the only intervention scaling fast enough to close the gap between the pace of renewable deployment and the capacity of the grid to absorb it.
Grid Interconnection · Distributed Generation · DER Management · AI Integration · Renewable Queue
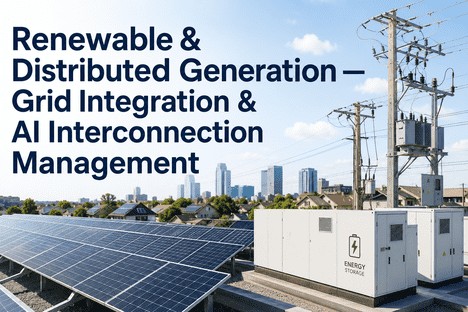
2,300 GW in Interconnection Queues. iFactory Turns Your DER Integration Pipeline into a Predictable, Automated Process.
AI-powered interconnection management for utility distribution systems — with automated application screening, hosting capacity analytics, protection coordination modelling, and the grid-ready documentation that turns a backlogged queue into a controlled interconnection programme.
2,300 GW
Total active capacity in U.S. interconnection queues — double the nation's entire installed generation fleet — Lawrence Berkeley National Laboratory, 2025
5 Years
Median time from interconnection application to commercial operation — a 250% increase from the 17-month average for projects completed before 2015
86%
Of queued projects never reach commercial operation — withdrawn after multi-year studies reveal prohibitive upgrade costs or study timeline exhaustion
$30M
DOE AI4IX programme funding to accelerate interconnection through AI — recognising that manual study processes cannot scale to meet deployment demand
Why the Interconnection Queue Keeps Growing — and Why Manual Study Processes Cannot Catch Up
The interconnection bottleneck is widely discussed in aggregate terms — queue volumes, median wait times, withdrawal rates — but the mechanism that produces these numbers is poorly understood outside utility engineering departments. Understanding that mechanism is essential for any utility manager, developer, or policymaker trying to decide where to invest in solutions.
Every interconnection request triggers a sequence of studies — feasibility, system impact, and facilities study — each requiring power flow modelling, short-circuit analysis, and protection coordination review. When a utility interconnection team receives fifty requests in a cycle and each requires two to four weeks of engineer-hours to study, the queue grows faster than engineers can clear it. Add restudies triggered by project changes, cluster study coordination across multiple applicants, and the transmission upgrade cost allocation process, and the timeline stretches from months into years. The fundamental problem is not that interconnection engineers are slow. It is that the volume of requests has outpaced the capacity of manual study workflows by an order of magnitude — and the gap is widening every quarter as renewable deployment accelerates.
The Four Stages Where Interconnection Processes Break Down — and Where AI Intervention Changes the Outcome
Stage 1 — Application Intake & Screening
Incomplete applications consume 30% of screening capacity before substantive review begins
Utility interconnection teams report that nearly a third of submitted applications arrive with incomplete technical data, missing site control documentation, or incorrect study request selections. Each deficient application must be flagged, returned, and resubmitted — consuming screening capacity that should be directed toward technically complete requests. An AI screening layer validates application completeness against utility-specific requirements at the point of submission, routing compliant applications to the study queue and returning deficiencies with correction guidance within minutes rather than the current two- to three-week review cycle. This single intervention can reduce end-to-end screening time by 60 to 70 percent and eliminate the largest source of queue dwell time before substantive technical review begins.
Stage 2 — Feasibility & Impact Studies
Power flow and short-circuit analysis remains the most engineer-hours-intensive stage
Each interconnection request requires power flow modelling under multiple loading scenarios, fault current contribution analysis, thermal overload assessment, and voltage impact evaluation. For a utility processing fifty requests per cycle, this represents hundreds of simulation runs — each requiring model setup, parameter validation, result interpretation, and documentation. AI-powered study automation reduces the engineer-hours per study by performing the initial simulation run set, flagging results that fall outside established criteria, and generating the study report draft — reserving engineer review for cases where results require engineering judgement. Utilities piloting AI-assisted study workflows have reduced per-study cycle time by 40 to 55 percent while maintaining or improving study quality through standardised simulation parameters and automated result validation.
Stage 3 — Protection Coordination & Grid Interconnection
Bidirectional flow reconfigures protection schemes in ways manual review catches late
Distributed generation changes fault current magnitude and direction on distribution circuits — meaning protective devices coordinated for radial flow may misoperate under reverse-power conditions. Protection coordination review is the stage where study assumptions most frequently diverge from field conditions, triggering restudies that add eight to sixteen weeks to the timeline. An AI protection coordination module evaluates the distribution system model against IEEE 1547-2018 interconnection requirements, identifies protection gaps introduced by each proposed DER installation, and recommends relay setting adjustments — all before the detailed study phase begins. This upstream detection of protection coordination conflicts eliminates the restudy cycle that currently accounts for nearly 40 percent of interconnection timeline variance across U.S. distribution utilities.
Stage 4 — Upgrade Cost Allocation & Interconnection Agreement
Cost uncertainty is the single largest driver of project withdrawal after study completion
Projects that survive the study phase frequently withdraw when the allocated transmission upgrade cost exceeds the project's financial threshold — and the timing of cost disclosure often arrives too late in the development cycle for the developer to adjust the project scope or financing structure. AI cost escalation modelling provides early-stage upgrade cost estimates based on similar projects in the same utility territory, allowing both the utility and the developer to identify cost-prohibitive interconnections before the developer has invested in full study fees. iFactory's cost modelling engine uses historical upgrade cost data, transformer lead time indices, and construction cost escalation factors to generate a probabilistic upgrade cost range at the application screening stage — giving developers a cost decision point before they enter the study queue rather than after they emerge from it.
What AI-Powered Interconnection Management Does That Manual Study Processes and Spreadsheet Tracking Cannot
The tools most utility distribution planning teams use to manage interconnection requests — spreadsheet-based queue tracking, manual power flow studies, and point-in-time hosting capacity analyses — share a common limitation: they treat each interconnection as a discrete engineering problem rather than as one element of a dynamic portfolio that must be managed as a system. iFactory replaces this fragmented workflow with continuous interconnection intelligence across four integrated capabilities.
Capability 01
Automated Application Screening — Validating Completeness Against Utility Requirements at the Point of Submission
Queue Intake Automation
Every utility maintains interconnection application requirements that differ by system size, technology type, and interconnection voltage level. A 50 kW residential solar installation requires different technical data than a 5 MW community solar project or a 20 MW battery storage facility — yet the manual screening process applies the same sequential review workflow to all three. iFactory's AI screening engine encodes the utility's interconnection tariff requirements into a rule-based validation layer that checks each application for completeness against the specific requirements of its project category at submission. Missing studies, incomplete site diagrams, incorrect fee calculations, and omitted equipment certifications are flagged automatically — with correction guidance returned to the applicant within minutes rather than weeks. For utility interconnection teams processing fifty to two hundred applications per cycle, this automated screening layer reduces the administrative review burden by approximately 70 percent and redirects engineer capacity from application triage to substantive technical review.
Instant application validation
70% reduction in screening time
Tariff-specific rule configuration
Capability 02
Hosting Capacity & Voltage Impact Analytics — Real-Time Distribution System Visibility as New DER Requests Arrive
Grid Impact Intelligence
A distribution feeder that can accommodate three additional 500 kW solar installations today may be at hosting capacity after the first two are approved — but without a system that tracks committed interconnections against available capacity in real time, the third application proceeds through the study queue and reaches the cost allocation stage before the utility discovers the capacity constraint. iFactory's hosting capacity module maintains a continuously updated model of available distributed generation capacity per distribution feeder, substation, and voltage level — updated automatically as interconnection agreements are executed and as new requests enter the queue. When a new application would place the feeder above its hosting capacity threshold, the platform flags the constraint at application intake rather than at study completion — saving the applicant the cost of a full study cycle for a project that cannot interconnect at the requested location without significant distribution upgrades. For utility planning teams, the hosting capacity layer converts the interconnection queue from a list of pending applications into a dynamic capacity management dashboard that shows where headroom exists and where distribution upgrades will be required to support additional DER penetration.
Per-feeder capacity tracking
Real-time queue-capacity alignment
Automated constraint flagging
Capability 03
Protection Coordination Modelling — Identifying Relay and Recloser Conflicts Before the Detailed Study Phase
Protection Intelligence
Protection coordination review is the interconnection study stage most vulnerable to restudy cycles — because the impact of distributed generation on distribution system protection is configuration-specific and frequently reveals conflicts that initial screening studies do not capture. A 2 MW solar installation on a feeder with legacy electromechanical reclosers may cause sympathetic tripping on adjacent feeders during fault conditions — a condition that standard power flow studies may not flag but that protection coordination review catches only after the preliminary study is complete. iFactory's protection coordination module applies AI pattern recognition to the distribution system model and the proposed DER configuration, evaluating fault current contribution, relay reach, and coordination interval against IEEE 1547-2018 requirements before the detailed study phase begins. When a protection conflict is identified, the platform recommends specific mitigation options — recloser replacement, relay setting adjustment, or interconnection transformer impedance modification — with estimated cost and schedule impact for each. This upstream detection eliminates the restudy cycle that currently adds eight to sixteen weeks to interconnection timelines for DER projects that trigger protection coordination conflicts.
IEEE 1547 compliance checking
Automated conflict detection
Mitigation cost estimation
Capability 04
Queue Analytics & Interconnection Dashboard — Portfolio-Level Visibility into Queue Performance, Bottlenecks, and Cycle Time Trends
Queue Performance Intelligence
Most utilities manage interconnection queue performance through static reports generated quarterly or annually — providing a retrospective view of cycle times, withdrawal rates, and study backlog volume that arrives too late to inform operational adjustments. iFactory's queue analytics module provides real-time visibility into queue performance metrics: median study cycle time per study phase, application withdrawal rate by technology type and feeder location, engineer-hours consumed per study phase versus plan, and the projected clearance date for the current queue based on available study capacity and incoming application volume. When a metric deviates from the established threshold — study cycle time exceeding forty-five days for feasibility studies, or a single feeder receiving more than five applications in a cycle — the platform generates an alert with the specific operational intervention recommended. For utility distribution planning managers reporting to state commission interconnection performance dockets, the analytics layer provides the auditable performance data required to demonstrate compliance with Order 2023 cluster study timelines and interconnection tariff service quality standards.
Real-time queue performance metrics
Cycle time & withdrawal analytics
FERC Order 2023 compliance reporting
A Backlogged Interconnection Queue Is a Blocked Renewable Energy Pipeline. iFactory Turns Queue Management into a Predictable, Automated Interconnection Programme.
Automated application screening, hosting capacity analytics, protection coordination modelling, and queue performance dashboards — built from the distribution system data your engineering team already maintains, without commissioning a separate grid integration study.
How the AI Interconnection Framework Applies Across DER Technology Types
A utility interconnection queue spans a wide range of distributed energy resource types — each with distinct grid impact profiles, study requirements, and interconnection cost structures. Rooftop solar installations below 50 kW follow different study pathways than community solar gardens above 1 MW, which differ again from standalone battery storage facilities or hybrid solar-plus-storage projects. iFactory's AI interconnection engine accounts for DER technology type, capacity range, and interconnection voltage level in its screening and study workflows — ensuring that the study pathway applied to each request matches the technical complexity and grid impact profile of the proposed installation.
DER Technology Type — Interconnection Study Profile and iFactory Configuration
DER Type
Primary Grid Integration Challenges
iFactory AI Configuration
Rooftop Solar PV (Residential & Small Commercial)
High application volume straining screening capacity, voltage rise on secondary circuits during peak generation, reverse power flow through distribution transformers designed for unidirectional loading
Automated screening with simplified application pathway for sub-50 kW systems; secondary circuit voltage rise modelling using smart meter data; fast-track study workflow for systems on feeders with confirmed hosting capacity headroom
Community & Commercial Solar (100 kW – 5 MW)
Feeder-level thermal overload during peak generation, voltage regulation interaction with LTC transformers and line regulators, protection coordination with multiple DER on shared feeder
Cluster study integration with feeder capacity model; voltage regulation impact assessment including LTC tap changer cycling analysis; protection coordination modelling for multi-DER feeder configurations with automated mitigation recommendations
Battery Energy Storage Systems
Dual-direction power flow (charging and discharging) complicating protection scheme design, fault current contribution varying by inverter operating mode, state-of-charge dependent grid support capability
Bidirectional protection scheme validation with fault current contribution modelling for grid-forming and grid-following inverters; SOC-aware grid support capability assessment; fast-charge cycle impact on distribution transformer loading
Hybrid Solar + Storage
Combined fault current contribution exceeding single-technology thresholds, study scope complexity from co-located but separately metered systems, export limitation and power control system modelling
Aggregate fault current modelling for co-located inverter-based resources; power control system (PCS) model validation against IEEE 1547-2018 requirements; combined thermal and voltage impact assessment under coordinated dispatch scenarios
"
We were processing interconnection applications with a team of five engineers reviewing each submission manually — and we were averaging forty-five days just to return an initial completeness determination. When we deployed iFactory's automated screening layer, the completeness review dropped from forty-five days to the same business day. Our engineers went from triaging incomplete applications to reviewing technically substantive studies. Within four months, our median end-to-end study cycle time dropped by 37 percent and our queue backlog cleared for the first time in three years. The board did not approve a new interconnection process because we said it was better. They approved it because the data showed we were processing applications at double the previous throughput with the same engineering headcount.
— Director of Distribution Planning, Mid-Atlantic Electric Utility — 180,000 Customers, 15 Years Utility Engineering Leadership
Conclusion
The 2,300 GW interconnection queue backlog is not going to be resolved by hiring more study engineers, extending queue processing timelines, or hoping that FERC Order 2023 reforms alone absorb the volume of incoming applications from a renewable energy industry deploying at record scale. The queue will be cleared — application by application, study by study, interconnection agreement by interconnection agreement — by utilities that deploy AI-powered process automation to do what manual workflows cannot: screen applications instantly, model grid impact continuously, detect protection conflicts before they trigger restudy cycles, and give every queue participant a realistic timeline and cost expectation from the day they submit.
AI-powered interconnection management changes the fundamental economics of the queue. When application screening is automated, hosting capacity is modelled in real time, protection coordination conflicts are identified before detailed studies begin, and queue performance is monitored continuously — the utility interconnection team's role shifts from processing applications sequentially to managing a controlled interconnection programme. The process velocity increases without requiring additional headcount. The developer experience improves because timelines become predictable. And the renewable energy pipeline that the interconnection queue was designed to serve can actually flow at the pace the nation's decarbonisation targets require.
iFactory's grid integration and interconnection management module gives utility distribution planning teams the automated application screening, hosting capacity analytics, protection coordination modelling, and queue performance dashboards that transform a backlogged interconnection queue into a predictable, fundable, and auditable DER integration programme. Book a demo to see how iFactory maps to your utility's distribution system model and generates your first automated interconnection study pipeline, or talk to an expert about your current queue situation and how to structure the interconnection data you already have into a controlled, automated interconnection programme.
Frequently Asked Questions
Your Interconnection Queue Is Already Growing. iFactory Turns It Into a Predictable, AI-Powered DER Integration Programme.
Automated application screening, hosting capacity analytics, protection coordination modelling, and queue performance dashboards — built from the distribution system data your engineering team already maintains, starting from day one.