Twenty-three million Americans live and work behind levees. The National Levee Database tracks over 24,000 miles of levee systems across all 50 states — yet nearly two-thirds of those levees have never been assessed for the risks they pose to the communities behind them. The American Society of Civil Engineers gives the nation's levees a D+ on its infrastructure report card, and the estimated cost to bring them into a state of good repair is far beyond the $70 billion figure estimated in 2021. More than 30% of the levee systems in the US Army Corps of Engineers portfolio are over 60 years old, including at least 163 structures built before 1950. These ageing embankments were designed using rainfall data that cannot account for the intensifying storm events that climate change is producing. The gap between the condition data that levee inspection programmes generate and the risk prioritisation decisions that data could drive is not a sensor technology problem — it is a condition assessment, documentation, and maintenance prioritisation problem. Reliability engineers who have deployed inspection and monitoring platforms report that the technology alone changes nothing. What changes outcomes is the maintenance discipline built around the programme: whether slope stability inspections follow consistent protocols, whether seepage observations are documented with GPS location and photographic evidence, whether animal burrow and crack repairs are tracked to completion, and whether engineering leadership uses condition data to prioritise capital investment rather than responding to the most recent visual concern. Building a data-driven levee condition assessment culture is not a drone deployment project. It is a sustained reliability engineering programme with defined inspection stages, deliberate documentation standards, and a risk prioritisation framework that connects field observations to strategic flood protection outcomes. This guide is written for reliability engineers, levee maintenance supervisors, and flood risk managers at the point of making that transition.
24,000+
Miles of levees tracked in the National Levee Database — but the true total may exceed 100,000 miles including non-federal and unregistered systems
66%
Of levees in the national database have never undergone a formal risk assessment — their true condition remains unknown until a flood event tests them
23M
People in the United States live behind levees — yet many communities have no visibility into the inspection history or condition rating of the structures protecting them
32%
Of USACE-portfolio levee systems are over 60 years old — built to rainfall standards that are now obsolete in an era of climate-intensified storm events
Levee Condition · Flood Protection · AI Assessment · Risk Prioritisation · Reliability
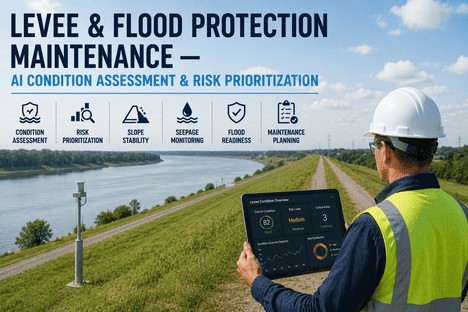
The Levee Inspection You Run Today Determines Whether the Community Stays Dry Tomorrow. iFactory Makes Condition Data Actionable.
iFactory's levee condition assessment platform gives reliability engineers the infrastructure to document inspection findings, track seepage and slope observations, prioritise maintenance actions by risk level, and build a flood protection readiness culture that holds the operation accountable to condition data rather than assumptions.
The Three Critical Failure Modes — What Every Reliability Engineer Must Monitor
Levee failures rarely happen without warning signs. The research published in the International Journal of Disaster Risk Reduction confirms that the majority of levee breaches are preceded by observable condition changes — seepage progression, slope deformation, vegetative stress, and animal burrowing. The challenge is not that these signs are invisible. It is that they are undocumented, untracked, and unconnected to a prioritised maintenance response. Three failure modes account for the overwhelming majority of levee incidents, and each has a distinct monitoring and documentation protocol that separates proactive levee management from reactive emergency response.
Seepage and Internal Erosion
Water migrating through the levee body or foundation gradually removes soil particles, creating preferential flow paths that weaken structural integrity. The most common precursor to catastrophic breaching, seepage is often visible as wet spots, sand boils, or vegetation changes on the downstream slope.
Key Monitoring Indicators
Piezometric levels
Seepage flow rate
Sand boil activity
Turbid discharge
Documentation priority: GPS-located observation point, estimated flow volume, photographic record, comparison with previous inspection baseline.
Slope Instability and Erosion
Surface erosion from wave action, overtopping, or heavy rainfall progressively removes embankment material. Slope instability develops when internal pore pressure reduces soil shear strength, leading to slumping, cracking, or rotational failure. Wave wash and runoff channels accelerate surface degradation.
Key Monitoring Indicators
Crack formation
Slope movement
Rill and gully erosion
Vegetation distress
Documentation priority: Crack dimensions and orientation, slope inclination measurement, erosion channel depth and width, GPS survey points for repeat measurement.
Animal Burrowing and Vegetation Intrusion
Animal burrows create direct seepage pathways through the levee body that accelerate internal erosion. Rodents, muskrats, and groundhogs can create complex tunnel networks that compromise embankment integrity. Deep-rooted vegetation on the levee crest and downstream slope creates preferential seepage paths when roots decay.
Key Monitoring Indicators
Burrow entrances
Root decay cavities
Tree and brush growth
Mound or subsidence
Documentation priority: Active burrow location map, estimated tunnel depth and extent, vegetation species and density assessment, repair history with date-stamped photographic closure evidence.
Levee Condition Assessment Maturity — Four Stages of Flood Protection Readiness
A Swiss Re Institute study published in 2024 found that properly maintained levees and flood protection systems can reduce flood damage by 60% to 90%, and that every dollar invested in protective infrastructure yields up to ten dollars in avoided rebuilding costs. The difference between a levee system that achieves this level of protection and one that fails during a moderate flood event is not the embankment material — it is the condition assessment culture that determines whether maintenance priorities reflect current risk rather than historical routine. Understanding where your levee maintenance programme sits on the condition assessment maturity curve is the starting point for any improvement strategy.
Levee Condition Assessment Maturity Model — Where Does Your Maintenance Programme Stand?
Stage
Maintenance Behaviour
Data Characteristics
Leadership Priority
Inspections conducted only after flood events or visible distress. No scheduled condition assessment protocol. Repairs addressed reactively based on urgency of the moment.
Paper field notes, scattered photographs, no centralised inspection record. Observations filed without GPS location or comparison to previous condition data.
Establish a scheduled inspection cadence for every levee segment. Create standardised condition assessment forms with defined observation categories.
Inspections conducted on a fixed schedule. Condition findings documented consistently. Repairs tracked but prioritised by availability rather than risk level.
Centralised inspection database with standardised forms, photographic evidence, and GPS location tagging. Repair status tracked in a work order system.
Transition from schedule-based to risk-based maintenance prioritisation. Establish condition rating categories and connect them to repair response timelines.
Condition data determines inspection frequency and maintenance priority. Segments with higher risk ratings are inspected more frequently. Repairs are scheduled by risk score rather than calendar order.
Risk-scored condition database with trend analysis by segment and failure mode. Automated work order generation at defined risk thresholds. Condition rating history tracked for each levee segment.
Build team competence in condition assessment protocols. Integrate flood modelling data with condition ratings. Use trend data for capital investment justification.
AI-assisted condition anomaly detection identifies developing failure indicators before they are visible during standard inspections. Maintenance spend is allocated by predictive risk model output.
AI-driven trend analysis across inspection history, instrument data, and flood event records. Automated anomaly flagging. Integrated remote sensing data from drone and satellite platforms.
Integrate condition analytics into strategic flood risk planning. Use predictive data for community resilience reporting. Benchmark condition assessment programme against industry peers.
Risk Prioritisation · Condition Rating · Trend Analytics · Flood Readiness
Every Dollar Spent on Levee Maintenance Saves Up to Ten in Flood Recovery. iFactory Shows You Where to Spend It First.
iFactory surfaces risk-based maintenance priorities derived from field condition data, inspection history, and observed deterioration trends — so reliability engineers can allocate limited resources to the segments that need them most, before the next flood event.
Condition Assessment Metrics — What to Track at Each Level of Your Levee Maintenance Programme
The following condition assessment framework connects every field observation to a risk rating, a response priority, and a role responsible for action. iFactory's condition assessment platform tracks all of these with configurable inspection protocols, threshold-based work order generation, and risk-tiered dashboards at every level of the organisation.
Inspection completion rate — scheduled segment inspections completed vs. missed per review period, with overdue segment alerts
Condition observation documentation quality — percentage of findings with GPS location, photo evidence, and condition rating entered correctly
Seepage and burrow observation density — number of active observations tracked per levee mile, with trend direction quarter over quarter
Segment risk distribution — percentage of levee miles in each condition rating category, with month-over-month trend for deteriorating segments
Repair closure velocity — average days from high-risk finding identification to corrective action completion, tracked by failure mode category
Recurring observation rate — segments with the same finding type in consecutive inspection cycles, indicating unresolved underlying conditions
High-risk segment remediation rate — percentage of high and very high risk levee miles with active remediation plans and funded repair programmes
Flood protection readiness score — composite metric combining inspection timeliness, repair closure rate, and condition trend by flood protection zone
Capital allocation efficiency — maintenance and rehabilitation spend allocated by risk priority band, with cost-per-risk-point-reduced metric
Portfolio condition health index — percentage of total levee miles in satisfactory vs. unsatisfactory condition across the full flood protection system
Risk reduction investment ROI — capital deployed vs. risk score reduction achieved across the levee portfolio, measured year over year
Community flood resilience trend — population protected behind levees in satisfactory vs. declining condition categories, trended quarterly
The Reliability Playbook — Five Actions That Build a Risk-Based Levee Condition Assessment Culture
Culture in levee maintenance does not change through inspection protocol documents or new monitoring technology purchases. It changes through consistent engineering leadership, visible risk accountability, and the gradual replacement of calendar-based maintenance with condition-based prioritisation. These five actions distinguish levee management programmes that maintain cost-effective flood protection from those that discover their maintenance gaps during the next flood event.
Action 01
Standardise the Condition Assessment Protocol Before You Deploy Any Technology
Foundation Step
Before configuring any inspection dashboard, define the condition rating categories that will apply to every levee segment — for each failure mode, specify what constitutes a minor observation, a moderate concern, a significant finding, and a critical deficiency. Define the response timeline for each rating: critical findings require action within 24 hours, significant findings within one week, moderate findings within one month, and minor observations within the next scheduled inspection cycle. Assign a named individual responsible at each escalation level. This condition assessment protocol — built before the first digital inspection is conducted — is what separates risk-based maintenance programmes that protect communities from inspection programmes that produce filed reports. Every observation should trace to a rating, a response timeline, and a responsible decision-maker.
Action 02
Start Every Flood Risk Review with the Condition Assessment Dashboard
Leadership Behaviour
The most powerful signal a reliability engineering director sends about the importance of condition data is how they open every flood risk review. If quarterly flood preparedness meetings, post-event damage assessments, and capital planning sessions begin with a live condition dashboard review rather than a verbal status update, the message to every inspector and engineer is unambiguous: condition data is how we measure flood protection readiness here. Establish a standing protocol where the first five minutes of any flood risk review involves opening iFactory's condition assessment dashboard and reviewing the current segment risk distribution, critical finding closure status, and condition trend direction across the portfolio. Leaders who do this consistently see their teams begin preparing condition trend analyses before they arrive at meetings, rather than constructing post-hoc explanations after a flood event has already tested the levee system's weakest segment.
Action 03
Build Documentation Competence at the Inspector Level — Field Data Quality Determines Risk Accuracy
Team Capability
The accuracy of every risk score in your condition assessment programme is entirely dependent on the quality of field observation documentation at the point of inspection. An inspector who records a seepage observation without GPS coordinates, estimated flow rate, and a comparative note to the previous inspection creates a data gap that no dashboard analysis can recover. The solution is not more checkboxes — it is understanding and motivation. Inspectors who understand why precise documentation matters — this GPS-tagged seepage point is what tells the engineer whether a seepage path is extending or this photographic comparison is what determines whether a crack is active or historical — document more accurately than those who see condition data entry as administrative overhead. Invest in hands-on field training sessions that walk inspectors through the complete documentation-to-decision chain for each failure mode category. This investment produces the highest return of any activity in a levee condition assessment programme.
Action 04
Use Risk Tiering to Allocate Maintenance Spend — Not All Segments Need the Same Attention Frequency
Resource Optimisation
A levee maintenance programme that inspects every segment on the same schedule is treating all risk levels as equal — which means it is spending too much time on low-risk segments and not enough on the segments that need attention. Risk-based tiering assigns inspection frequency and maintenance priority based on the combination of condition rating and consequence of failure. High-risk segments behind population-dense areas are inspected quarterly and have pre-approved repair budgets. Low-risk segments behind agricultural land are inspected annually with standard maintenance responses. This approach is endorsed by the USACE Levee Rehabilitation Programme framework and maximises the flood protection outcome of every dollar spent. iFactory's platform supports risk-based inspection scheduling that automatically adjusts segment inspection frequency as condition ratings change.
Action 05
Conduct an Annual Condition Assessment Programme Review — Let the Data Tell You What to Change
Continuous Improvement
A risk-based levee condition assessment programme does not fix its inspection protocols and risk thresholds at launch and use them forever. As the programme matures and condition data accumulates, the condition categories that were meaningful at Stage 2 become baseline expectations rather than active risk differentiators. An annual programme review asks: which inspection categories are producing observations that drive maintenance decisions and which are generating data that nobody uses? Are there developing failure modes in your levee portfolio that the current assessment protocol does not address? Do the risk thresholds still reflect the current flood exposure, or have climate-intensified storm events changed the risk calculation? Organisations that evolve their condition assessment protocols annually maintain higher flood protection readiness with the same or lower total inspection investment, because every observation they collect is connected to a risk decision rather than filed as compliance documentation. The Water Resources Development Act of 2022 increased the maximum levee rehabilitation funding per project from $10 million to $25 million — but accessing that funding requires condition documentation that demonstrates need, not assumptions. iFactory's platform keeps your condition data in the format that funding applications require.
"
We manage over 80 miles of levee system across three flood protection zones. For years, our inspection programme produced comprehensive field reports that were filed away and consulted only after a flood event had already tested the weakest segment. We had data. We did not have a maintenance prioritisation system driven by that data. What changed was when I, as the lead reliability engineer, stopped reviewing inspection findings in quarterly summary meetings and started managing the condition dashboard in real time. Within two months, our inspectors were tagging observations with GPS coordinates and risk ratings because they could see their input generating work orders and repair budgets. Within four months, we identified a deteriorating segment that would have failed during the next heavy rainfall — and we repaired it before the spring flood season. The inspection checklists did not change the programme. I changed how we used the data. The platform made it possible.
— Lead Reliability Engineer, Regional Flood Protection District — 18 Years Levee and Dam Safety Engineering
Conclusion
The flood protection readiness culture that separates high-performing levee maintenance programmes from those that discover their gaps during emergencies is not built by deploying inspection technology or drone monitoring platforms. It is built by reliability engineers who change how they assess condition, how they prioritise maintenance, and how they hold their teams accountable to risk-based documentation standards. With 24,000 miles of levees in the national database, 66% of them never formally risk-assessed, and an ASCE grade of D+ for the nation's levee infrastructure, the organisations that close the gap between field observation data and risk-based maintenance prioritisation will outperform on every flood protection metric that matters: high-risk finding closure velocity, segment condition stability, capital allocation efficiency, and community resilience. The platform makes it possible. The engineering leadership makes it real.
iFactory's levee condition assessment platform gives reliability engineers the operational infrastructure to build a risk-based maintenance culture — with standardised inspection protocols, GPS-tagged observation tracking, condition rating automation, risk-tiered work order generation, and the trend analytics that connect field data to strategic flood protection outcomes. Book a Demo to see how the platform's condition assessment framework maps to your levee system's inspection and maintenance requirements, or talk to an expert to begin building your risk-based levee maintenance programme with iFactory today.
Frequently Asked Questions
Every Dollar Spent on Levee Maintenance Saves Up to Ten in Flood Recovery. iFactory Shows You Where to Invest First.
iFactory gives every level of your levee maintenance organisation the right condition data, at the right time, in the right format — and gives reliability engineers the assessment infrastructure to build a culture where risk-based maintenance decisions are the standard, not the exception.