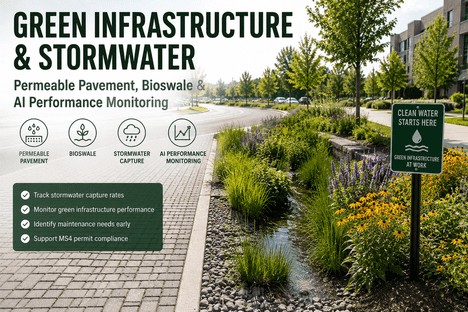
The United States Environmental Protection Agency estimates that 10 trillion gallons of untreated stormwater runoff enter US waterways every year, carrying everything from heavy metals and oils to bacteria and raw sewage. Nearly one-third of the nation's 470,000 assessed water bodies are classified as impaired, with stormwater runoff from urban areas, roadways, and industrial sites as the leading contributor. Municipalities operating under MS4 Phase I and Phase II permits — covering more than 7,500 regulated entities — face escalating compliance requirements, consent decree costs running into billions, and an infrastructure funding gap that the EPA projects at USD 630 billion over the next 20 years. Green infrastructure — permeable pavement, bioswales, rain gardens, and constructed wetlands — has emerged as the most cost-effective path to compliance and resilience. But these nature-based systems introduce a challenge that traditional grey infrastructure does not: performance is highly dependent on ongoing maintenance, and without continuous monitoring, a bioswale that appears functional may be operating at 40% of its designed stormwater capture capacity. For operations directors and municipal stormwater managers, the gap between installing green infrastructure and verifying that it performs as designed is where AI-powered performance monitoring delivers its greatest value.
10 Trillion
Gallons of untreated stormwater runoff enter US waterways annually — carrying pollutants from urban, industrial, and roadway surfaces
USD 630B
EPA-estimated investment needed over 20 years to meet Clean Water Act goals for stormwater and wastewater infrastructure nationwide
7,500+
Municipalities regulated under MS4 Phase I and II permits — each required to implement six minimum control measures for stormwater quality
73.5%
Runoff capture rate demonstrated by well-maintained rain gardens — but performance degrades by 30-50% without regular maintenance monitoring
The Three Pillars of Green Stormwater Infrastructure — Performance Characteristics and Monitoring Requirements
Permeable pavement, bioswales, and rain gardens represent the most widely deployed green infrastructure systems for stormwater management. Each operates on different hydraulic principles, serves different site conditions, and requires distinct monitoring approaches to verify that design performance is being sustained over time. Understanding these differences is the first step toward building an AI-enabled performance monitoring programme that keeps each system type operating within its design parameters.
PP
Permeable Pavement
Porous Asphalt, Concrete & Pavers
Primary Failure Mode
Surface clogging from sediment and organic debris — infiltration rate drops below 0.5 inches per hour without regular vacuum sweeping and pressure washing.
AI Monitoring Inputs
Surface infiltration rate sensors, rain gauge data, drain down time records, sediment accumulation imagery, and maintenance event logging for vacuum sweeping and jet cleaning cycles.
BS
Bioswale
Vegetated Channel with Engineered Soil
97%
Annual Rainfall
Capture Design
90%+
Total Suspended
Solids Removal
Primary Failure Mode
Check dam erosion, vegetation die-off, sediment buildup in the swale bed, and underdrain clogging — reducing detention time below the 24-hour drawdown standard.
AI Monitoring Inputs
Ponding depth sensors, inflow and outflow flow rate monitoring, vegetation health indices from multispectral imagery, sediment accumulation measurements, and drawdown time tracking per storm event.
RG
Rain Garden
Bioretention with Native Planting
86%
Total Rainfall
Managed
3 Yrs
Monitoring Needed
for 5% Uncertainty
Primary Failure Mode
Inlet and outlet clogging, invasive species encroachment, soil media compaction reducing infiltration rate below the 1-inch-per-hour design standard over time.
AI Monitoring Inputs
Ponding level sensors, soil moisture probes at multiple depths, inflow volume metering, vegetation coverage analysis, overflow event frequency tracking, and drawdown time per rainfall event.
Permeable Pavement · Bioswale Performance · Rain Garden Monitoring · MS4 Compliance
A Bioswale That Looks Healthy Can Be Operating at 40% Capacity. iFactory Reveals What Visual Inspection Misses.
iFactory's AI-driven green infrastructure monitoring platform tracks infiltration rates, drawdown times, sediment accumulation, and vegetation health across permeable pavement, bioswales, and rain gardens — with automated alerts when performance drops below MS4 compliance thresholds.
Four Blind Spots in Conventional Green Infrastructure Maintenance — and How Continuous Monitoring Changes the Picture
Most green infrastructure maintenance programmes rely on periodic visual inspections conducted quarterly or bi-annually, combined with reactive maintenance after a visible failure — clogged inlets, ponding water beyond the 24-hour drawdown standard, or vegetation die-off. This approach leaves four critical blind spots that continuous AI monitoring addresses directly. Each blind spot represents a gap between what maintenance crews can observe during a site visit and what is actually happening to system performance between visits.
Infiltration Rate Decay Between Inspections
Permeable pavement infiltration rates decline gradually as sediment and organic matter accumulate in the pore spaces. A quarterly inspection may show acceptable performance at month one, but by month three the infiltration rate may have dropped below the 0.5-inch-per-hour minimum standard, and every storm event in that period generates more runoff than the design intended. Continuous monitoring captures the decay curve in real time — alerting maintenance teams when the infiltration rate crosses the threshold, regardless of where it falls in the inspection cycle.
Underdrain Clogging Without Surface Expression
Bioswale and rain garden underdrains can become partially clogged with sediment and biofilm over time, reducing the system's ability to convey treated water to the outlet. This failure mode often has no surface expression — the vegetation looks healthy, there is no visible ponding, and a visual inspection finds nothing wrong. But the underdrain flow rate may have dropped by 50%, meaning the system is bypassing a significant portion of the design storm volume without treatment. Flow monitoring at the underdrain outlet, combined with water balance analysis, detects this condition immediately.
Drawdown Time Exceedance Only Detected After the Fact
The MS4 performance standard for bioretention systems typically requires that ponded water draw down within 24 to 48 hours after a storm event. A visual inspection conducted three weeks after a storm cannot determine whether the system met that standard during the actual event. Continuous water level monitoring captures the drawdown curve for every storm event — showing exactly how long the system took to drain, whether that time is within the compliance threshold, and whether drawdown times are trending longer over successive storms as an early indicator of media clogging or outlet obstruction.
Cumulative Sediment Loading Without Excision Records
Green infrastructure systems accumulate sediment over time from the contributing drainage area. Without quantitative sediment measurement, maintenance teams rely on visual estimates that consistently underestimate the volume in place. When sediment accumulation reaches 25% of the design storage volume, system performance begins to degrade. Continuous monitoring of sediment depth at inflow points, combined with sediment removal event logging, provides the data needed to plan excavation cycles on a schedule determined by actual accumulation rates rather than calendar intervals — avoiding both premature maintenance and performance-damaging delays.
Traditional Maintenance vs. AI-Powered Monitoring — How the Approaches Compare Across the Asset Lifecycle
The difference between calendar-based visual inspection and AI-driven continuous monitoring is not incremental — it is a fundamental change in how performance data is collected, analysed, and acted upon. The comparison below maps each approach against the dimensions that determine whether green infrastructure assets sustain their design performance over the full service life.
Green Infrastructure Monitoring — Why Continuous AI Assessment Outperforms Periodic Visual Inspection
Monitoring Dimension
Traditional Approach
AI-Powered Approach
Data Collection Frequency
Quarterly or bi-annual visual inspections with photographic documentation and paper checklists
Continuous real-time data from in-situ sensors — infiltration rate, ponding depth, flow rate, soil moisture, and sediment accumulation at 5-minute intervals
Failure Detection Timing
Detected at next inspection cycle or when visible failure occurs — ponding water, overflow, or vegetation death
Alert triggered within hours of threshold breach — trend analysis identifies developing failures weeks before visible symptoms appear
MS4 Compliance Evidence
Paper inspection logs, dated photographs, and manual record keeping compiled annually for permit reporting
Automated compliance dashboards with continuous performance data, trend analytics, and export-ready reports mapped to each MS4 minimum control measure
Maintenance Cost Efficiency
Calendar-based maintenance schedules — vacuum sweeping, sediment removal, and vegetation management on fixed intervals regardless of actual need
Condition-based maintenance triggers — maintenance is scheduled when sensor data indicates actual need, reducing unnecessary interventions by 30-40%
System Performance Verification
Assumed based on design specifications and occasional spot-check measurements during inspections
Quantified performance verification per storm event — capture volume, drawdown time, infiltration rate, and pollutant removal estimated from continuous flow and water quality data
Continuous Monitoring · MS4 Compliance · Condition-Based Maintenance · Performance Verification
Quarterly Visual Inspections Cannot Catch What Happens Between Storms. iFactory Gives You Per-Storm Performance Data for Every Asset.
iFactory's green infrastructure monitoring platform delivers real-time infiltration, drawdown, and sediment data for every permeable pavement, bioswale, and rain garden in your portfolio — with automated MS4 compliance reporting and condition-based maintenance triggers.
The MS4 Compliance Intelligence Framework — Mapping Data to Permit Requirements
Every MS4 permit requires implementation of six minimum control measures, but the monitoring burden falls disproportionately on two: construction site runoff control and post-construction stormwater management — the latter being where green infrastructure performance data is most critical. iFactory's platform maps every data stream directly to the control measure it supports, making compliance reporting a by-product of operational monitoring rather than a separate documentation exercise.
MCM 1
Public Education & Outreach
iFactory tracks public education programme reach, material distribution metrics, and community engagement events tied to green infrastructure awareness.
MCM 2
Public Involvement & Participation
Dashboard tracks volunteer storm drain marking events, rain garden planting workshops, and public reporting of green infrastructure maintenance needs.
MCM 3
Illicit Discharge Detection & Elimination
Continuous water quality monitoring at outfalls and green infrastructure outlets flags anomalous conductivity, pH, and temperature readings indicating illicit discharges between inspections.
MCM 4
Construction Site Runoff Control
Sensor-based monitoring of sediment basin performance, silt fence integrity alerts, and real-time turbidity tracking at construction site discharge points during active storm events.
MCM 5
Post-Construction Stormwater Management
Per-storm performance verification for every green infrastructure asset — capture volume, drawdown compliance, infiltration rate trend, and maintenance status with automated annual compliance reporting.
MCM 6
Pollution Prevention & Good Housekeeping
Municipal operations activity tracking — street sweeping schedules linked to permeable pavement infiltration trends, catch basin cleaning records, and green infrastructure maintenance logs in a single platform.
"
We installed 14 bioswales and 6 permeable pavement lots as part of our MS4 Phase II compliance programme. The first year of quarterly inspections told us everything looked fine. But during a routine underdrain inspection on one bioswale, we found the outlet pipe was 60% blocked with sediment that had no surface expression at all. That discovery made us realise we had no way to know how many of our other systems were underperforming. We deployed iFactory's continuous monitoring across the full portfolio. Within the first three months, we identified four bioswales with drawdown times exceeding the 48-hour standard, two permeable pavement sections with infiltration rates below 0.3 inches per hour, and one rain garden where the overflow structure had been partially blocked since construction. The first year alone, the maintenance cost savings from switching from calendar-based to condition-based cleaning schedules covered the entire monitoring system investment.
— Stormwater Operations Director, Municipal Public Works Department — 15 Years Stormwater and MS4 Compliance Management
Conclusion
Green infrastructure represents the most cost-effective and environmentally beneficial path to stormwater compliance and urban resilience — with the global green stormwater infrastructure market projected to reach USD 23.68 billion by 2030. But the fundamental challenge of nature-based systems is that their performance is not self-sustaining. Permeable pavement infiltration rates decline without vacuum sweeping. Bioswale underdrains clog without surface expression. Rain garden drawdown times extend beyond compliance thresholds without visible symptoms. The gap between installed green infrastructure and verified performance is a monitoring gap — and it is the single largest source of MS4 compliance risk for municipalities with green infrastructure portfolios.
iFactory's AI-driven green infrastructure monitoring platform closes that gap by providing continuous per-storm performance data, condition-based maintenance alerts, and automated MS4 compliance reporting across permeable pavement, bioswale, rain garden, and constructed wetland assets. Book a Demo to see how iFactory maps real-time infiltration, drawdown, and sediment data to your MS4 permit requirements, or talk to an expert to discuss how continuous AI monitoring fits into your existing green infrastructure maintenance programme and capital planning cycle.
Frequently Asked Questions
10 Trillion Gallons of Untreated Runoff Enter US Waterways Every Year. Green Infrastructure Is the Solution. AI Monitoring Makes It Verifiable.
iFactory's AI-powered green infrastructure monitoring platform gives operations directors and stormwater managers the continuous performance data, condition-based maintenance alerts, and automated MS4 compliance reporting needed to ensure every permeable pavement, bioswale, and rain garden performs as designed — storm after storm, year after year.