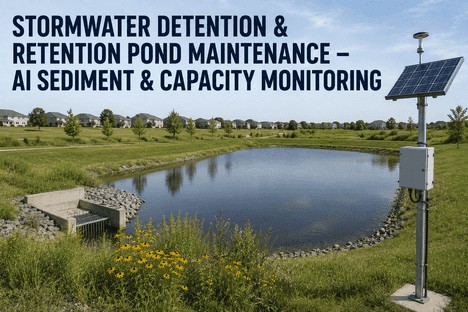
Stormwater detention and retention ponds are the most widely deployed best management practice across municipal and private stormwater systems — yet they are also the most commonly neglected. Sediment accumulates silently beneath the waterline, reducing storage capacity year after year until a design-storm event overwhelms the compromised volume and flooding occurs. Maintenance managers responsible for pond assets face a persistent challenge: without continuous visibility into underwater sediment depth and distribution, maintenance decisions are driven by elapsed time rather than actual condition. The result is a cycle of reactive dredging, emergency repairs, and compliance findings that could have been prevented with systematic capacity monitoring. Building a data-driven pond maintenance programme is not about purchasing survey equipment — it is about establishing the measurement cadence, threshold-based triggers, and decision workflows that transform sediment data from an occasional study into a continuous operational input.
What You Cannot See Beneath the Waterline Will Cost You. iFactory Makes Sediment Visible and Actionable.
iFactory's pond asset management platform gives maintenance managers continuous visibility into sediment accumulation trends, storage capacity status, and dredge trigger thresholds — with AI-driven bathymetric data integration, inspection workflow automation, and the analytics that turn underwater condition data into scheduled maintenance interventions rather than emergency dredging events.
Average annual sediment accumulation rate in unmanaged stormwater ponds — silently displacing storage capacity and reducing flood detention performance year after year
25%
Industry-standard dredging trigger threshold — when sediment accumulation reduces original storage volume by one quarter, proactive intervention restores capacity at predictable cost
Up to 100%
Of wet pool water quality treatment volume can be lost to sediment accumulation before visual indicators appear above the waterline — making bathymetric data essential for program compliance
$20-60
Cost per cubic yard of sediment removal — proactive dredging at 25% capacity loss costs 40-60% less than emergency restoration after a compliance-driven or flood-event intervention
Why Most Stormwater Pond Maintenance Programmes Fail — and What the Data Shows
The pattern is consistent across municipalities, HOAs, and facility operators that manage stormwater ponds: sediment accumulates below the waterline where visual inspection cannot detect it, dredging is deferred until storage loss triggers a compliance finding or a near-flood event, and the cost of intervention multiplies with every year of delay. Research from the International BMP Database and multiple watershed studies confirms that the most common maintenance need across pond, trench, and tank BMPs is managing sediment, debris, and trash accumulation — yet maintenance recordkeeping is not standardised across jurisdictions, and data collection methods rarely align with permit requirements. Three root causes explain why ponds fail to perform their designed function long before regulatory action forces a response.
01
Sediment Accumulation Is Invisible Until It Becomes Critical.
Unlike a cracked pipe or a malfunctioning pump, sediment accumulates gradually and uniformly beneath the pond's water surface. Visual inspections from the bank reveal nothing about the depth of sediment on the pond floor. Studies show that wet pool treatment volume can be reduced by up to 100% of design capacity before above-water signs — turbid discharge, frequent overflow, emergent vegetation across the pond bottom — become apparent. By the time sediment accumulation is visible to the naked eye, the pond has already lost the majority of its flood detention and water quality treatment function. Maintenance managers relying on visual inspection alone are managing ponds blind.
02
Maintenance Cycles Are Calendar-Driven, Not Condition-Driven.
Most pond maintenance programmes schedule dredging on fixed intervals — every five years, every ten years — regardless of the pond's actual sediment load. Yet sediment accumulation rates vary dramatically based on catchment impervious surface coverage. Research demonstrates a strong direct correlation between impervious surface percentage and sediment accumulation rate, meaning two ponds of identical design built in the same year can have vastly different remaining storage capacities based on what happens in their contributing watersheds. A pond serving a stable residential catchment may need dredging every fifteen years, while a pond downstream of an active construction area may lose 50% of its capacity in five. Calendar-based maintenance ignores this variability — over-maintaining some ponds and under-maintaining others until failure occurs.
03
Dredging Data Exists in Reports Rather Than Decision Systems.
When sediment surveys are conducted — typically by external consultants using sonar-equipped vessels or grade-rod measurement grids — the results arrive as a PDF report with a bathymetric map and a volume calculation. That report is filed, the data is extracted once for a maintenance decision or a regulatory submission, and then it sits untouched until the next survey cycle. The survey data never enters an operational system that tracks capacity trend over time, alerts when a pond approaches the 25% loss threshold, or integrates sediment accumulation rate with inspection findings from inlet and outlet structures. Without a digital layer that converts periodic survey data into continuous asset intelligence, every pond survey is a standalone event rather than part of a longitudinal record that drives progressively more accurate maintenance predictions.
A Bathymetric Report on a Shelf Is Not a Maintenance Programme. iFactory Turns Sediment Data Into a Decision Engine.
iFactory ingests bathymetric survey data, inspection records, and sediment probe measurements into a unified asset dashboard — tracking remaining capacity, calculating accumulation rates, and alerting maintenance managers when a pond crosses the intervention threshold.
The Sediment Accumulation Reality — What Happens Beneath the Surface
Understanding the rate at which sediment accumulates in stormwater ponds is the foundation of any condition-based maintenance strategy. The table below summarises accumulation rates, intervention thresholds, and cost implications based on peer-reviewed research and industry-standard practice. Maintenance managers who track these variables across their pond inventory move from reactive dredging to predictive asset management — and from unpredictable capital expense to budgeted maintenance programmes.
0.06-0.50 cm/yr in stable residential catchments. 1-3 in/yr in unmanaged ponds. Up to 2.96 cm/yr in ponds with high impervious cover or active construction upstream.
Strong correlation between catchment impervious surface and sediment accumulation. Ponds in developing watersheds lose capacity 5-10x faster than those in stable catchments.
Conduct baseline bathymetric survey at pond acceptance. Establish site-specific accumulation rate after two survey cycles. Adjust maintenance interval based on measured rather than assumed rate.
Dredging Trigger Threshold
Industry standard: dredge when sediment occupies 25-50% of original design volume. Some jurisdictions require action at 25% for MS4 permit compliance tracking.
At 25% loss: flood detention capacity reduced, water quality treatment begins degrading. At 50% loss: permanent pool depth under 3 ft, sediment scouring carries pollutants to receiving waters.
Set 25% capacity loss as the primary maintenance trigger in asset management system. Schedule pre-dredge engineering assessment at 20% to allow 12-18 month planning and budget window.
Dredging Cost
$20-60 per cubic yard of sediment removed. $5,000-$75,000+ per pond depending on size, access, disposal method. Forebay cleaning: $50-130 per cubic metre.
Emergency dredging triggered by compliance finding or near-flood event costs 40-60% more than planned intervention due to expedited mobilisation, permitting, and disposal constraints.
Build dredging reserve based on measured accumulation rate and pond-specific volume. Budget 25% above current estimate to account for disposal cost variability and regulatory requirements.
Survey Frequency
Industry standard: bathymetric survey every 5 years. Ponds in high-sediment-load catchments: every 2-3 years. Ponds approaching 25% threshold: annual until dredging is completed.
Annual survey data enables trend-based prediction of when each pond will reach intervention threshold. Without trend data, every maintenance decision is based on a single point measurement with no rate context.
Integrate survey results into digital asset management layer immediately. Track sediment depth at permanent monitoring points between full surveys using low-cost probe measurements during routine inspections.
The Maintenance Manager's Playbook — Six Actions That Build a Data-Driven Pond Asset Programme
A condition-based pond maintenance programme does not require a fleet of survey vessels or a dedicated hydrologist. It requires systematic data collection at defined intervals, threshold-based triggers connected to maintenance workflows, and a digital layer that converts individual pond measurements into an actionable asset portfolio view. These six actions are what separate maintenance managers who predict and prevent pond failure from those who respond to it.
Action 01
Establish a Baseline Bathymetric Survey for Every Pond in Your Inventory
Foundation Step
You cannot manage what you have not measured. For every detention and retention pond in your asset inventory, obtain a baseline bathymetric survey that establishes current bottom elevations, remaining storage capacity at each stage of the pond, and total sediment volume accumulated since construction. This survey becomes the reference point against which all future measurements are compared. Ponds constructed before digital records were standard — the majority of ponds built in the 1990s and 2000s — often have design drawings that no longer reflect field conditions. A baseline survey corrects the record and establishes the true starting point for capacity trend tracking. Without this baseline, every future sediment measurement exists in isolation, and the maintenance manager cannot calculate the accumulation rate that drives condition-based dredge scheduling.
Action 02
Define Pond-Specific Dredge Thresholds Based on Design Capacity, Not Generic Intervals
Trigger Configuration
The industry-standard trigger of 25% storage capacity loss is a useful starting point, but it should be refined based on each pond's specific design parameters and regulatory requirements. A wet retention pond designed primarily for water quality treatment reaches functional impairment when the permanent pool depth drops below 3 feet — at that point, sediment scouring resuspends captured pollutants during moderate storm events and carries them directly to the outlet structure. A dry detention pond designed for flood attenuation loses its design-storm performance curve as sediment reduces the available volume above the lowest outlet elevation. Configure threshold alerts in your asset management system that reflect each pond's primary function — water quality treatment, flood detention, or combined — and set trigger levels that, when breached, automatically generate a maintenance planning workflow with assigned责任人, budget estimate template, and permit timeline.
Action 03
Integrate Routine Inspection Data With Bathymetric Survey Records
Data Integration
Full bathymetric surveys every five years provide the authoritative capacity measurement, but they leave multi-year gaps during which sediment continues accumulating and conditions at the pond may change. Bridge these gaps by integrating routine visual inspection data — inlet and outlet condition, sediment depth at accessible forebay locations, emergent vegetation coverage, and water quality observations — into the same digital asset record that holds your survey data. Low-cost sediment probe measurements at established monitoring points during quarterly inspections, when recorded consistently, build an intermediate data layer that validates or challenges the accumulation rate projected from full surveys. A maintenance manager who can see that a pond's sediment depth at the forebay monitoring point increased 40% between the year-three and year-four quarterly inspections has actionable information twelve months before the next full survey would confirm the trend.
Action 04
Build a Tiered Pond Asset View — Different Data for Field Inspectors, Maintenance Planners, and Programme Managers
Asset Architecture
A single pond management dashboard shared across field inspectors, maintenance planners, and programme managers serves no level effectively. Field inspectors need current inspection assignments, digital checklists tailored to pond type, and historical findings for the specific pond they are visiting today. Maintenance planners need a portfolio-level view showing each pond's remaining capacity percentage, estimated year-to-dredge-threshold based on measured accumulation rate, and predicted dredge volume and cost. Programme managers and directors need trend analytics — average sediment accumulation rate across the portfolio, aggregate remaining capacity trend, proactive vs. reactive dredging ratio, and total dredging expenditure forecast for the next ten years. iFactory's pond asset management platform supports tiered configuration, so each role accesses the data layer that drives their decisions — without being overwhelmed by data relevant only to other levels. This structural choice is what makes pond asset programmes sustainable across staff turnover and budget cycles.
Action 05
Build a Dredging Reserve Forecast Based on Measured Accumulation Rates
Financial Planning
The primary barrier to proactive pond maintenance is not technical — it is financial. Dredging budgets compete with every other infrastructure priority, and without data that predicts when each pond will need intervention and what it will cost, maintenance managers cannot build credible reserve forecasts that survive budget review. After two survey cycles establish a pond-specific accumulation rate, the maintenance manager can calculate the expected year in which each pond will reach 25% capacity loss, the volume of sediment to be removed, and the estimated cost at current market rates adjusted for projected inflation. This forecast, maintained in a digital asset management system and updated after each survey, transforms dredging from an unbudgeted emergency expense into a predictable capital programme. Boards, councils, and finance directors approve reserve funding when they can see the data. They deny emergency requests when they cannot.
Action 06
Review and Refine Pond-Specific Accumulation Rates After Each Survey Cycle
Continuous Improvement
A pond's sediment accumulation rate is not a fixed number — it changes as land use in the contributing watershed changes. A pond that accumulated sediment at 0.2 inches per year for its first decade may see that rate triple if upstream construction activity begins, or drop by half if agricultural land is converted to low-density residential use. The maintenance programme that treats accumulation rates as static assumptions will gradually lose the accuracy of its dredge forecasts. After each bathymetric survey, recalculate the pond's accumulation rate by dividing the measured sediment volume increase by the time elapsed since the previous survey. Compare the new rate to the historical rate maintained in the asset record. If the rate has changed by more than 20%, adjust the dredge threshold projection and the financial forecast accordingly. This annual calibration cycle is what distinguishes a living asset management programme from a static maintenance schedule that gradually diverges from field reality.
The Pond Asset KPI Framework — What to Track at Each Level
The following KPI taxonomy connects each metric to a named decision-maker and a defined management action. iFactory's platform tracks all of these in real time, with configurable threshold alerts and trend visualisations configured per user role.
Field Inspector Level
Pond inspection assignments for current period — with digital checklist tailored to pond type and function
Inlet/outlet condition with sediment depth at forebay monitoring point — recorded against historical baseline for trend identification
Corrective action flags — structural damage, erosion, blockage, or vegetation issues requiring maintenance work order
Maintenance Planner Level
Remaining storage capacity by pond — percentage of original design volume available, updated after each survey cycle
Estimated year to dredge threshold — based on measured accumulation rate trajectory, updated after each new survey data point
Predicted dredge volume and cost — cubic yards and estimated cost at current rates, supporting 5- and 10-year budget forecasts
Programme Manager Level
Average sediment accumulation rate across portfolio — tracked by catchment land use type for predictive planning
Proactive vs. reactive dredging ratio — percentage of dredging events triggered by threshold alert vs. emergency or compliance finding
Aggregate remaining capacity trend — is the total available storage across the pond portfolio improving, stable, or declining?
Director / Board Level
10-year dredging expenditure forecast — predicted annual dredging cost across portfolio based on measured accumulation rates and current contract pricing
Compliance finding trend — number of pond-related MS4 or NPDES findings per audit cycle, target of zero repeat findings on sediment-related issues
Reserve fund adequacy ratio — current dredging reserve balance vs. predicted 5-year expenditure requirement, updated after each annual budget cycle
"
I inherited a pond inventory of forty-seven stormwater assets with a maintenance programme that scheduled dredging by guessing which pond "looked worst" during the annual dam safety inspection. We had bathymetric surveys on file for maybe twelve of them, and those were spread across six different consultant reports in PDF format that nobody had opened since they were filed. The first thing I did was commission baseline surveys for every pond and load the data into a central asset system — not a spreadsheet, an actual system with trend tracking and threshold alerts. Three things happened. First, we discovered that seven of our forty-seven ponds were already past the 25% capacity loss threshold and needed dredging within eighteen months. Two of those were ponds the previous programme assumed were fine because the water looked clear from the bank. Second, we established that our portfolio-wide average accumulation rate was 0.8 inches per year, which meant we could build a ten-year dredging reserve forecast that actually survived budget committee review. Third, within two permit cycles, our pond-related MS4 compliance findings dropped to zero — not because the ponds were in better condition than before, but because we could prove we knew the condition of every pond in the inventory and had a maintenance plan tied to measured data. The ponds did not change. Our management of them did.
— Maintenance Programme Manager, Municipal Stormwater Utility — 22 Years Public Works and Asset Management
Conclusion
The difference between a pond asset programme that cycles between emergency dredging events and one that delivers predictable, budgeted capacity restoration is not the number of bathymetric surveys commissioned. It is the digital infrastructure that connects survey data to maintenance decisions, threshold triggers to work order generation, and accumulation rate trends to financial forecasts. With sediment silently displacing storage capacity across the millions of stormwater ponds in operation today — and with MS4 permit requirements continuing to demand documented proof of BMP function — the maintenance managers who build condition-based pond programmes will outperform on every metric that matters: compliance finding rates, dredging cost per cubic yard, emergency-to-planned intervention ratio, and reserve fund adequacy. The survey data makes it possible. The management system makes it real.
iFactory's pond asset management platform gives maintenance managers the digital infrastructure to run a data-driven pond programme — with bathymetric survey data integration, sediment accumulation trend tracking, condition-based dredge threshold alerts, tiered KPI visibility across field, planner, and management levels, and the financial forecasting tools that turn pond maintenance from an unbudgeted liability into a predictable capital programme. Book a Demo to see how the platform maps to your pond asset inventory, or talk to an expert to begin building your data-driven pond maintenance programme with iFactory today.
Frequently Asked Questions
iFactory accepts bathymetric survey data — whether collected via sonar-equipped unmanned survey vessels, conventional grade-rod measurement grids, or drone-based photogrammetry — and converts it into a structured asset record showing current bottom elevations, remaining storage capacity by pond stage, and total sediment volume. Each survey upload is time-stamped and appended to the pond's longitudinal record, enabling the platform to calculate sediment accumulation rates, project the year each pond will reach defined dredge thresholds, and update financial forecasts automatically. Survey data is presented in the asset dashboard alongside routine inspection findings, giving maintenance managers a single source of truth for every pond in the inventory. Talk to an expert to discuss how your existing bathymetric survey data can be migrated into iFactory's pond asset management platform.
The most effective starting point is the portfolio inventory and baseline assessment — establishing a complete register of every detention and retention pond in your inventory with key attributes: design storage volume, primary function (water quality, flood detention, or combined), year of construction or last known dredge, and most recent sediment survey data if available. For ponds without recent survey data, commission baseline bathymetric surveys as part of the first year's programme. Once baseline data is loaded into iFactory, configure pond-specific dredge threshold alerts at 25% capacity loss and establish the inspection cadence — quarterly visual inspections with forebay sediment probe measurements at established monitoring points. Run the first portfolio-level review session within the first month of data collection, reviewing each pond's current capacity status, estimated year to threshold, and the data confidence level. Early portfolio visibility at the programme manager level establishes the expectation that every pond maintenance decision will be supported by measured data rather than elapsed time. Book a Demo to walk through the pond portfolio setup process with our stormwater asset management team.
iFactory allows maintenance managers to configure pond-specific dredge thresholds based on each pond's design parameters and primary function. For wet retention ponds focused on water quality treatment, the threshold can be set at 25% permanent pool volume loss or when permanent pool depth drops below 3 feet — whichever occurs first. For dry detention ponds focused on flood attenuation, the threshold can be configured as a percentage of total flood storage volume lost or based on the pond's performance curve deviation from design specifications. For combined-function ponds, multiple thresholds can be set with different alert priorities assigned to each. When survey data indicates a pond has crossed a configured threshold, the platform automatically generates a maintenance planning workflow with the estimated sediment volume to be removed, a budget estimate based on configured cost-per-cubic-yard rates, and a timeline template that accounts for permit lead times and seasonal dredging windows. Book a Demo to see how threshold configurations are tailored to your pond asset types and regulatory requirements.
iFactory calculates a pond-specific accumulation rate after each bathymetric survey by dividing measured sediment volume increase by time elapsed since the previous survey. This rate, combined with the pond's remaining capacity and configured dredge threshold, generates a projected year-to-threshold for each pond in the portfolio. The platform aggregates these projections into a portfolio-wide 10-year dredging expenditure forecast — showing expected dredging year, estimated volume, and estimated cost for each pond, with totals by fiscal year. Maintenance managers can adjust cost-per-cubic-yard assumptions and inflation rates to produce scenarios for budget review. The forecast updates automatically after each new survey data point, so the financial projection becomes progressively more accurate as the measurement record lengthens. This capability transforms pond maintenance from an unpredictable expense line into a data-supported capital programme that boards, councils, and finance committees can evaluate and approve with confidence. Talk to an expert to configure the financial forecasting module for your pond asset portfolio.
Sediment Accumulation Is Inevitable. Emergency Dredging Is Not. iFactory Turns Pond Data Into Predictable Maintenance.
iFactory gives every level of your pond asset programme the right data, at the right time, in the right format — and gives maintenance managers the digital infrastructure to build a programme where condition-based dredging is the norm and emergency restoration is the exception.