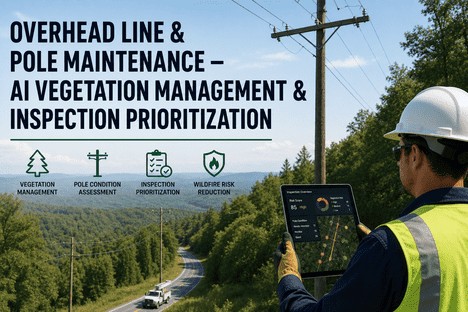
Overhead Line & Pole Maintenance — AI Vegetation Management & Inspection Prioritization
By Grace on June 22, 2026
There are an estimated 120 to 140 million wood utility poles carrying overhead distribution and transmission lines across the United States — and the average pole is now over 40 years old. Vegetation contact with power lines is the single largest cause of weather-related outages, responsible for 16 to 48 percent of all storm-related service interruptions. With wildfire liability costs running into the billions annually and regulatory scrutiny intensifying across California, Oregon, Colorado, and Texas, the margin for error in overhead line maintenance has effectively disappeared. The US Forest Service reported a 70 percent increase in vegetation management requests on federal lands in 2024 alone. Yet most utilities still manage pole inspection cycles and vegetation clearance programmes through separate contractor workflows, paper-based field reports, and spreadsheets that are reconciled weeks after the data was collected — by which time a vegetation encroachment that was identified in the field has already grown three inches closer to the conductor.
Overhead Line Maintenance · Pole Condition AI · Vegetation Management · Wildfire Prevention · Inspection Prioritisation
Your Poles Are Aging, Vegetation Is Growing, and Wildfire Season Is Getting Longer. A Spreadsheet Cannot Keep Up.
iFactory's overhead line and pole maintenance module combines AI-driven vegetation encroachment detection, pole condition assessment from drone and ground inspection data, and automated work order prioritisation to give reliability engineers a single platform for managing thousands of miles of distribution lines and tens of thousands of poles.
Wood utility poles in service across the US — average age exceeding 40 years, with millions approaching end-of-life without a systematic condition assessment programme in place
70%
Increase in vegetation management requests on federal lands from 2023 to 2024 — regulatory pressure for vegetation clearance is intensifying faster than utility inspection capacity
48%
Reduction in storm-related outages achieved through enhanced vegetation management programmes — but only when clearance data is acted on before the next weather event
30%
Of wood poles replaced unnecessarily due to inaccurate condition assessment — the cost of false rejections in a single utility territory can exceed several million dollars annually
The Real Problem With Overhead Line and Pole Management Is Not the Work — It Is the Disconnection Between Inspection Data and Maintenance Action
Vegetation management crews and pole inspection teams collect enormous amounts of field data every day — GPS-tagged photos, clearance measurements, condition assessments, decay readings. The problem is that this data typically lands in separate contractor portals, spreadsheet summaries, or PDF reports that are reviewed days or weeks after the field visit. By the time a vegetation encroachment or pole defect reaches the maintenance scheduling team, the condition may have already escalated from a scheduled repair to an emergency response — or worse, to an outage event that should have been prevented.
Four Failure Modes of Disconnected Overhead Line Management — and the Data That Should Prevent Each One
The Vegetation Blind Spot
A tree growing toward the conductor is identified during a patrol. By the time the trimming crew is scheduled, the clearance is critical and the outage risk is real.
Vegetation grows faster than most 12-month trimming cycles account for. A fast-growing species adjacent to a distribution line can reduce clearance by 12 to 18 inches in a single growing season. When the interval between field identification and maintenance execution stretches beyond 90 days — as it routinely does for utilities managing multiple contractor workflows through separate systems — a manageable trimming job becomes an urgent hazard. The cycle is broken not by poor field work but by the time lag between detection and action, a lag that exists because vegetation inspection data and work order management live in different systems with no automated handoff.
Detection-to-Action Time Lag
The Pole Assessment Gap
Visual inspection misses internal decay. Sounding misses shallow decay. Without multi-method assessment, poles fail without warning.
A utility pole that looks sound from the surface can have 60 percent or more of its cross-sectional area consumed by internal decay below the groundline — invisible to visual patrol and undetectable by hammer sounding alone. Industry studies show that visual-only inspection programmes fail to identify up to 40 percent of reject-grade poles. The cost of this gap is not limited to pole failures. It includes emergency replacements at premium pricing, outages during extreme weather when compromised poles fail under load, and liability exposure when a failed pole causes injury or property damage. The solution is systematic multi-method assessment with data that feeds directly into a strength calculation and remaining-life model for every pole.
Hidden Internal Decay Risk
The Inspection Inefficiency Trap
A crew inspects 30 poles per day. Each pole gets 10 minutes. The data is written on paper and entered into a system three days later.
The traditional pole inspection workflow — field data collection on paper or tablet, batch upload at end of shift, manual entry into asset management system, quality check, and then work order generation — introduces a latency of 48 to 96 hours between field assessment and actionable data. For a utility managing 50,000 poles on a 10-year inspection cycle, this latency compounds across thousands of inspections annually, creating a backlog of undocumented field findings that may never reach the maintenance scheduling team. The result is that poles identified as critical during inspection are not prioritised differently from those with minor findings, because the triage happens after the data has been processed rather than when the inspector is standing at the pole.
Data Latency + Workflow Fragmentation
The Wildfire Regulatory Exposure
Regulators demand proof of systematic vegetation and pole inspection. Without documented audit trails, a single ignition event becomes a multibillion-dollar liability question.
In California and other high-fire-threat states, utilities are now required to document every vegetation inspection, every clearance measurement, every pole condition assessment, and every corrective action in audit-ready form. When a wildfire ignition is traced to a utility asset, the first question from regulators and litigators is not whether the vegetation was managed or the pole was inspected — it is whether the utility can produce documented proof of systematic inspection and timely corrective action. A utility operating with paper field reports and disconnected data systems cannot answer that question with the speed and certainty that post-event scrutiny demands — and the financial consequences of an inadequate answer now routinely exceed $1 billion per event.
Audit Trail Deficiency + Billable Liability
Vegetation Encroachment AI · Pole Condition Analytics · Inspection Prioritisation · Wildfire Compliance
An Overhead Line Programme Is Only as Good as the Gap Between Field Inspection and Work Order Execution. iFactory Closes That Gap to Zero.
A single platform where vegetation encroachment data, pole condition assessments, drone imagery, and maintenance work orders exist in the same workflow — with AI-driven prioritisation that ensures the highest-risk findings are actioned first, regardless of which crew or contractor collected the data.
What iFactory's Overhead Line and Pole Module Actually Does
iFactory is not an inspection data repository with a separate work order system bolted on. It is a unified overhead line management platform where vegetation encroachment data, pole condition assessments, drone imagery, LiDAR surveys, and maintenance work orders live in the same data environment — with AI that processes field data in real time, prioritises findings by risk severity, and generates work orders automatically so the gap between detection and action is measured in hours, not weeks.
01
Capability 01
AI Vegetation Encroachment Detection — From Drone Imagery to Clearance Violation Alerts in Minutes
Predictive Vegetation Risk
iFactory ingests drone, satellite, and LiDAR imagery of overhead line corridors and applies AI computer vision models trained to detect vegetation encroachment — identifying not just current clearance violations but predicting future encroachment based on species-specific growth rates and historical trimming cycles. When the AI identifies a clearance that will fall below minimum regulatory threshold within the next 90 days, it generates a predicted encroachment alert before the violation exists. The system automatically creates a vegetation management work order with the exact GPS location, clearance measurement, growth projection date, and priority level — eliminating the manual process of reviewing patrol images, measuring clearances, and entering findings into a separate work order system.
AI-based clearance violation detection
Growth-prediction encroachment alerts
Auto-generated vegetation work orders
02
Capability 02
Multi-Method Pole Condition Assessment — Visual, Sounding, Boring, and Excavation Data in a Single Asset Record
Comprehensive Pole Health
iFactory captures pole condition data from every inspection method — visual assessment, hammer sounding, boring, and excavation — and consolidates it into a single asset record with a calculated remaining strength percentage and health score. Field inspectors use iFactory's mobile interface to record findings at the pole site with GPS-tagged photos, audio notes, and measurement data that feeds directly into the system's strength calculation engine. When a pole's remaining strength falls below the utility's code-required threshold, the system automatically generates a reinforcement or replacement work order with the specific decay location, remaining shell thickness, and engineering assessment attached. This eliminates the need for a separate engineering review step to convert inspection findings into actionable work — the transition from field assessment to maintenance execution happens within minutes of the inspector completing the pole evaluation.
Multi-method inspection consolidation
Remaining strength calculation engine
Auto-generated replacement work orders
03
Capability 03
Risk-Based Inspection Prioritisation — Direct Field Resources to the Poles and Corridors That Need Attention Most
Intelligent Resource Allocation
iFactory's risk-based prioritisation engine combines pole condition data, vegetation encroachment risk scores, wildfire threat zone classification, load criticality, and historical outage data to produce a ranked inspection and maintenance priority list for every line segment and every pole in the network. A pole located in a high-fire-threat district with a borderline strength assessment and a history of nearby vegetation violations receives a higher priority score than an identical pole in a low-risk urban area with clean clearance history — regardless of which was inspected first chronologically. This risk-based approach ensures that limited inspection and maintenance resources are deployed to the assets where failure would cause the greatest consequence, rather than the assets that happen to be due for their cycle inspection next on the calendar.
Multi-variable risk scoring
Wildfire threat zone integration
Condition-based cycle optimisation
04
Capability 04
Compliance Documentation and Audit Trail — Every Inspection, Every Finding, Every Action Recorded for Regulatory Defence
Regulatory Readiness
iFactory maintains a permanent, immutable audit trail for every vegetation inspection, pole condition assessment, clearance measurement, and corrective action across the entire overhead line network. Each record includes the field data, GPS location, timestamp, inspector identification, photographic evidence, and the specific regulatory standard it was measured against. When a regulator requests proof of inspection for a specific line segment on a specific date, the system produces the complete documentation in its native format within seconds — not after a multi-day manual search through contractor reports, paper files, and spreadsheet archives. For utilities operating in wildfire-prone jurisdictions where audit readiness is a regulatory requirement rather than a best practice, this documentation capability is the difference between demonstrating compliance and defending non-compliance in litigation.
Immutable audit trail per asset
Regulatory-standard compliance mapping
Instant regulatory report generation
Pole Inspection Methods Compared — Why Multi-Method Assessment Produces Better Data Than Any Single Approach
The accuracy of a utility pole condition assessment depends directly on the inspection method employed. Each method reveals different types of defects and carries different confidence levels. The most effective pole management programmes use multiple methods in sequence — with data from each stage feeding into a consolidated condition assessment that drives maintenance decisions. iFactory captures data from every method and consolidates it into a single asset record.
Pole Inspection Methods — What Each Technique Reveals and Where Each Falls Short
Detects zero internal decay; up to 40 percent of reject-grade poles appear acceptable under visual-only inspection
Captures inspection photos with GPS tagging; automated flagging of visible external defects for follow-up testing
Hammer Sounding
Internal voids near the struck location; hollow-sounding areas indicate decay pockets below the surface
Subjective — results vary by inspector experience; does not measure remaining shell thickness or decay extent
Inspector records sound test results per zone; system flags poles with hollow-sound findings for mandatory boring confirmation
Boring
Internal decay depth and location; remaining sound wood thickness at specific test points near groundline
Point measurement only — decay between test holes may be missed; requires interpretation to assess overall pole condition
Bore measurement data feeds directly into remaining strength calculation; system correlates multiple bore points for cross-sectional analysis
Excavation
Full groundline condition below 18-inch depth; complete circumferential assessment of below-grade decay
Most thorough method but most expensive and time-consuming; typically reserved for poles with positive sounding or boring findings
Excavation photos and measurements logged with GPS; remaining strength recalculated automatically with comprehensive decay data
Resistograph
Drill resistance profile showing density variation across the pole cross-section; identifies internal decay and compression wood
Requires specialised equipment and training; adds cost per pole that must be justified by the value of accurate rejection decisions
Drill resistance profile uploaded to asset record; AI correlatess profile patterns with known decay types for diagnosis validation
We manage 28,000 distribution poles across a 1,200-square-mile territory that includes high-fire-threat districts and densely populated urban corridors. Before iFactory, our vegetation management and pole inspection programmes operated through separate contractor management systems with no data integration. Vegetation crews identified clearance violations that never reached the trimming schedule because the data had to go through three manual handoffs. Pole inspectors documented decay findings on paper forms that sat in a processing queue for an average of 11 days before generating a work order. After deploying iFactory's overhead line module, the detection-to-action cycle dropped from weeks to same-day. Our vegetation-related outage frequency decreased by 34 percent in the first year, and we passed our first post-wildfire-season regulatory audit with complete documentation for every inspected pole and every clearance measurement — something we had never achieved in the previous six years of managing these programmes separately.
— Director of Distribution Reliability, Investor-Owned Utility — 28,000 Poles, 1,200 Square Miles
Conclusion
The US overhead distribution network is aging, vegetation is growing faster than most trimming cycles can address, and regulatory scrutiny of utility vegetation and pole management practices has never been more intense. When a utility manages pole inspection through one contractor portal, vegetation management through another, and work order execution through a third system, the data fragmentation between these functions guarantees that some findings will fall through the cracks — and in a wildfire-prone jurisdiction, a single missed finding can generate liability exposure that exceeds the annual maintenance budget of the entire programme.
The alternative is a unified overhead line management platform where every vegetation encroachment, every pole condition assessment, every clearance measurement, and every corrective action lives in the same data environment — with AI-driven prioritisation that ensures the highest-risk findings are actioned first and a permanent audit trail that proves systematic compliance to every regulator who asks.
iFactory's Overhead Line and Pole Maintenance Module connects every inspection method, every vegetation survey, and every maintenance action into a single real-time view — with AI vegetation encroachment detection, multi-method pole condition assessment, risk-based prioritisation, and the compliance audit trail that reliability engineers need to defend their programmes. Book a Demo to see how the platform maps to your specific line mileage and pole count, or talk to an expert to begin your overhead line configuration and get your first prioritised inspection list live within thirty days.
Frequently Asked Questions
iFactory's data ingestion layer supports field data from all major vegetation management contractor platforms and field data collection tools — including GIS shapefiles, mobile app exports, drone imagery metadata, and standardised CSV or XML formats. The platform normalises vegetation encroachment data to a consistent standard — using a unified clearance measurement reference, GPS coordinate system, and severity classification — so that data collected by three different contractors in three different formats appears as a single consistent vegetation risk view across the entire service territory. Each contractor's data retains its source attribution for quality tracking and contract compliance verification, but the operational view is unified. The system also identifies data gaps — line segments where no inspection data has been uploaded within the contracted cycle — and generates alerts for the utility's vegetation programme manager. Talk to an expert to review how the multi-contractor data integration layer would map to your current vegetation management programme structure.
Yes. iFactory is designed to receive pole inspection data from any contractor tool that produces structured output — whether that is a mobile inspection app, a tablet-based field data collection system, or even a properly formatted spreadsheet uploaded after the field day. The platform does not require contractors to use a specific iFactory-branded tool; it normalises data from whatever tools they already use. For utilities that prefer a standardised field data collection experience, iFactory offers a mobile inspection interface optimised for pole condition assessment that contractors can use on their own devices. The choice of approach — integrate with existing contractor tools or deploy iFactory's mobile interface — depends on the utility's contractor landscape, data quality requirements, and the speed at which the utility wants inspection data to flow from field to system. Many utilities start with data integration from existing contractor tools and transition to iFactory's mobile interface in subsequent inspection cycles as contractor contracts are renewed. Book a Demo to see the data integration workflow with your contractor's current data format.
Yes. iFactory's AI vegetation encroachment model is trained on species-specific growth rate data integrated with the USFS and state forestry databases, combined with local climate zone data, historical trimming cycles, and LiDAR-derived canopy measurements. The AI does not simply measure current clearance distances — it projects future clearance at 30, 60, and 90-day intervals based on the identified species' known growth rate at the specific location's climate and soil conditions. A fast-growing cottonwood in a southeastern US climate zone is projected differently from a slow-growing pine in a northern region, even at the same current clearance distance. The risk score combines the projected clearance date with the line voltage class, wildfire threat zone designation, and historical outage frequency for that corridor segment. This multi-variable approach ensures that a vegetation management work order is generated based on when the clearance will become critical, not just when it was measured. Book a Demo to see the AI encroachment prediction model applied to sample LiDAR data from your service territory.
For a utility managing 15,000 to 50,000 poles across a 500 to 2,000-square-mile territory, iFactory's standard implementation sequence covers: weeks one to two for network architecture configuration and GIS asset register integration; weeks three to four for contractor data format onboarding and data ingestion pipeline setup; weeks five to six for vegetation AI model calibration on the utility's specific LiDAR and imagery data, and pole condition baseline establishment from existing inspection records; weeks seven to eight for prioritisation engine configuration, risk threshold setting, and work order integration with existing CMMS; and weeks nine to ten for team training, contractor onboarding, and go-live. The AI vegetation encroachment model typically achieves reliable prediction accuracy within the first 60 days of operation as it processes the first full inspection cycle data. The first risk-prioritised inspection list and vegetation clearance work order queue are available within the first 30 days. Book a Demo to build the implementation timeline specific to your utility's pole count, line mileage, contractor landscape, and current inspection programme maturity.
A Vegetation Programme and a Pole Programme Managed in Separate Systems Is Not Overhead Line Management. It Is Two Gaps Waiting to Become an Outage.
iFactory's Overhead Line and Pole Maintenance Module — AI vegetation encroachment detection, multi-method pole condition assessment, risk-based inspection prioritisation, and permanent compliance audit trail. The single platform that transforms fragmented overhead line data into a systematic, defensible, condition-based maintenance programme.