Water is the most persistent enemy of tunnel infrastructure. It does not announce itself — it seeps through membrane joints at 2 a.m., accumulates behind lining panels for months before visible staining appears, and corrodes rebar quietly while maintenance teams focus on what they can see. By the time a drainage pump failure or active inflow gets flagged during a manual inspection walkthrough, the structural damage has usually been compounding for weeks. The global tunnel construction pipeline stands at $1.48 trillion in active and planned projects — and the maintenance burden on that ageing, expanding underground network is growing faster than the inspection regimes designed to manage it. Tunnel drainage and waterproofing maintenance is not a niche problem. It is one of the most consequential and consistently under-monitored aspects of infrastructure asset management.
Your Tunnel Has a Water Problem You Don't Know About Yet. AI-Powered Leak Monitoring Finds It Before It Finds You.
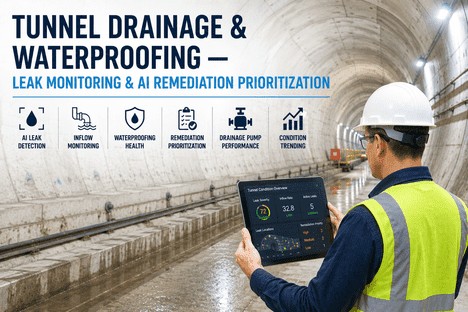
iFactory's infrastructure maintenance platform gives tunnel maintenance managers continuous leak monitoring, inflow quantification, drainage pump health tracking, and AI-driven remediation prioritization — in one connected view, updated in real time.
Global tunnel construction pipeline — every new tunnel adds decades of drainage and waterproofing maintenance obligation
70%+
Of tunnel defects involve water infiltration or drainage failure — the most prevalent and most damaging class of tunnel maintenance issue
100 yrs
Design service life now required for tunnel structures — waterproofing performance must be managed and verified across the full lifecycle
Weeks
How long undetected inflow typically progresses before visible surface damage — the gap where reactive inspection always arrives too late
Why Tunnel Water Management Fails — The Inspection Gap That Traditional Methods Cannot Close
Most tunnel maintenance programmes treat water as a reactive problem: inspection teams walk the structure on a scheduled basis, identify visible staining, dampness, or active drips, log the observations, and raise remediation work orders. The system works adequately when defects are obvious and progression is slow. It fails completely when infiltration begins at membrane joints or drainage layer interfaces — where water accumulates behind the lining, builds hydrostatic pressure, and causes reinforcement corrosion and concrete delamination over months before any surface indicator appears.
Inspections Are Snapshots, Not Monitoring
A quarterly walkthrough inspection captures the state of a tunnel on four days per year. Water infiltration, drainage blockage, and pump degradation are continuous processes that do not schedule themselves around inspection cycles. The structural damage that occurs in the 89 days between inspections is entirely invisible to the maintenance record until the next visit.
Inflow Rates Are Estimated, Not Measured
Manual inspection produces qualitative observations — "dampness noted at chainage 1+240" — not inflow volume data. Without quantified inflow rates across inspection periods, maintenance managers cannot determine whether a defect is stable, progressing slowly, or accelerating toward structural significance. Remediation prioritisation based on qualitative observation systematically misallocates repair budgets.
Drainage Pump Failures Have No Early Warning
Drainage sump pumps are typically checked during inspection rounds or when they fail and trigger a reactive maintenance call. Pump condition — run hours, temperature, motor current draw, cycle frequency — is not tracked continuously. The first signal of a developing pump failure is often the pump itself going offline, at which point the sump is already flooding and the emergency response cost is multiples of what predictive intervention would have required.
Remediation Backlog Has No Objective Priority
When the inspection log contains forty defect observations across twelve tunnel sections and a maintenance budget that covers fifteen repairs per quarter, the prioritisation decision is usually made by the most experienced engineer available — based on memory, judgment, and paper records. Without data on defect progression rates, inflow volumes, structural proximity, and drainage system stress, the priority order is a professional estimate rather than a risk-ranked plan.
Stop Finding Water Problems After They've Already Become Structural Problems.
iFactory connects sensor data, inspection records, pump telemetry, and inflow measurements into a single maintenance intelligence platform — giving tunnel maintenance managers the continuous visibility their inspection schedules never could.
How Water Infiltration Actually Progresses — The Damage Timeline Most Inspection Regimes Miss
Understanding the failure progression is the foundation for understanding why continuous monitoring changes the maintenance economics of tunnel waterproofing. Water infiltration does not transition directly from invisible to critical. It follows a well-documented progression — each stage with its own detection window, remediation complexity, and cost profile. The maintenance challenge is catching defects at Stage 1 or 2. Reactive inspection reliably catches them at Stage 3 or 4.
Water Infiltration Damage Progression — Where Detection Happens vs. Where It Should Happen
Stage
What Is Happening
Detection Method
Relative Repair Cost
Stage 1
Membrane breach
Waterproof membrane develops micro-perforations at joints, overlaps, or fixings. Water begins migrating through the membrane layer in small volumes. No visible indicator on the inner lining surface. Drainage layer may absorb initial flow without measurable increase at sumps.
Sensor monitoring only
1×
Stage 2
Drainage layer saturation
Inflow volume exceeds drainage layer capacity in localised zone. Hydrostatic pressure begins building against the secondary lining. Sump pump cycle frequency increases measurably. Slight moisture at surface in warm periods may appear but is often attributed to condensation.
Pump telemetry + sensor
3–5×
Stage 3
Visible infiltration
Water breaks through to the lining interior surface. Staining, damp patches, and active seeps are visible during inspection. Reinforcement corrosion is likely already initiated. This is the stage at which scheduled manual inspection reliably detects the problem — often 3–12 months after Stage 1.
Visual inspection
10–20×
Stage 4
Structural impact
Concrete delamination, spalling, rebar exposure, or lining displacement become evident. Structural repair rather than waterproofing remediation is required. Traffic management, partial closure, and specialist contractor mobilisation add cost multiples beyond the waterproofing intervention alone.
Emergency response
40–100×
What iFactory's AI-Driven Tunnel Maintenance Platform Does for Drainage and Waterproofing
iFactory is a maintenance management platform built for infrastructure asset managers who need to move beyond scheduled inspection toward continuous monitoring. For tunnel drainage and waterproofing specifically, iFactory connects sensor data, pump telemetry, inspection records, and inflow measurements into a single asset view — and applies AI-driven analytics to transform that data into prioritised maintenance actions rather than growing observation logs.
Capability A
Continuous Leak Monitoring — Sensor-Based Inflow Detection Across Every Drainage Zone
24/7 Detection
iFactory integrates with moisture sensors, pressure sensors, and flow sensors deployed across tunnel drainage zones to provide continuous inflow monitoring between inspection visits. Sensor readings are logged against chainage and zone identifiers, with anomaly detection algorithms flagging readings that deviate from the established baseline for that zone and season. When a sensor detects inflow acceleration — not just the presence of moisture, but a statistically significant change in inflow rate — the platform generates a condition alert and links it directly to the asset record and work order queue for that tunnel section. The result is a detection capability that operates continuously at the precision and consistency that no inspection team, regardless of frequency, can replicate.
Chainage-referenced sensor logging
Inflow rate trend analysis
Anomaly-triggered condition alerts
Capability B
Inflow Quantification — Replacing Qualitative Notes With Measurable Volume Data
Data-Driven Assessment
iFactory replaces the subjective "dampness noted" observation with quantified inflow data — litres per hour, per zone, per inspection period. When inspection records are entered into the platform, they are cross-referenced against sensor and pump cycle data for the same location and period to produce an inflow volume estimate that is far more precise than visual observation alone. This data is tracked over time per zone, producing a trend line that shows whether inflow at a given chainage is stable, slowly increasing, or accelerating. Maintenance managers can see, for the first time, whether a defect noted six months ago is the same defect or a worsening one — and the AI remediation prioritisation engine uses this progression data as one of its primary inputs for ranking repair urgency.
Volume-per-zone inflow tracking
Sensor-inspection data fusion
Defect progression trend lines
Capability C
Drainage Pump Health Monitoring — Predictive Maintenance Before the Pump Fails
Predictive Pump Maintenance
iFactory tracks drainage pump assets against their operational telemetry — cumulative run hours, cycle frequency per day, motor temperature, and current draw — to build a health model for each pump across the tunnel drainage network. As run hours accumulate and cycle frequency increases relative to baseline (a sign of increasing inflow demand), the platform generates a predictive maintenance recommendation before the pump reaches its end-of-life threshold. When pump telemetry deviates sharply from the established pattern — an unexpected current spike, a missed cycle, an abnormal temperature reading — the system triggers an urgent inspection work order and links it to the relevant drainage zone's inflow trend data, giving the responding technician the full context before they enter the tunnel. The cost difference between a planned pump replacement and an emergency AOG pump failure — including the sump flooding, structural exposure time, and emergency contractor rates — is substantial.
Run-hour and cycle frequency tracking
Telemetry deviation alerts
Predictive replacement scheduling
Capability D
AI Remediation Prioritisation — Risk-Ranked Repair Sequences Based on Actual Defect Data
AI Risk Ranking
The most consequential output of iFactory's tunnel monitoring module is the AI-generated remediation priority list — a ranked queue of waterproofing and drainage repair work orders, ordered not by date of observation but by risk-weighted urgency. The AI model scores each defect across five dimensions: current inflow volume, inflow trend direction and acceleration rate, proximity to structurally sensitive elements such as joints, liners, or embedded services, drainage system stress in the same zone, and time since last verified intervention. This scoring model produces a repair priority sequence that reflects actual structural risk, not inspection schedule timing. Maintenance managers can take this output directly into budget allocation and contractor planning sessions — with the data to justify the sequence to asset owners, regulators, and finance teams who require an evidence base for maintenance spend decisions.
Five-factor defect risk scoring
Dynamic priority reranking
Auditable decision data export
Comparing Monitoring Approaches — What Each Regime Can and Cannot Detect
The decision to invest in continuous monitoring is ultimately a question of what the organisation is willing to miss. Each monitoring approach covers a different detection window and produces a different quality of data for maintenance decision-making. The comparison below is specific to tunnel drainage and waterproofing defects.
Scheduled Visual Inspection
Quarterly or annual walkthrough
Detects
Visible staining, active drips, surface spalling, obvious drainage blockage
Better record-keeping but still qualitative; no continuous data, limited defect trending
iFactory Continuous Monitoring
Sensor + telemetry + AI analytics
Detects
All stages of infiltration progression, pump performance degradation, drainage system stress, inflow rate acceleration
Misses
Sensors have coverage gaps — physical inspection still required, but targeted and far less frequent
Data Quality
Continuous quantitative data, trend lines, AI risk scoring, audit-ready output for asset owners and regulators
"
We had forty-three documented waterproofing defects across seven tunnel sections — all of them logged from inspections, none of them ranked by anything other than the last engineer's assessment of which ones looked worst on the day. When we moved to continuous monitoring and loaded all the historical defect records into iFactory, the AI prioritisation output was completely different from our working repair sequence. Three defects that had been sitting low on our list showed inflow acceleration patterns that put them at the top. Two that were consuming our budget were stable and could wait. We redirected two quarters of repair spend based on that output and the asset owner's audit committee accepted the revised plan on the first presentation because we had the data to back every decision.
— Tunnel Maintenance Manager, National Road Infrastructure Authority — 22 Years Underground Asset Management
Conclusion
The maintenance economics of tunnel waterproofing are not primarily determined by the cost of the repair — they are determined by when the defect is found. A Stage 1 membrane breach caught by sensor monitoring in month one is a planned, low-cost intervention. The same defect found at Stage 3 visual inspection in month nine is a disruptive, expensive repair with structural consequences already in progress. The global tunnel construction pipeline — now valued at $1.48 trillion — is creating an expanding maintenance obligation that scheduled inspection regimes, however diligently managed, cannot keep pace with. Continuous monitoring, inflow quantification, pump health telemetry, and AI-driven remediation prioritisation are not future capabilities. They are available now, and the organisations deploying them are managing smaller repair backlogs, spending maintenance budgets more accurately, and presenting asset owners with an evidence base for every maintenance decision that manual inspection records simply cannot provide.
iFactory brings all of this into one platform — connecting your sensor data, inspection records, pump telemetry, and AI analytics into a single maintenance intelligence view, accessible to every member of your team and auditable by every stakeholder who needs to understand where your waterproofing and drainage maintenance programme stands. Book a Demo to see how the platform maps to your tunnel asset portfolio, or talk to an expert to discuss your specific monitoring and prioritisation challenges before your next inspection cycle.
Frequently Asked Questions
iFactory supports integration with moisture sensors, water level sensors, differential pressure sensors, and flow meters deployed in drainage zones and sumps. For pump monitoring, the platform integrates with motor current sensors, temperature probes, and run-time relays via standard IoT communication protocols including MQTT, Modbus, and REST API. The specific sensor hardware does not need to be replaced — iFactory is designed to ingest data from the sensors already deployed in your tunnel network through its integration layer, with new sensor deployments supported through the same configuration process. Talk to an expert to confirm compatibility with your existing sensor infrastructure.
iFactory's remediation prioritisation model incorporates structural sensitivity as a configurable weighting parameter — allowing maintenance managers to specify that certain chainage ranges, structural elements, or service-critical zones carry a higher consequence multiplier in the risk scoring calculation. This means a relatively low inflow rate at a structurally sensitive joint can outrank a higher inflow rate in a non-critical section, where the consequence of delayed remediation is lower. Structural sensitivity zones are configured during initial asset setup and can be updated by the maintenance manager at any time as asset knowledge develops. Book a Demo to walk through how the model would be configured for your specific tunnel portfolio.
Yes. iFactory maintains a complete, time-stamped maintenance record for every defect, inspection, work order, and sensor event associated with each tunnel section — formatted for export as a structured maintenance history document. For warranty claim purposes, this provides the continuous inflow monitoring record and documented intervention history that warranty administrators require to assess whether waterproofing system performance has been within specification and whether infiltration events were detected and responded to within required timeframes. For regulatory submissions, the platform's audit export function produces a comprehensive record of all maintenance decisions, including the AI priority scoring that supported each repair sequencing decision. Talk to an expert to discuss the specific documentation requirements for your regulatory jurisdiction.
Implementation begins with asset configuration — loading tunnel structure records, chainage references, drainage zone definitions, and pump asset records into the platform. Existing inspection history, whether from a CMMS, spreadsheets, or paper-based logs, is migrated into iFactory's defect record format so that historical trend data is available from day one. Sensor and telemetry integration is configured in parallel, with the first live monitoring data typically visible within the first two to three weeks. For a network of five to ten tunnel structures, full implementation including historical data migration, sensor integration, AI model calibration, and team training typically completes within eight to ten weeks. The first AI-generated remediation priority list is available as soon as sufficient sensor baseline data has been established — usually within the first four weeks of live monitoring. Book a Demo to build a specific implementation timeline for your tunnel asset portfolio.
Your Inspection Schedule Tells You What Your Tunnel Looked Like Last Quarter. iFactory Tells You What It Looks Like Right Now.
Continuous leak monitoring, inflow quantification, drainage pump health tracking, and AI remediation prioritisation — in one platform, connected to every sensor and every inspection record in your tunnel network.