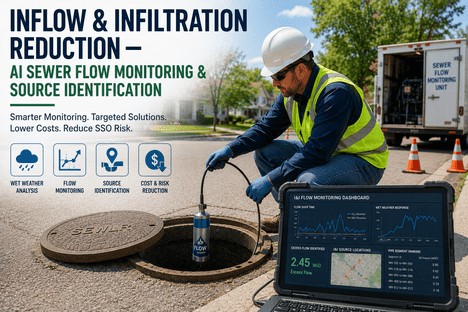
A utility manager watching flow data during a dry week sees the baseline. The same manager watching flow data during a storm sees the problem. When a sanitary sewer suddenly carries three times its dry-weather volume after a rain event, every gallon above the baseline is extraneous — groundwater seeping through cracked pipe joints, stormwater entering through broken manhole chimneys, roof drains and sump pumps illegally connected to the sanitary system. That excess water does not disappear. It consumes treatment capacity at the plant, drives up pumping energy cost, accelerates infrastructure deterioration, and when the system reaches its hydraulic limit, it becomes a sanitary sewer overflow in a creek, a basement, or a street. Traditional I&I reduction programmes attack this problem with CCTV inspections, smoke testing, and dye tracing — methods that are effective but slow, labour-intensive, and capable of covering only a fraction of the network each year. AI sewer flow monitoring changes the sequence entirely: continuous analytics identify the subcatchments and individual assets that contribute the most excess flow, before a single field crew is dispatched. The result is a targeted I&I reduction programme that spends rehabilitation budget on the pipes and manholes that actually drive the wet-weather spikes, not on the ones that happen to be scheduled for inspection this quarter.
AI Flow Monitoring · I&I Source Identification · Wet Weather Analytics · Targeted Rehab Planning
Every Gallon of Infiltration That Enters Your System Is a Gallon You Pay to Treat Twice — Once at the Plant and Once When You Replace the Pipe It Destroyed. AI Finds the Source Before Either Cost Accumulates.
iFactory's AI-powered I&I detection platform ingests existing flow monitor, SCADA, and rainfall data to continuously differentiate between dry-weather baseline, groundwater infiltration, and rainfall-driven inflow — pinpointing the specific subcatchments and assets that contribute excess flow, so every rehabilitation dollar targets the actual source of the problem.
Inflow and Infiltration Are Not the Same Problem — and AI Is the Only Tool That Treats Them Differently
The term I&I is used as a single phrase in utility planning, but inflow and infiltration are fundamentally different hydraulic phenomena with different causes, different remediation strategies, and different cost profiles. Treating them as one problem is the reason many I&I reduction programmes spend years chasing symptoms without addressing the specific mechanisms. AI-powered flow analysis is the tool that finally separates them — continuously, at network scale, without sending a single field crew into the street.
Groundwater seeping into sewer pipes and manholes through structural defects — cracked pipes, failed joints, deteriorated manhole walls, and broken connections. Infiltration is groundwater-driven and sensitive to seasonal water table elevation. It is typically steady, continuous, and proportional to the extent and severity of structural degradation in the pipe network.
Primary causes
Cracked pipes, open joints, manhole wall deterioration, defective service connections, root-damaged laterals
AI detection signature
Nighttime minimum flow elevated above dry-weather baseline during high groundwater periods, with flow increases correlating to seasonal water table rather than individual rainfall events
Stormwater entering the sanitary sewer system directly through manhole covers in flooded areas, illegal roof downspout and sump pump connections, cross-connected storm drains, and defective manhole frames and chimney seals. Inflow is rainfall-driven, event-based, and characterised by rapid-onset flow spikes that closely track the hydrograph of the rainfall event.
Primary causes
Manhole cover infiltration, illegal roof drain connections, sump pump misconnections, cross-connected storm laterals, defective manhole chimney seals
AI detection signature
Rapid flow spike within minutes of rainfall onset, peak flow proportional to rainfall intensity, rapid return to baseline after rain stops — distinct from the slower infiltration response pattern
20%
Achievable I&I-related flow reduction documented by utilities using AI-driven detection and targeted intervention — Anglian Water case study, 2026
600 hrs
Reduction in pumping station runtime achieved when I&I is identified and removed at the source — delivering energy savings alongside treatment cost reduction
3 weeks
Setup time for AI-driven I&I detection using existing sensor and SCADA data — no new hardware installation or hydraulic modelling required
25%
Of all spill events originate from catchments with active I&I — meaning a quarter of overflow risk is addressable by finding and fixing the right infiltration and inflow sources
The Hidden Cost of I&I — What It Actually Costs Your Utility and Why It Is Systematically Underestimated
Most utility cost models for I&I capture only the obvious line items: additional treatment chemical consumption, marginal energy cost for pumping excess volume, and the occasional emergency repair when a pipe collapses under the hydraulic load of a wet-weather event. The costs that are almost never quantified are the structural ones. Every gallon of infiltration that enters a pipe through a crack accelerates the deterioration of that pipe through erosion of the pipe bedding, soil migration into the joint, and the progressive enlargement of the defect. The pipe that would have lasted forty more years with dry-weather flow alone begins to fail in fifteen because the infiltration load was never addressed. The full lifecycle cost of I&I is not measured in additional treatment kWH — it is measured in premature pipe replacement that the capital plan did not account for.
The I&I Cost Iceberg — What Gets Budgeted vs. What Actually Accumulates
Visible costs (included in I&I budget)
Treatment chemical and energy cost for excess wet-weather volume
Pumping station energy consumption for excess flow conveyance
SSO cleanup and regulatory fine costs from capacity exceedance events
Emergency repair mobilisation for overflow-related pipe failures
Hidden costs (rarely quantified)
Accelerated pipe deterioration from bedding erosion caused by infiltration flow paths
Premature capital replacement of pipes that would have lasted 20+ more years without I&I damage
Lost treatment capacity during wet weather — peaking capacity consumed by I&I rather than serving new connections
Deferred system expansion as treatment capacity is absorbed by extraneous flow instead of growth capacity
Most I&I programmes budget only for the visible costs. The hidden costs typically exceed visible costs by a factor of 3x to 5x over the asset lifecycle — but they are invisible until the capital plan is forced to absorb an unfunded pipe replacement that the I&I damage caused.
AI I&I detection targets the sources that drive both visible and hidden costs — finding the infiltration entry points before the pipe replacement cost is triggered.
How AI Flow Monitoring Detects I&I Where Traditional Methods Cannot
Traditional I&I detection relies on physical inspection techniques — CCTV surveys to identify structural defects, smoke testing to locate inflow entry points, and dye tracing to confirm connectivity between storm and sanitary systems. Each method is effective within its scope, but each one requires sending a crew to the field, closing streets, and inspecting one asset at a time. A utility with 1,200 miles of sewer may inspect 4% of its network annually — meaning a complete I&I assessment cycle takes 25 years. AI flow monitoring does not replace these methods. It replaces the sequence. Instead of starting with field inspections and hoping the right pipes are selected, AI analysis of continuous flow data identifies the specific subcatchments and time windows where I&I is active, and dispatches field crews only to the assets that the data has already flagged as likely contributors.
Continuous Dry-Weather Baseline Learning
The AI ingests historical and real-time flow data from existing sewer level monitors, pump station SCADA, and treatment plant inflow records. It learns the dry-weather flow fingerprint of each monitored asset — the expected diurnal pattern, the seasonal variations, and the baseline minimum night flow. This baseline is continuously updated, so seasonal changes in water consumption and groundwater level are automatically incorporated. Any deviation from the learned baseline is flagged as a potential I&I event.
Rainfall-Event Correlation and Flow Component Separation
When a rainfall event occurs, the AI correlates the timing and intensity of precipitation — from hyperlocal rainfall data at 1 km grid resolution — with the flow response at every monitored asset. By analysing the shape of the hydrograph response, the AI separates the flow into three components: base dry-weather flow, infiltration response (slow, sustained elevation above baseline, proportional to cumulative rainfall and groundwater level), and inflow response (rapid spike, closely matching the rainfall hydrograph, returning to baseline quickly after rain stops). Each component is quantified in volume and peak flow rate per asset.
Subcatchment Ranking and Asset-Level Source Attribution
The AI aggregates I&I volume and peak contribution by subcatchment and ranks every monitored zone by its contribution to total system I&I load. Within each high-ranking subcatchment, the AI cross-references flow anomaly patterns with asset attributes — pipe age, material, installation decade, soil type, groundwater elevation — to identify the specific pipes and manholes most likely to be the I&I entry points. This produces a ranked I&I source list that tells the field crew exactly which assets to inspect and which defects to look for, rather than requiring them to inspect the entire subcatchment.
Wet Weather Flow Separation · I&I Volume Quantification · Subcatchment Ranking · Asset-Level Targeting
Most I&I Programmes Spend 90% of Their Budget Inspecting Pipes That Are Not the Source of the Problem. AI Flow Monitoring Spends 100% of the Budget on the Pipes That Actually Drive the Wet-Weather Spikes.
Continuous AI analysis of existing flow data turns every wet-weather event into a diagnostic dataset — identifying the specific subcatchments, manholes, and pipe segments that contribute excess flow, so field crews are dispatched only to assets the data has already flagged.
What the I&I Detection Dashboard Shows the Utility Manager
The utility manager view of iFactory's I&I detection platform is not a SCADA interface — it is a decision-support tool designed around the specific questions that determine whether an I&I programme succeeds or stalls: where is the excess water coming from, how much is entering, which assets are responsible, and what is the most cost-effective intervention for each source?
Dashboard View 01
Catchment I&I Heat Map — Ranked by Excess Flow Volume and Peak Contribution
Every monitored subcatchment appears on a colour-coded map ranked by total I&I volume and peak flow contribution during wet-weather events. A utility manager sees immediately which 20% of the network produces 80% of the I&I load — and can drill into each high-ranking subcatchment to view the individual assets driving the excess flow. The heat map is updated after every rainfall event, so the priority ranking reflects current system behaviour rather than a static condition assessment from last year's CCTV programme.
Decision: Which basins should receive this year's rehabilitation budget? The heat map ranks them by measured I&I contribution.
Dashboard View 02
Inflow vs. Infiltration Split — Separated by Volume per Asset
For each subcatchment and each individual asset, the dashboard displays the proportional split between infiltration and inflow components. This distinction determines the rehabilitation strategy: infiltration-dominated catchments are candidates for CIPP lining and manhole structural rehabilitation, while inflow-dominated catchments require manhole cover seal replacements, chimney seal rehabilitation, and illegal connection identification. Allocating the wrong intervention type to a catchment is a common and expensive I&I programme failure — the dashboard prevents it by separating the components before the field work begins.
Decision: Is this catchment an infiltration fix or an inflow fix? The data separates them before the crew is dispatched.
Dashboard View 03
Storm Event Comparison and I&I Trend Analysis
Every rainfall event is automatically recorded and analysed, and the I&I response is compared across events of similar intensity and duration. This trend view reveals whether the I&I condition is improving, stable, or deteriorating over time — essential feedback for evaluating whether rehabilitation interventions have been effective. If a subcatchment that received CIPP lining last year still shows the same I&I volume during this year's wet season, the dashboard flags it before the programme budget is closed out, enabling corrective action before the next cycle.
Decision: Did last year's rehabilitation investment actually reduce I&I? The trend comparison answers with data, not assumptions.
Dashboard View 04
Targeted Field Investigation Worklist — Ranked by I&I Confidence Score
The dashboard generates a prioritised field investigation worklist for crews, showing the specific pipe segments and manholes most likely to be I&I entry points. Each asset on the worklist is ranked by an I&I confidence score that combines the volume of excess flow attributed to the asset, the pattern of the flow anomaly consistent with infiltration or inflow, and the asset attributes that suggest structural vulnerability. The worklist includes the recommended investigation method — CCTV for suspected infiltration, smoke testing or manhole inspection for suspected inflow — so the crew arrives with the right equipment and the right objective.
Decision: Which assets do we inspect this month? The worklist ranks them by the data, not by inspection schedule rotation.
"
We knew we had an I&I problem in the West Basin. Every wet season, the pumping station in that catchment ran at capacity, and twice in three years we had basement flooding complaints. The traditional approach would have been a basin-wide CCTV programme — 400,000 linear feet of inspection, taking nine months, costing half a million dollars before we identified a single defect. Instead, we deployed AI flow monitoring on the existing sewer level sensors and pump station SCADA data. Within the first three weeks, the AI identified that 70% of the excess wet-weather volume was coming from a single subcatchment of 28 manholes. We sent a crew with smoke testing and manhole inspection equipment to those 28 manholes. They found 11 with defective chimney seals and 4 with illegal sump pump connections. The total cost of the field investigation was less than one week of what the CCTV programme would have cost. Infiltration in that catchment dropped 35% after we sealed those manholes. The AI found the needle before we even bought the haystack.
— Utility Manager, Mid-Sized Municipal Sanitary District — 600 Miles of Gravity Sewer, 8,500 Manholes
The I&I Reduction Programme That AI Makes Possible — From Reactive Screening to Targeted Source Elimination
The transition from a traditional I&I programme to an AI-driven one is not a technology replacement — it is a sequence inversion. The traditional programme inspects first, analyses second, and intervenes third. The AI-driven programme analyses first, targets second, and inspects only the assets the analysis has identified as probable contributors. The inversion compresses the detection timeline from years to weeks, reduces investigation cost by 50% or more, and ensures that rehabilitation budget is spent on the assets that actually drive excess flow rather than the ones that happen to be in the inspection rotation.
Traditional vs. AI-Driven I&I Programme — The Sequence Difference
Step 1
Inspect the entire target basin with CCTV and smoke testing
Step 2
Manually compile defect codes and correlate with flow data
Step 3
Identify probable I&I entry points from the compiled dataset
Step 4
Rehabilitate identified defects
12-18 months per basin cycle. High cost. Results depend on whether the right pipes were inspected.
Step 1
AI analysis of existing flow data — identifies high-probability I&I subcatchments
Step 2
Ranked worklist of specific manholes and pipe segments most likely to be entry points
Step 3
Targeted field inspection of only the assets on the ranked worklist
Step 4
Rehabilitate confirmed defects and measure I&I reduction in the next wet event
3-4 weeks to first I&I source identification. 60-80% less field inspection cost. Results verified in the next rainfall.
Conclusion
Inflow and infiltration remain the most persistent and expensive operational challenge in wastewater collection systems — not because the technology to detect it does not exist, but because the traditional sequence of inspect-first-analyse-later is too slow and too expensive to cover enough of the network quickly enough. A utility inspecting 4% of its system annually will take 25 years to complete one assessment cycle. By the time the cycle ends, the first pipes inspected have already developed new defects. AI sewer flow monitoring inverts this sequence, turning continuous flow data into a live diagnostic tool that identifies the specific subcatchments and assets contributing excess flow before a single field inspection begins.
The documented outcomes from utilities that have adopted AI-driven I&I detection are consistent and compelling: 20% reduction in I&I-related flow, 600 hours of saved pumping runtime, 60-80% reduction in field inspection costs, and the identification of I&I sources that traditional methods had missed because the scope of physical inspection was too narrow. The rehabilitation dollar that was previously spread thinly across an entire basin-wide inspection programme is concentrated on the specific pipes and manholes that the data has already identified as the actual source of excess flow. For utility managers who have watched their I&I programme consume ever-increasing budgets while the wet-weather flow volume remains stubbornly unchanged, the AI-driven approach is not a marginal improvement on an existing process — it is a fundamentally different way of solving the problem.
iFactory's AI-powered I&I detection platform is purpose-built for wastewater utility managers who need to reduce excess flow without spending two years and a full inspection programme to find out where the water is coming from. Book a Demo to see the platform configured for your collection system's flow and rainfall data, or talk to an expert about a free I&I source identification pilot for your highest-contributing subcatchment.
Frequently Asked Questions
The Water Is Already in Your System. The Question Is Where It Is Entering — and AI Answers That Question Before Your Next Wet Season Arrives.
iFactory's AI-powered I&I detection platform — continuous flow and rainfall analysis, infiltration versus inflow separation, subcatchment-level source identification, and targeted field investigation worklists generated from the data your SCADA and flow monitors already collect.