Stormwater compliance is no longer a seasonal concern or a checkbox on an annual report. With evolving MS4 permit requirements, Total Maximum Daily Load (TMDL) obligations, and mounting pressure from EPA audits, utility managers are being asked to do more with less — and to prove it with data. The challenge is not a lack of regulations or technology. It is the gap between the compliance data a utility collects and the operational decisions that data could drive. Municipalities that invest in monitoring infrastructure without investing equally in the workflows, accountability measures, and analytics tools that turn data into action find themselves with robust records and no improvement in compliance outcomes. Building a data-driven stormwater compliance programme is not a software installation — it is a management transformation with defined stages, deliberate process change, and a KPI framework that connects field-level inspection data to strategic permit performance.
Compliance Data Without Decision Infrastructure Is Just Paperwork. iFactory Builds Both.
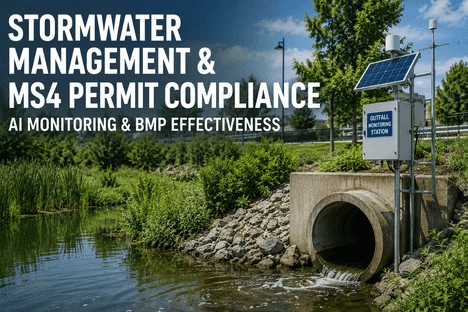
iFactory's stormwater compliance platform gives utility managers the operational data infrastructure to run a permit-ready programme — with real-time BMP tracking, outfall monitoring integration, IDDE workflow automation, and the analytics that turn field inspection data into strategic compliance intelligence.
Of municipalities with stormwater utilities report their programmes remain underfunded despite dedicated fee structures — revealing a persistent gap between compliance mandates and operational resources
$23B+
Estimated stormwater infrastructure funding gap — compliance costs from evolving MS4 permits far exceed current municipal budgets, making data-driven prioritisation essential
2,934
Illicit discharges identified across a single state's MS4 permit cycle — highlighting the scale of IDDE programme demands and the need for systematic tracking and elimination workflows
95%
TSS removal achieved by well-sited infiltration BMPs per the International BMP Database — yet performance depends entirely on inspection frequency, maintenance timing, and data-driven adaptive management
Why Most MS4 Compliance Programmes Struggle — and What the Research Reveals
The pattern is consistent across municipalities that invest in stormwater monitoring and compliance systems without investing equally in the operational workflows and management behaviours needed to sustain them: inspection backlogs grow within six months, BMP maintenance falls behind schedule, outfall screening data goes unanalysed, and annual reports become exercises in narrative reconstruction rather than data-driven accountability. Three root causes explain nearly every case where compliance technology fails to produce compliance outcomes.
01
Inspections Were Scheduled. The Follow-Through Was Not.
EPA audit findings consistently cite neglected stormwater controls, incomplete outfall screening records, and failure to document illicit discharge investigations. The issue is rarely an absence of inspection schedules — it is the absence of a closed-loop workflow that connects field data collection to corrective action tracking, maintenance confirmation, and compliance reporting. Without automated triggers that escalate incomplete inspections or overdue BMP maintenance to the responsible supervisor, even the best inspection plan produces gaps in the compliance record that regulators flag.
02
BMP Performance Data Was Collected. It Was Not Acted Upon.
Infiltration practices achieve up to 95% TSS removal and wet ponds deliver 80% — but only when they are inspected, maintained, and repaired on schedules tied to actual performance data rather than calendar cycles. When sediment accumulation in a detention basin goes unmonitored, or when a bioretention cell's drawdown time exceeds design specifications without triggering a maintenance work order, BMP effectiveness degrades silently. The data exists in inspection logs. What is missing is the decision infrastructure — the threshold-based alert that converts a drawdown observation into a scheduled cleanout before the next rain event exceeds the system's compromised capacity.
03
Annual Reports Were Submitted. Programme Improvement Was Not Measured.
Standardised cost reporting for MS4 permit implementation is now a regulatory direction in multiple states, and for good reason: without consistent tracking of what compliance activities cost and what outcomes they produce, utility managers cannot demonstrate programme effectiveness or build the business case for increased funding. The research shows that municipalities with established stormwater utilities rarely track expenditure-to-outcome ratios — and 83% report persistent underfunding. Annual reports document activity volume but not programme trajectory. A compliance system that does not surface trend data — outfall screening completion rates over time, IDDE elimination timelines, BMP maintenance adherence by asset class — leaves utility managers preparing regulatory submissions without the strategic intelligence needed to improve the programme.
A Compliance Dashboard Nobody Reviews Is Not a Compliance Programme. iFactory Makes Your Data Audit-Ready and Actionable.
iFactory surfaces the right compliance metrics at the right level — field inspector, programme coordinator, utility manager — with real-time BMP status, outfall screening alerts, IDDE case tracking, and automated annual report generation that transforms compliance data from a reporting burden into a strategic asset.
The Stormwater Compliance Maturity Model — Four Stages Every Utility Passes Through
Understanding where your utility sits on the compliance maturity curve is the starting point for any programme improvement strategy. Most MS4 permittees operate at Stage 1 or Stage 2. The utilities that consistently pass EPA audits, demonstrate measurable pollutant reduction, and secure board approval for infrastructure investment are operating at Stage 3 or Stage 4. The difference is not the monitoring technology they own — it is the operational discipline and analytics capability they have built around it.
Stormwater Compliance Maturity Model — Where Does Your Utility Stand?
Stage
Compliance Approach
Data Characteristics
Leadership Priority
Stage 1
Reactive
Compliance addressed as a reporting exercise. Inspections conducted close to deadline. Maintenance performed after system failure or regulatory notice. No proactive IDDE programme.
Paper-based inspection forms, disconnected spreadsheets, annual report data compiled manually from email records and PDF logs. No accessible trend history.
Move all compliance records into a single digital system with standardised field definitions. Centralise outfall inventory, BMP asset register, and IDDE case logs.
Stage 2
Documentation
Inspections and maintenance follow calendar-based schedules. Outfall screening conducted annually. IDDE cases documented and tracked manually. Annual reports produced with historical comparison data.
Centralised digital records for inspections, BMP maintenance, outfall screening, and IDDE cases. Data is reviewed quarterly but not used for real-time programme adjustment.
Establish KPI-based programme reviews at monthly interval. Define threshold alerts for overdue inspections, BMP maintenance triggers, and outfall screening deviations. Assign accountability for each metric.
Stage 3
Analytics-Driven
BMP maintenance prioritised by performance data rather than calendar schedules. IDDE cases tracked with source identification and elimination timelines. Outfall screening schedules adjusted based on land use risk and historical findings.
Real-time dashboards for BMP status, outfall screening completion, IDDE case resolution, and inspection adherence by asset class. Trend analytics identify repeat problem areas and programme drift before annual reporting.
Build team data literacy around compliance analytics. Establish weekly programme review rituals. Reward data-identified issues corrected before regulatory inspection. Connect programme data to budget planning.
Stage 4
Predictive
Maintenance interventions scheduled before BMP performance degrades. IDDE risk mapping directs outfall screening to highest-probability areas. Pollutant load reduction trajectories modelled against TMDL targets. Budget requests supported by programme outcome data.
AI-driven anomaly detection in BMP performance data. Condition-based maintenance triggers. Integrated asset management, financial planning, and compliance reporting. Automated annual report generation with trend analysis and outcome measurement.
Integrate compliance analytics into capital planning and rate-setting processes. Use programme outcome data in board and council presentations. Benchmark against peer utilities and drive continuous improvement in pollutant reduction cost efficiency.
The Utility Manager's Playbook — Six Actions That Build a Data-Driven MS4 Compliance Culture
Compliance culture does not change through policy updates or software deployments. It changes through consistent management behaviour, visible accountability mechanisms, and the gradual replacement of deadline-driven compliance with data-driven programme management. These six actions distinguish utilities that build sustainable, audit-ready compliance programmes from those that cycle through inspection seasons with increasing backlogs and decreasing confidence in their regulatory submissions.
Action 01
Map Your Compliance Decision Architecture Before You Configure Your Dashboard
Foundation Step
Before configuring compliance dashboards or KPI tracking, map the operational decisions your utility makes across each programme area — outfall screening scheduling, BMP inspection prioritisation, IDDE case investigation routing, construction site inspection allocation — and identify which of those decisions would change if the relevant data were visible in real time. A field inspector deciding which outfall to screen this week based on last quarter's findings is a decision. A programme coordinator prioritising BMP maintenance based on sediment accumulation trend rather than months-since-last-inspection is a decision. A utility manager reallocating budget from reactive catch-basin cleaning to proactive inlet retrofitting based on cost-per-event data is a decision. Every metric on your compliance dashboard should trace directly to a named decision, a named decision-maker, and a defined response trigger. This architecture — built before any software configuration — is what separates compliance dashboards that drive programme improvement from those that produce ignored reports.
Action 02
Start the Monthly Compliance Review Ritual with Live Data
Leadership Behaviour
The most powerful signal a utility manager sends about the importance of compliance data is how they open programme review meetings. If monthly compliance reviews begin with a live dashboard — outfall screening completion rate, BMP inspection adherence, IDDE case resolution timeline, open corrective actions by age — rather than a verbal briefing from the programme coordinator, the message to every inspector and field supervisor is unambiguous: data is how we measure and improve this programme. Establish a standing protocol where the first ten minutes of any compliance review involves opening the platform and reviewing the previous period's performance against target. Utility managers who do this consistently report that their teams begin reviewing and preparing compliance data before they arrive at meetings, rather than constructing explanations for missed metrics after the fact.
Action 03
Invest in Field Inspector Data Literacy — Input Quality Determines Compliance Confidence
Team Capability
The quality of your compliance analytics — and the confidence you can place in your annual report — is entirely dependent on the quality of data entry at the point of inspection. An inspector who closes an outfall screening form without recording a visual observation, or who marks a BMP inspection complete without documenting sediment depth and drawdown time, creates a gap in the compliance record that no dashboard analytics can recover. The solution is not a compliance directive — it is understanding and motivation. Inspectors who understand why complete data entry matters — "this sediment depth record is what triggers the maintenance work order" or "this photograph is the evidence that closes the IDDE case" — log more accurately than those who see data entry as administrative overhead. Invest in short, role-specific training sessions that connect each field data point to the regulatory decision it supports. This is the highest-ROI activity in any compliance programme improvement initiative.
Action 04
Build a Tiered KPI Framework — Different Metrics for Field, Programme, and Management Levels
KPI Architecture
A single compliance dashboard shared across field inspectors, programme coordinators, and utility management serves no level well. Each role needs to see the metrics relevant to the decisions it makes. Field inspectors need today's outfall screening assignments, BMP inspection checklist with historical findings, and open corrective actions by location. Programme coordinators need inspection completion rates by MCM area, IDDE case status distribution, BMP maintenance adherence by asset class, and open audit findings with ages. Utility managers and directors need trend analytics — outfall screening completion trend over the permit cycle, pollutant load reduction trajectory against TMDL targets, cost-per-inspection and cost-per-BMP-maintained trends, and compliance finding recurrence rates. iFactory's platform supports tiered dashboard configuration, so each level of the utility sees the data layer that is actionable for their role — without being overwhelmed by data relevant only to other levels. This structural choice is what makes data-driven compliance programmes self-sustaining rather than manager-dependent.
Action 05
Celebrate Data-Identified Corrections — Reinforce the Behaviour You Want to Scale
Change Management
Culture shifts when utility managers visibly and consistently reinforce the behaviour they are trying to embed. When an inspector identifies a sediment accumulation trend in a detention basin during routine monitoring and the maintenance team schedules a cleanout before the next storm event — rather than after a complaint — that is a story worth telling at the next all-hands review. When a programme coordinator uses outfall screening trend data to redirect inspection resources to a catchment with rising illicit discharge probability and catches a cross-connection before it reaches the receiving water, that decision should be highlighted as an example of how the programme is evolving. Storytelling around data-identified corrections creates the social proof that makes adopting analytics-driven workflows feel safe — and turns early adopters into role models rather than outliers. Over time, the organisation shifts from asking "did we complete the inspections?" to asking "what did the inspection data tell us?"
Action 06
Review and Retire KPIs Annually — A Compliance Programme That Measures Everything Measures Nothing
Continuous Improvement
A data-driven compliance programme does not fix its KPIs at launch and track them unchanged across permit cycles. As the organisation's data maturity grows, the metrics that were meaningful at Stage 2 — basic inspection completion rates and outfall screening counts — become baseline expectations rather than active performance drivers. An annual KPI architecture review asks: which metrics are we tracking that no longer change behaviour? Which compliance decisions do we wish we had better data for? What patterns in this year's data suggest a new metric category we should monitor — such as BMP performance degradation rate by type, or cost-per-pound-of-pollutant-reduced trend by catchment? Organisations that evolve their KPI frameworks annually demonstrate that compliance analytics is a living operational discipline, not a reporting layer configured during implementation and never revisited. This annual review cycle is also the mechanism through which the utility builds the business case for infrastructure investment, rate adjustments, and programme budget increases.
The MS4 Compliance KPI Framework — What to Measure at Each Level
The following KPI taxonomy is grounded in the decision architecture principle: every metric connects to a decision, a decision-maker, and a response trigger. iFactory's compliance platform tracks all of these in real time, with configurable threshold alerts and trend visualisations configured per user role.
Field Inspector Level
Outfall screening assignments for current period — prioritised by risk tier and last inspection date
BMP inspection checklist with historical findings — previous sediment depth, drawdown time, and repair history accessible before field visit
Open corrective actions by location — outstanding items from previous inspections that require re-inspection or verification
Programme Coordinator Level
Inspection completion rate by MCM area — outfall screening, BMP inspection, construction site, and municipal facility inspection adherence percentages
IDDE case status distribution — cases opened, under investigation, source identified, eliminated, and pending verification by age category
BMP maintenance adherence by asset class — percentage of BMPs receiving maintenance within the interval defined by performance data rather than calendar schedule
Utility Manager Level
Outfall screening completion trend over permit cycle — is screening coverage improving, plateauing, or declining by catchment risk tier?
Pollutant load reduction trajectory against TMDL targets — modelled reduction progress with confidence intervals based on BMP performance data
Cost-per-inspection and cost-per-BMP-maintained trend — programme efficiency metric supporting budget requests and rate-setting justifications
Board / Council Level
Compliance finding recurrence rate — are the same types of audit findings appearing across consecutive reporting periods, indicating systemic vs. isolated issues?
Stormwater utility financial performance — revenue vs. expenditure trend with programme outcome correlation, supporting rate adjustment recommendations
Infrastructure condition index trend — system-wide BMP and conveyance condition trajectory, supporting capital planning and renewal cycle projections
"
We spent three years building out our MS4 compliance programme with field inspection apps, BMP tracking spreadsheets, and an annual report template that took six weeks to compile. At the end of year three, we had clean records and no measurable improvement in compliance outcomes. Inspections were still scheduled by calendar rather than risk. BMP maintenance was still reactive. IDDE cases were documented but not analysed for patterns. What changed the trajectory was when I, as Utility Manager, stopped reviewing compliance through email summaries and started opening the analytics dashboard at the start of every monthly programme review. I asked one question each meeting: what does the data tell us that we did not know last month? Within two quarters, our inspectors were flagging sediment accumulation trends before they became compliance issues. Within a year, we had rebuilt our BMP maintenance schedule around performance data rather than calendar months. Our last EPA audit closed with zero findings. The technology did not change the programme. I changed how we used it.
— Utility Manager, Mid-Atlantic Municipal Stormwater Programme — 14 Years Public Works and Compliance Management
Conclusion
The data-driven stormwater compliance programme that distinguishes audit-ready utilities from those cycling through inspection seasons with growing backlogs is not built by deploying monitoring technology — it is built by utility managers who change how they review compliance data, how they allocate inspection and maintenance resources, and how they connect field-level activity to regulatory outcomes. With 83% of stormwater utilities reporting persistent underfunding and MS4 permit requirements continuing to expand — from Pennsylvania's new Volume Management Plan requirements to California's standardised cost reporting mandates — the utilities that close the gap between compliance data and operational decision-making will outperform on every metric that matters: inspection adherence, BMP performance, IDDE resolution timelines, audit finding recurrence rates, and cost per pollutant load reduced. The platform makes it possible. The management discipline makes it real.
iFactory's stormwater compliance platform gives utility managers the operational data infrastructure to build an audit-ready programme — with tiered KPI visibility, real-time threshold alerting, trend analytics, automated annual report generation, and the decision architecture tools that keep your compliance programme grounded in operational reality rather than narrative reconstruction. Book a Demo to see how the platform's compliance analytics layer maps to your MS4 programme's decision architecture, or talk to an expert to begin building your data-driven compliance culture with iFactory today.
Frequently Asked Questions
iFactory's platform allows role-based dashboard configuration — each user level accesses a compliance data layer that surfaces the metrics relevant to their decision-making scope. Field inspectors see their assigned outfall screening and BMP inspection schedules, asset-specific historical findings, and open corrective actions. Programme coordinators see inspection completion rates by MCM area, IDDE case status distribution, and BMP maintenance adherence across the asset inventory. Utility managers see trend analytics across the full compliance programme — outfall screening completion trend over the permit cycle, pollutant load reduction trajectory, cost-per-inspection trends, and compliance finding recurrence rates. Threshold alerts are configured per KPI, so when a metric breaches a defined level — such as a BMP inspection becoming overdue — the responsible decision-maker receives a platform notification rather than discovering the gap during annual report compilation. Talk to an expert to configure your tiered compliance KPI framework and activate threshold alerting across your MS4 programme.
The most effective starting point is the decision architecture exercise — before configuring a single dashboard or importing inspection records, map the five to seven compliance decisions your utility makes most frequently and identify which of those decisions would change if the decision-maker had real-time, threshold-alerted data at their fingertips. Then configure iFactory to surface only the metrics that connect to those decisions, visible to the people who make them. Resist the temptation to track every data field available — a focused compliance dashboard of eight to ten decision-relevant KPIs drives more programme improvement than a comprehensive report of fifty metrics that nobody acts on. Run the first management-level KPI review session in the second week after go-live, not at the end of the first quarter. Early and consistent use at the utility manager level sets the expectation for everyone below it. Book a Demo to walk through the decision architecture process with our stormwater compliance team before your implementation begins.
iFactory captures BMP inspection data — including sediment depth, drawdown time, vegetation condition, and structural integrity observations — and uses configured thresholds to trigger maintenance workflows automatically. When an inspection record shows sediment accumulation approaching the design storage loss threshold, or drawdown time exceeding the design specification, the platform generates a maintenance work order assigned to the responsible crew with the priority level defined by the severity of the deviation. This transforms BMP maintenance from calendar-based scheduling to condition-based intervention. Over time, the platform builds a performance trend record for each BMP asset — showing whether drawdown times are stable, improving, or degrading across inspection cycles — giving programme coordinators and utility managers the data needed to prioritise capital replacement decisions and optimise maintenance interval frequency. Talk to an expert to configure condition-based maintenance triggers for your BMP asset inventory.
iFactory provides a structured IDDE case management workflow that tracks each illicit discharge from initial detection through source identification, elimination, and verification. The platform captures the location, date, observation type, and priority of each detection event; documents tracing and investigation steps with time-stamped case notes and photo evidence; tracks source identification and elimination actions with responsible party and method records; and records verification inspection outcomes to close the case with complete documentation. A dashboard view shows the status distribution of all open and closed IDDE cases, case resolution timelines by priority level, and detection source patterns by catchment area — giving programme coordinators the data needed to identify high-risk areas and adjust outfall screening priorities accordingly. Book a Demo to see the IDDE case management workflow configured for your MS4 programme's requirements.
83% of Stormwater Utilities Are Underfunded. The Data-Driven Ones Will Close the Compliance Gap First.
iFactory gives every level of your MS4 compliance programme the right data, at the right time, in the right format — and gives utility managers the analytics infrastructure to build a culture where data-based compliance decisions are the norm, not the exception.