The United States inland waterways system moves $158 billion in goods annually — 465 million tons of agricultural products, energy commodities, construction materials, and manufactured goods that travel through 12,000 miles of commercially navigable channels, 193 lock sites, and 239 lock chambers operated by the U.S. Army Corps of Engineers. One barge carries the equivalent of 70 tractor trailers, making the inland waterway system the most cost-effective and fuel-efficient freight corridor in the nation. But 80% of that lock and dam infrastructure has already exceeded its original 50-year design life. The average vessel delay caused by aging lock equipment is 172 minutes per transit. The construction backlog stands at $7.5 billion. For the operations directors and infrastructure managers responsible for navigation channel, lock, and dam asset programmes — the challenge is not whether the system needs investment. The question is whether you have the asset management data to prioritise the right investments across a portfolio where every structure is beyond its design life and the consequences of getting the priority order wrong are measured in disrupted supply chains, delayed commodity shipments, and missed USACE compliance milestones.
Eighty Percent of America's Locks Are Past Their Design Life. The Question Is Which One Will Fail First.
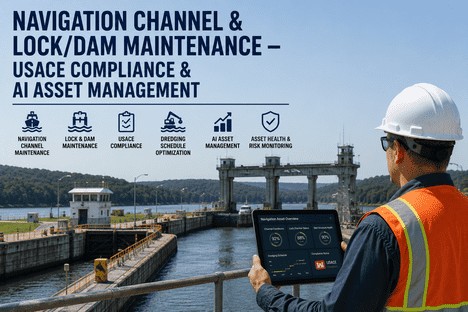
iFactory's navigation infrastructure module gives operations directors a unified asset management platform for locks, dams, and channels — with AI-driven condition assessment, dredging schedule optimisation, USACE compliance tracking, and rehabilitation priority scoring across every structure in your portfolio.
of USACE lock and dam infrastructure has exceeded its original 50-year design life — the average chamber was built in 1955 and is operating with components that have never been replaced to original specification
172 min
average delay per vessel transit caused by aging lock equipment and mechanical failures — delays that compound across 12,000 miles of channel and 239 lock chambers nationwide
$7.5B
construction backlog for inland waterways infrastructure — the gap between what is funded and what is needed to restore the system to reliable operating condition
The Navigation Infrastructure Asset Management Problem — Three Failure Points That Calendar-Based Programmes Cannot Catch
The challenge of managing navigation channels, locks, and dams is fundamentally different from managing a single marine structure at a single location. A navigation system is a linear asset — 12,000 miles of channel, dozens of lock sites, hundreds of individual structures, each with its own deterioration rate, each affecting the operational availability of the entire system. A lock closure on the upper Mississippi does not just delay traffic at that one chamber. It creates a queue that propagates upstream and downstream, disrupting schedules at every port and terminal connected to the system. The ASCE gave U.S. inland waterways a grade of C- in 2025 — the lowest of any transportation infrastructure category. The three failure points below explain why traditional maintenance management approaches cannot keep up.
1
Failure Point One
The Lock Chamber Data Gap — Miter Gate, Valve, and Mechanical System Deterioration That Inspections Miss
A navigation lock is a complex electromechanical system — miter gates, culvert valves, hydraulic systems, electrical controls, and structural concrete all deteriorate at different rates, under different loading conditions, and with different failure consequences. The miter gate, for example, experiences cyclic loading from water pressure differentials every time the chamber fills and empties — typically 20 to 40 cycles per day on a busy waterway. Over decades, this cyclic loading produces fatigue cracking at weld joints, hinge pin wear, and gate misalignment that increases operating forces and accelerates seal degradation. Traditional lock maintenance programmes rely on periodic visual inspections and scheduled component replacements based on calendar intervals derived from the original design assumptions. But the actual deterioration rate of each component depends on the specific traffic volume, water chemistry, sediment load, and operating regime at that particular lock — which means a calendar-based replacement programme inevitably replaces some components too early and others too late. iFactory closes this gap by registering every lock component in a digital asset register with its own condition history, inspection schedule, and degradation trend — enabling condition-based maintenance decisions rather than calendar-driven guesses. Talk to an expert about configuring lock asset registers for your navigation portfolio.
Cyclic fatigue tracking per gate
Condition-based component replacement
Digital asset register with degradation trends
2
Failure Point Two
Channel Shoaling and Dredging Optimisation — The Cost of Dredging on a Schedule Instead of a Condition
Navigation channel maintenance dredging is one of the largest recurring cost items in any USACE operations budget. But the vast majority of dredging programmes operate on fixed schedules or reactive cycles — dredging a reach when it becomes a bottleneck rather than when sediment accumulation reaches a predictive threshold. Sedimentation in navigation channels is not uniform. It depends on river flow velocity, tributary sediment input, seasonal flood events, and the interaction between the channel and upstream dam operations. Some reaches may accumulate 12 months of sediment in a single spring flood event. Others may not require dredging for several years. A schedule-based dredging programme either spends money too early on reaches that do not need it or too late on reaches that have already become critical. iFactory's dredging optimisation module integrates bathymetric survey data, river flow records, sediment transport models, and vessel traffic data to calculate the optimal dredging timing for each reach — balancing the cost of dredging against the cost of vessel delay, and producing a prioritised dredging schedule that targets budget where it delivers the greatest navigability return. Book a demo to see how the platform optimises dredging schedules for multi-reach waterway systems.
Bathymetric trend analysis per reach
Sediment accumulation forecasting
Dredging cost vs delay cost balancing
3
Failure Point Three
USACE Compliance and Reporting Complexity — Meeting Federal Documentation Standards With Disconnected Data
USACE requires comprehensive documentation of all navigation infrastructure inspections, condition assessments, maintenance actions, and budget justifications — and the reporting standard is not optional. Operations directors managing portfolios that cross multiple USACE districts face the challenge of compiling inspection data from different contractors, using different survey methodologies, with different reporting formats, into a single compliance-ready record for each structure. When a USACE district engineer requests the condition history for a specific lock chamber or channel reach, the operations director should be able to produce a complete digital record — from the original as-built specifications through every inspection cycle, every maintenance action, every condition assessment, and every budget request. iFactory's USACE compliance module structures every data point to meet federal documentation standards from the point of entry — so the condition history for any structure in the portfolio is always inspection-ready, always audit-ready, and always budget-justification-ready. Talk to an expert to see how iFactory maps to USACE documentation requirements for your portfolio.
A 1930s Lock Running on a 1950s Inspection Schedule with 2020s Budget Pressure. That Is Not Sustainable. iFactory Makes It Manageable.
Every lock, every dam, every channel reach registered in a single digital platform — with condition trends, maintenance history, compliance records, and priority scoring that turns infrastructure data into investment decisions.
What iFactory's Navigation Infrastructure Module Actually Does
iFactory is not a spreadsheet replacement. It is not a document management system for PDF inspection reports. It is an asset lifecycle platform where every navigation structure — every lock chamber, every dam section, every channel reach — is registered with its full specification, condition history, maintenance record, and compliance documentation, linked by a common data model that allows operations directors to compare condition across asset types, prioritise investment across portfolios, and produce USACE-ready documentation from a single source of truth.
Capability 01
Lock and Dam Condition Assessment — From Miter Gates to Culvert Valves, Every Component Tracked With AI Degradation Analysis
AI Condition Analytics
iFactory's lock and dam condition module breaks each structure down into its component systems — miter gates, tainter gates, culvert valves, hydraulic power units, electrical control systems, concrete monoliths, and foundation elements — each with its own condition indicator set, inspection schedule, and degradation model. When an inspection report is uploaded, the AI engine compares the measured condition of each component against its baseline and historical trend, flags any component where the degradation rate has accelerated beyond the expected envelope, and projects the remaining useful life based on the actual measured deterioration curve — not the generic design life assumption from the original specification. The result is a lock condition dashboard that shows the operations director exactly which components at which locks are approaching their replacement threshold, ranked by the impact of failure on navigation traffic, so capital investment can be directed to the components that matter most to system reliability. Book a demo to see the lock component condition dashboard configured for your specific lock types.
Component-level degradation tracking
Traffic-impact-ranked replacement priority
Remaining useful life projection per component
Capability 02
Channel Navigation Performance Monitoring — Dredging Priority, Shoaling Trends, and Depth Assurance Across Every Reach
Dredging Optimisation
The channel monitoring module in iFactory ingests bathymetric survey data from every navigation reach and plots it against the authorised channel depth and width for that segment. The AI engine calculates the rate of shoaling for each reach based on successive survey comparisons, segmented by river mile, to identify which sections are accumulating sediment faster than the channel's design dredging interval. When a reach is projected to lose authorised depth within the next planning cycle, the platform generates a dredging alert with the specific location, the calculated shoaling rate, and the recommended dredging volume. The operations director sees a channel condition map colour-coded by dredging urgency — green for within tolerance, amber for approaching minimum depth, red for critical — updated with every new bathymetric survey upload. The same module integrates with USACE channel depth reporting requirements, generating the documentation needed for federal navigation status reports without manual compilation. Talk to an expert about configuring channel monitoring for your navigation system.
Reach-by-reach shoaling rate analysis
Authorised depth compliance tracking
Automated USACE channel status reports
Capability 03
Infrastructure Rehabilitation Priority Scoring — Rank Every Structure and Component by the Same Objective Criteria
Capital Planning Intelligence
Every operations director managing a navigation infrastructure portfolio faces the same annual budget challenge: the list of required rehabilitation projects exceeds the available funding by a factor of three to five, and every project sponsor believes their project is the highest priority. iFactory replaces opinion-based capital planning with objective priority scoring. The platform calculates a composite score for each asset based on measured condition relative to threshold, remaining useful life, consequence of failure measured in traffic delay cost, regulatory compliance status, and safety risk classification. The assets with the highest composite score appear at the top of the rehabilitation queue — not because their manager submitted the most compelling budget narrative, but because the data demonstrates they represent the highest risk to navigation system performance. The priority scoring framework is transparent, auditable, and configurable to each portfolio's specific risk tolerance and budget constraints. Over time, the accumulated condition data allows the operations director to demonstrate to funding authorities that every dollar was allocated to the asset that needed it most — a critical capability when competing for USACE appropriations and IIJA programme funding. Book a demo to configure the priority scoring framework for your navigation asset portfolio.
Multi-factor composite priority scoring
Failure consequence in traffic delay cost
Audit-ready capital allocation justification
Capability 04
USACE Compliance Documentation — Every Inspection, Every Assessment, Every Action Registered to Federal Standards
Regulatory Compliance
USACE navigation infrastructure management requires rigorous documentation at every stage of the asset lifecycle — from initial condition surveys through routine inspections, maintenance actions, major rehabilitation projects, and ongoing condition monitoring. Each documentation requirement has a specific format, submission timeline, and approval workflow. iFactory's compliance module structures every data entry to meet USACE documentation standards from the moment it is recorded, eliminating the need for retrospective format conversion when a report is requested. The platform maintains a complete audit trail for every asset — who inspected it, when, using what method, what they found, what action was taken, and what the updated condition assessment is — all linked to the asset's digital record and accessible through a single interface. For operations directors managing portfolios across multiple USACE districts, the compliance module offers district-specific documentation templates and reporting workflows that adapt to each district's requirements without duplicating data entry. Talk to an expert to review your current USACE compliance workflow and see how iFactory streamlines the documentation process.
USACE-standard documentation templates
Full audit trail per asset lifecycle event
Multi-district documentation workflow
Traditional vs AI-Driven Navigation Infrastructure Management — How the Approach Changes the Outcome
Management Domain
Traditional Calendar-Based Approach
iFactory AI-Driven Approach
Lock Component Maintenance
Fixed-interval replacement based on OEM guidelines — components replaced too early or too late depending on actual operating conditions
Condition-based replacement triggered by measured degradation rate, remaining useful life projection, and traffic impact analysis per component
Dredging Schedule
Fixed seasonal cycle or reactive dredging when channel becomes critical — premium cost for emergency dredging mobilisation
Predictive dredging timing based on shoaling rate trends, sediment transport modelling, and cost optimisation balancing dredging vs delay costs
Capital Prioritisation
Annual budget cycle driven by individual project submissions — priority determined by most compelling narrative rather than objective condition data
Data-driven priority scoring across all assets based on condition, remaining life, failure consequence, and compliance status — auditable and repeatable
USACE Compliance Reporting
Manual compilation of inspection reports, maintenance records, and condition data when a compliance submission is required — takes days per structure
Real-time compliance dashboard with complete audit trail for every asset — USACE-ready documentation generated on demand from linked data records
"
I manage the asset programme for a navigation system that includes 14 lock chambers and 200 miles of channel across three USACE districts. When I arrived, the condition data for each lock lived in a different filing system — some in paper binders, some in contractor PDFs, some in a legacy database that nobody knew how to query. Every budget cycle, I had to assemble a condition summary by calling each lockmaster and asking what they thought needed repair, then cross-referencing with whatever inspection reports I could find. The first time I used iFactory to generate the annual condition report, I sat down, opened the platform, and had every lock's component condition, inspection history, and maintenance record in a single view. The priority scoring flagged a miter gate at one lock that I would not have identified through the traditional process — the inspection report had noted minor corrosion, but the trend analysis showed the degradation rate had doubled in the last two cycles. We replaced it during a scheduled closure instead of during an emergency shutdown six months later. That one flag saved approximately 14 days of unplanned outage time.
The United States navigation infrastructure system is a national economic asset that moves $158 billion in goods annually through a network where 80% of lock and dam structures have exceeded their 50-year design life. The $7.5 billion construction backlog, the 172-minute average vessel delay, and the C- grade from ASCE are not abstract statistics — they are the measurable consequences of an asset management approach that has not kept pace with the deterioration rate of the infrastructure it is supposed to protect. Calendar-based inspection programmes, disconnected data systems, and opinion-based capital prioritisation cannot deliver the reliability that the nation's supply chains depend on. The only way to close the gap between available funding and required investment is to allocate every dollar to the asset that needs it most — and the only way to know which asset that is, is to have continuous condition data across every lock, every dam, and every channel reach in your portfolio.
iFactory's navigation infrastructure module gives operations directors a single platform that connects every structure's condition data to every investment decision — with AI-driven degradation analysis, dredging optimisation, objective priority scoring, and USACE-compliant documentation that turns infrastructure data into capital allocation decisions. The platform does not replace engineering judgment. It replaces the guesswork between inspections with continuous visibility. Book a demo to see how iFactory maps to your navigation asset portfolio, or talk to an expert about configuring AI-driven condition assessment for your locks, dams, and channels.
Frequently Asked Questions
Yes. iFactory is designed to integrate with existing inspection programmes rather than replace them. The platform accepts data from any inspection methodology — diver surveys, structural concrete assessments, miter gate ultrasonic thickness measurements, hydraulic system performance tests, electrical system thermography, and cathodic protection surveys — through standardised import templates that map contractor data to the asset register. For USACE districts that use standardised inspection reporting formats, iFactory can be configured to accept data directly in those formats, eliminating the need for contractors to adapt to a new reporting system. The platform also supports manual data entry for smaller inspection programmes or legacy records that exist only in paper or PDF format. The goal is to centralise all inspection data — regardless of source — into a single condition record for each asset, so the operations director has a complete picture without requiring every contractor to use the same system. Talk to an expert to review your current inspection data sources and map the integration approach.
The dredging optimisation module uses a hybrid modelling approach that combines measured bathymetric data with sediment transport modelling based on local river conditions. For each reach, the module ingests successive multibeam or single-beam bathymetric surveys to calculate the actual measured shoaling rate — not a theoretical rate from a sediment transport model. These measured rates are then correlated with river flow data from USGS gauging stations, upstream dam release schedules, and known tributary sediment input points to distinguish between chronic sedimentation patterns and event-driven deposition from flood events. The module also accounts for sediment type — sand, silt, clay, or mixed — because each type has different dredging cost profiles, different disposal requirements, and different rates of re-sedimentation after dredging. The optimisation engine then runs a cost comparison for each reach: the cost of dredging at different times during the year versus the cost of vessel delay if the reach loses authorised depth. The recommended dredging schedule is the one that minimises the combined cost of dredging and delay across the entire waterway system, accounting for interdependencies between reaches — dredging one reach earlier than optimal to align contractor mobilisation with an adjacent reach that has reached its threshold. Book a demo to see how the optimisation engine applies to your specific waterway configuration.
Yes. iFactory's reporting module generates condition summaries, priority rankings, and investment justifications in formats compatible with USACE budget submission requirements and IIJA programme reporting standards. The platform produces asset-level condition reports that include the inspection history, degradation trend, remaining useful life projection, risk classification, and recommended intervention timing for every structure in the portfolio — exactly the data required to justify a budget request for a specific lock rehabilitation or channel dredging programme. The reports can be generated at the portfolio level, the district level, or the individual asset level, depending on the submission requirement. For IIJA-funded projects, the platform tracks expenditure against programme milestones and generates the progress documentation required for federal reporting. This capability eliminates the manual condition summary compilation that typically consumes weeks of staff time during each budget cycle. Talk to an expert to see examples of USACE-compatible budget documentation generated from the platform.
For a navigation portfolio covering multiple districts with multiple lock and dam structures, iFactory's standard implementation sequence covers: weeks one to three for asset register configuration — defining the digital model for each lock type, dam type, and channel reach in the portfolio, including component hierarchies, condition indicators, and inspection schedules; weeks four to eight for historical data ingestion — importing as-built specifications, past inspection reports, maintenance records, and condition assessments from existing filing systems into the asset register; weeks nine to twelve for compliance workflow configuration — setting up USACE district-specific documentation templates, approval workflows, and reporting schedules; and weeks thirteen to fourteen for operations director and team training. The first condition dashboard is typically available for review within thirty days of project start, based on the initial asset register configuration and available historical data. Full portfolio deployment with all historical records ingested and compliance workflows active typically completes within fourteen weeks for a portfolio of up to thirty lock and dam structures across multiple districts. Book a demo to build the implementation plan specific to your navigation portfolio's structure count, data availability, and USACE district configuration.
80% Past Design Life. $7.5B Backlog. One Platform to Make Every Dollar Count.
iFactory's navigation infrastructure module — AI-driven condition assessment, dredging optimisation, priority scoring, and USACE-compliant documentation. The asset management platform your navigation system has been missing.