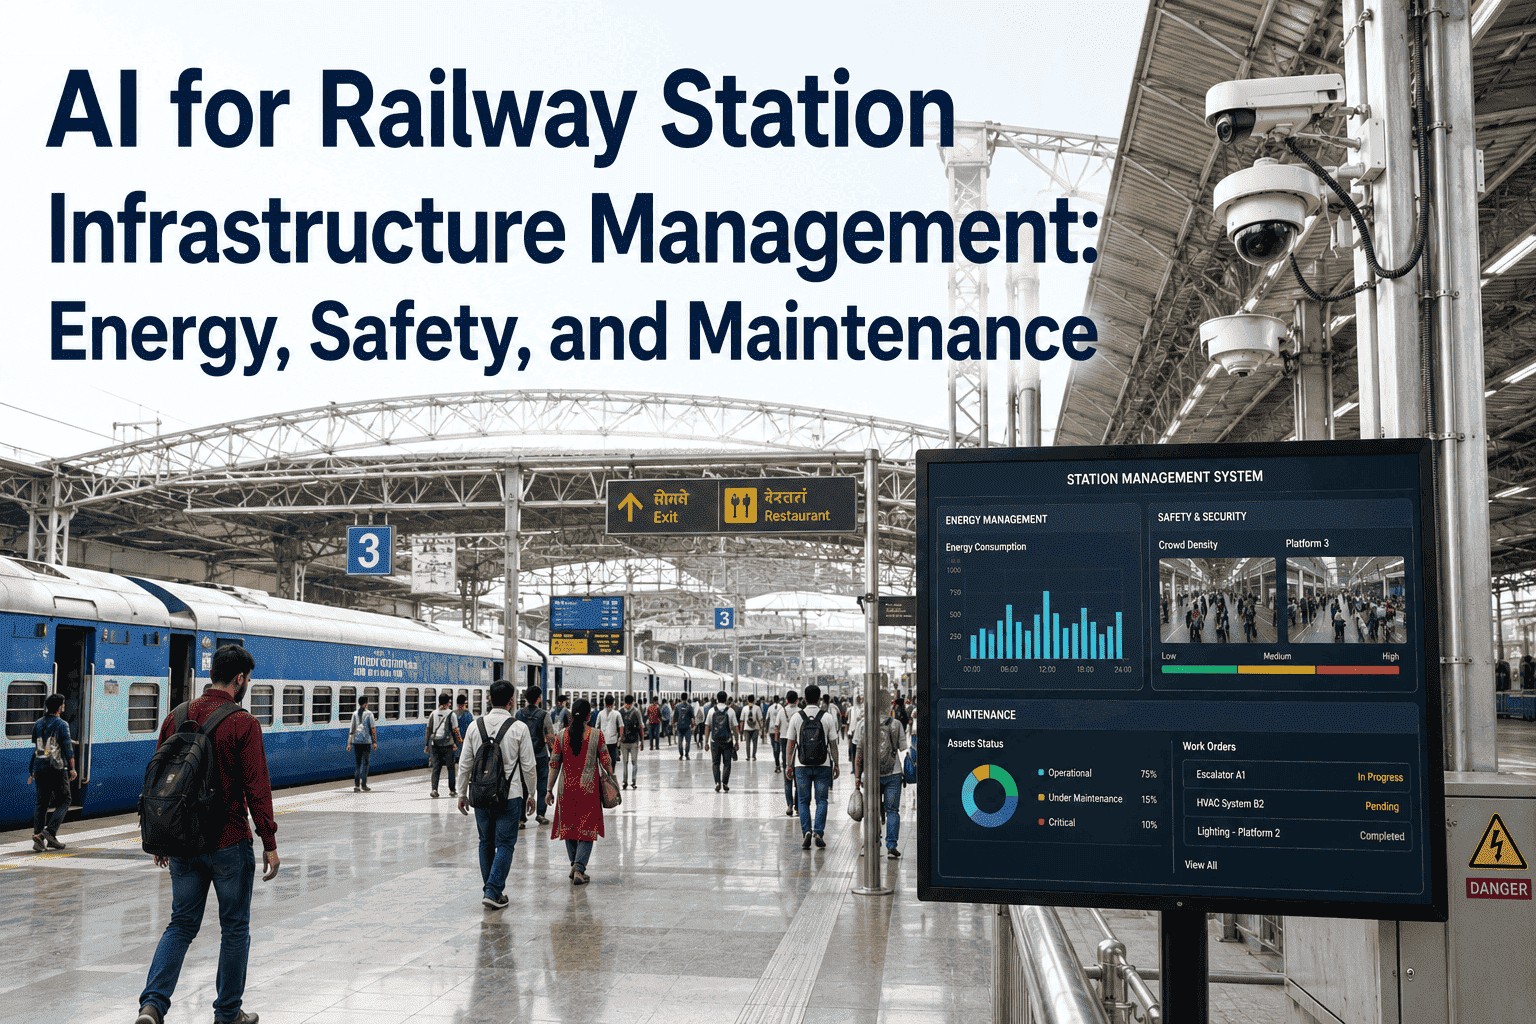
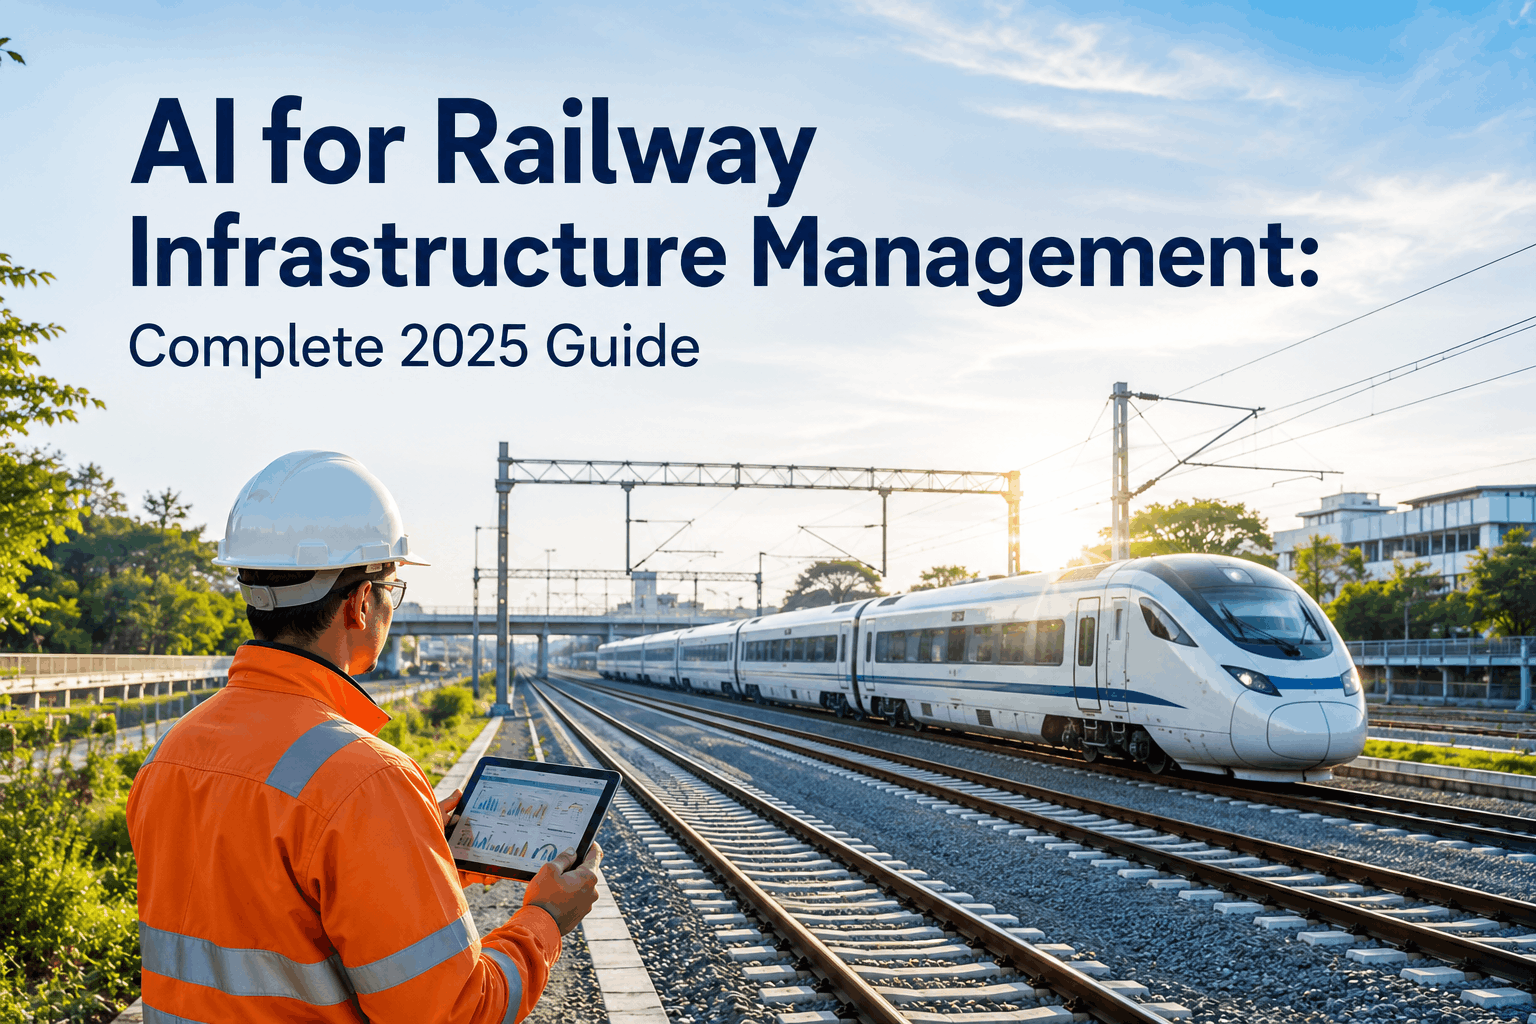
Railway stations are among the most operationally complex physical assets in modern infrastructure. A major hub handles tens of thousands of passengers daily, consumes as much electricity as a small town, runs dozens of interdependent safety systems, and depends on continuous maintenance of platforms, escalators, lifts, HVAC, lighting, and structural elements — all simultaneously, all without disrupting live operations. For decades, managing this complexity meant reactive work orders, scheduled inspections on fixed cycles, and energy managed by building management systems that responded to conditions rather than predicting them. AI changes the operating model entirely. By integrating real-time data from sensors, cameras, ticketing systems, and asset histories into unified predictive models, AI platforms enable station operators to manage energy, crowd safety, and maintenance not as separate functions, but as one connected intelligence layer across every square metre of the station.
Energy · Crowd Safety · Predictive Maintenance · Asset Intelligence
Your Station Generates Data Constantly. AI Turns It Into Decisions.
iFactory's infrastructure AI platform connects your station's sensor data, maintenance records, and operational history into predictive models that tell you what's about to fail, where energy is being wasted, and when crowd density becomes a safety risk — before any of those events occur.
18.1%
CAGR of the global railway AI market to 2029
25%
Cost savings achieved by European operators using AI predictive maintenance
10–15%
Energy savings delivered by AI-optimised driving and station systems
30%
Reduction in train breakdowns estimated from AI predictive maintenance deployment
Three Problems, One AI Platform: What Station Infrastructure AI Actually Manages
AI doesn't manage a railway station by running three separate tools. The most effective deployments integrate energy, safety, and maintenance data into a single continuous model — because these systems are physically interconnected. A platform overcrowding event changes HVAC load. A lift failure changes crowd routing. An energy anomaly can signal equipment degradation. The AI sees all three at once.
Pillar 01
Energy Management
Station energy consumption follows predictable occupancy patterns — but traditional building management systems respond to those patterns after the fact. AI models trained on historical occupancy, timetable data, weather forecasts, and real-time sensor feeds predict load 30–120 minutes ahead, dynamically adjusting HVAC, lighting zones, escalator speed, and platform heating before demand shifts.
Predictive load scheduling reduces peak demand charges
Zone-level lighting and HVAC tied to real-time occupancy
Anomaly detection flags energy waste from equipment faults
Regenerative braking capture optimised at network level
Crowd-related safety incidents don't begin the moment a platform becomes dangerously dense — they begin 8–15 minutes earlier, when flow patterns change and density gradients start building. AI trained on ticket gate data, camera feeds, and historical incident records identifies these early signatures and triggers operational responses — gate holds, PA announcements, staff deployment — while there is still time to act.
Platform density monitoring with early-warning thresholds
Automated alerts for control room and platform staff
Bottleneck prediction at concourse and interchange points
Incident pattern learning from historical crowd data
Pillar 03
Predictive Maintenance
Fixed-schedule maintenance programmes treat all assets equally regardless of condition. AI maintenance models monitor each asset individually — escalators, lifts, platform edge doors, signalling equipment, drainage systems, structural sensors — and predict failure probability based on actual operating data, load history, age, and environmental factors. The result is intervention precisely when needed, not when the calendar says.
Failure probability scoring per asset, updated continuously
Maintenance window scheduling aligned with off-peak periods
Cost savings of 20–30% versus reactive maintenance programmes
Asset lifespan extension through optimised intervention timing
How the Data Flows: From Station Sensor to Operational Decision
An AI station management platform works by connecting data sources that previously operated in silos — and applying models that learn cross-domain patterns no human analyst could extract manually. The flow from raw data to actionable decision happens across four layers.
AI Data Flow Architecture — Railway Station Infrastructure
1
Sensor and Data Ingestion Layer
IoT sensors on escalators, lifts, HVAC, and structural elements
Smart meters and sub-metering across energy circuits
CCTV and platform camera feeds for occupancy counting
Ticket gate throughput and real-time timetable data
2
Feature Engineering and Pattern Detection
Raw sensor readings are processed into engineered features: vibration spectral analysis for mechanical fault signatures; occupancy gradients and flow velocity vectors for crowd risk; energy consumption per zone normalised against occupancy and weather; maintenance history and intervention effectiveness scores. This layer transforms data into signals the ML models can learn from — separating meaningful degradation patterns from routine operational noise.
3
Prediction Models — Domain-Specific AI
Energy Models
LSTM and gradient-boosting models predict load 30–120 min ahead per zone, feeding the automated control layer with pre-emptive adjustment schedules
Crowd Models
Computer vision and flow prediction models identify density build-up trajectories 8–15 minutes ahead of threshold breach, enabling pre-emptive crowd management
Asset Health Models
Random Forest and neural net models score failure probability for each asset continuously, projecting maintenance windows based on actual degradation rate
4
Operational Decision Output
Automated energy control adjustments with override audit trail
Crowd risk alerts to control room and platform staff
Prioritised maintenance work orders with failure risk scores
Dashboard reporting for operations, maintenance, and capital planning teams
Energy Management in Detail: What AI Sees That BMS Systems Miss
Station energy management is not a simple automation problem. A conventional Building Management System (BMS) applies rule-based logic: if temperature exceeds X, increase HVAC. If occupancy drops, dim lighting. AI operates on a fundamentally different principle — it predicts what is about to happen and prepares for it, rather than reacting to what has already occurred.
Conventional BMS Approach
Responds to conditions after they occur — temperature rise triggers cooling, not anticipated
Manages by zone floor plan, not by actual occupancy distribution at any given time
Cannot correlate energy anomalies with equipment degradation signatures
Uses fixed daily schedules that don't adapt to disruption, service changes, or weather
AI Platform Approach
Anticipates load changes from timetable, weather forecast, and real-time gate throughput — adjusts HVAC and lighting 30–120 minutes ahead
Deploys fine-grained zone control based on actual camera-verified occupancy at sub-platform level
Flags consumption anomalies as early maintenance indicators — a motor drawing 12% above baseline can signal bearing wear weeks before failure
Adapts in real time to disruption events — delayed trains, major events, unplanned service changes — automatically
Energy · Crowd Safety · Asset Health
How Much Energy Is Your Station Wasting Right Now?
iFactory builds AI models from your existing station data — meter readings, maintenance records, timetable feeds — to identify energy waste, predict asset failures, and flag crowd risk before it becomes an incident. Book a Demo to see what the model shows on your data.
Crowd Safety: Why Real-Time Monitoring Is Not Enough
The operational window available to prevent a dangerous crowd density event is determined by how far ahead it can be detected. Real-time monitoring tells you what is happening now — by which point options have narrowed to reactive crowd control. Predictive AI tells you what is about to happen, giving operators 8–15 minutes of lead time to intervene while options remain broad.
Crowd Risk Response Window — From Pattern Detection to Incident Prevention
T
T − 15 min
AI detects early signature
Gate throughput velocity increases. Camera flow vectors begin converging toward platform 4. Timetable shows delayed train + arriving service. AI flags elevated density trajectory.
A
T − 10 min
Alert issued to operations
Control room receives crowd risk alert with density projection. Staff deployment options presented. Gate metering or PA redirection available. Decision made with 10 minutes to spare.
R
T − 5 min
Intervention deployed
Gate metering activated. Passengers directed to adjacent platform via PA. Staff positioned at pinch points. Density peak absorbed across two platforms instead of one.
O
T + 0 min
Train arrives safely
Passenger flow managed. No dangerous density event. Without AI: control room would have observed the problem as it developed — with no time to do more than react.
The UK government's £58m investment in AI rail innovation specifically included AI-based crowd monitoring programmes — recognising that the predictive window is the entire safety advantage of AI over conventional monitoring.
Station Asset Categories and What AI Monitors on Each
Every category of station asset has a distinct failure signature — the combination of sensor readings, operating patterns, and environmental conditions that precede a fault. AI models learn these signatures from historical failures and apply them continuously to each individual asset, producing a failure probability score updated in real time.
| Asset Category |
Key Failure Modes |
AI Monitoring Inputs |
Warning Lead Time |
| Escalators |
Motor bearing wear, step chain elongation, handrail drive slip |
Vibration spectrum, motor current draw, step chain tension sensors, run hours |
2–6 weeks ahead of failure |
| Passenger Lifts |
Door mechanism faults, rope/belt wear, hydraulic pressure loss, controller faults |
Door cycle count and timing, load cell, hydraulic pressure, motor thermal data |
1–4 weeks ahead of failure |
| HVAC Systems |
Coil fouling, refrigerant loss, fan bearing degradation, filter blockage |
Energy consumption vs output, delta-T performance, motor current, run-time cycles |
3–8 weeks ahead of degraded performance |
| Platform Edge Doors |
Door alignment drift, drive mechanism wear, sensor obstruction, controller faults |
Open/close cycle timing variance, motor current, sensor fault log frequency, door gap data |
1–3 weeks ahead of service-impacting fault |
| Drainage and Trackbed |
Blockage accumulation, pump failure, sub-platform flooding risk |
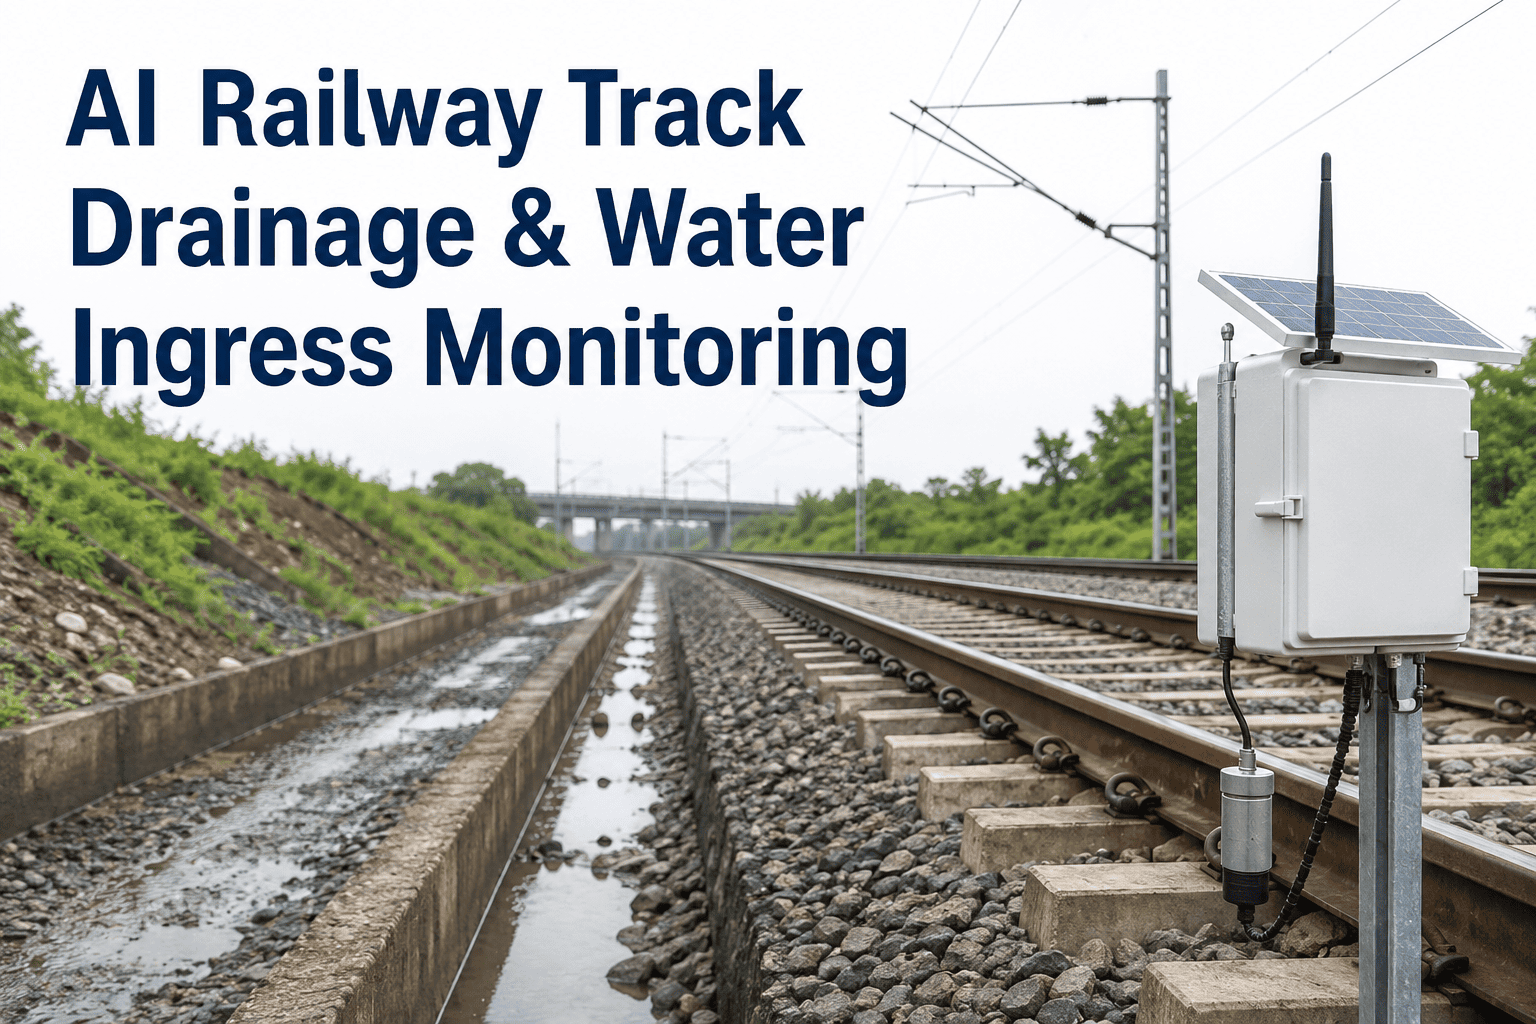
Flow rate sensors, pump run hours and duty cycles, rainfall correlation, sump level data |
Days to weeks, depending on event type |
Operational Outcomes: What Changes When AI Manages the Station
The measurable outcomes from integrated AI station management are consistent across published research and operational deployments. They span cost, safety, passenger experience, and capital efficiency simultaneously.
20–30%
Maintenance cost reduction
From reactive to predictive: eliminating emergency call-out costs, reducing overnight emergency possessions, and extending asset life through timely intervention.
10–15%
Station energy reduction
Predictive load management, occupancy-responsive zone control, and equipment anomaly detection eliminate the two largest sources of energy waste: over-conditioning and degraded equipment.
30–50%
Downtime reduction
Assets repaired before failure rather than after — eliminating the passenger impact, reputational cost, and emergency mobilisation expense of unplanned out-of-service events.
€700M+
Annual value for a €5B rail company
McKinsey / UIC modelling for a major rail operator shows AI-enabled improvements across maintenance, energy, capacity, and labour generating this total annual value.
25%
Cost savings in European deployments
European rail operators running AI predictive maintenance programmes report consistent 25% cost reductions through reduced downtime and optimised maintenance scheduling.
8–15 min
Crowd safety lead time
The operational window AI creates between pattern detection and threshold breach — the difference between prevention and reactive crowd control under pressure.
"
We had three escalator failures in a single month before the AI platform went live. All three had weeks of warning in the sensor data — we just weren't reading it. Once the model was trained, we caught the next fault 19 days before it would have failed in service. The cost of that one prevented failure — avoided emergency contractor, avoided out-of-service day, avoided the regulator notification — paid for the platform deployment. Everything after that is savings.
— Head of Stations Engineering, Regional Rail Infrastructure Manager — 16 Years Mechanical Asset Management
Conclusion
Railway stations are data-rich environments where energy waste, crowd safety risks, and asset degradation are all visible in the data long before they become operational problems. The gap between knowing and acting has historically been a technology gap: no platform capable of integrating sensor feeds, maintenance records, and occupancy data into a single predictive model that drives operational decisions. That gap has closed. AI platforms now exist that manage all three domains from a unified data architecture — shifting station operations from reactive management to continuous condition-aware intelligence.
iFactory's infrastructure AI platform applies machine learning to your station's existing operational data — energy meters, maintenance records, sensor feeds, timetable data — to build predictive models for energy, crowd safety, and asset health. Book a Demo to see what the model identifies on your station data, or Get In Touch to begin the data onboarding process.
Frequently Asked Questions
Your station's next escalator failure, energy spike, and crowd risk event are already in the data. The question is whether you're reading it.
iFactory builds AI models from your existing station operational data — delivering predictive maintenance, energy optimisation, and crowd safety intelligence from a single platform. Book a Demo to run the models on your data.