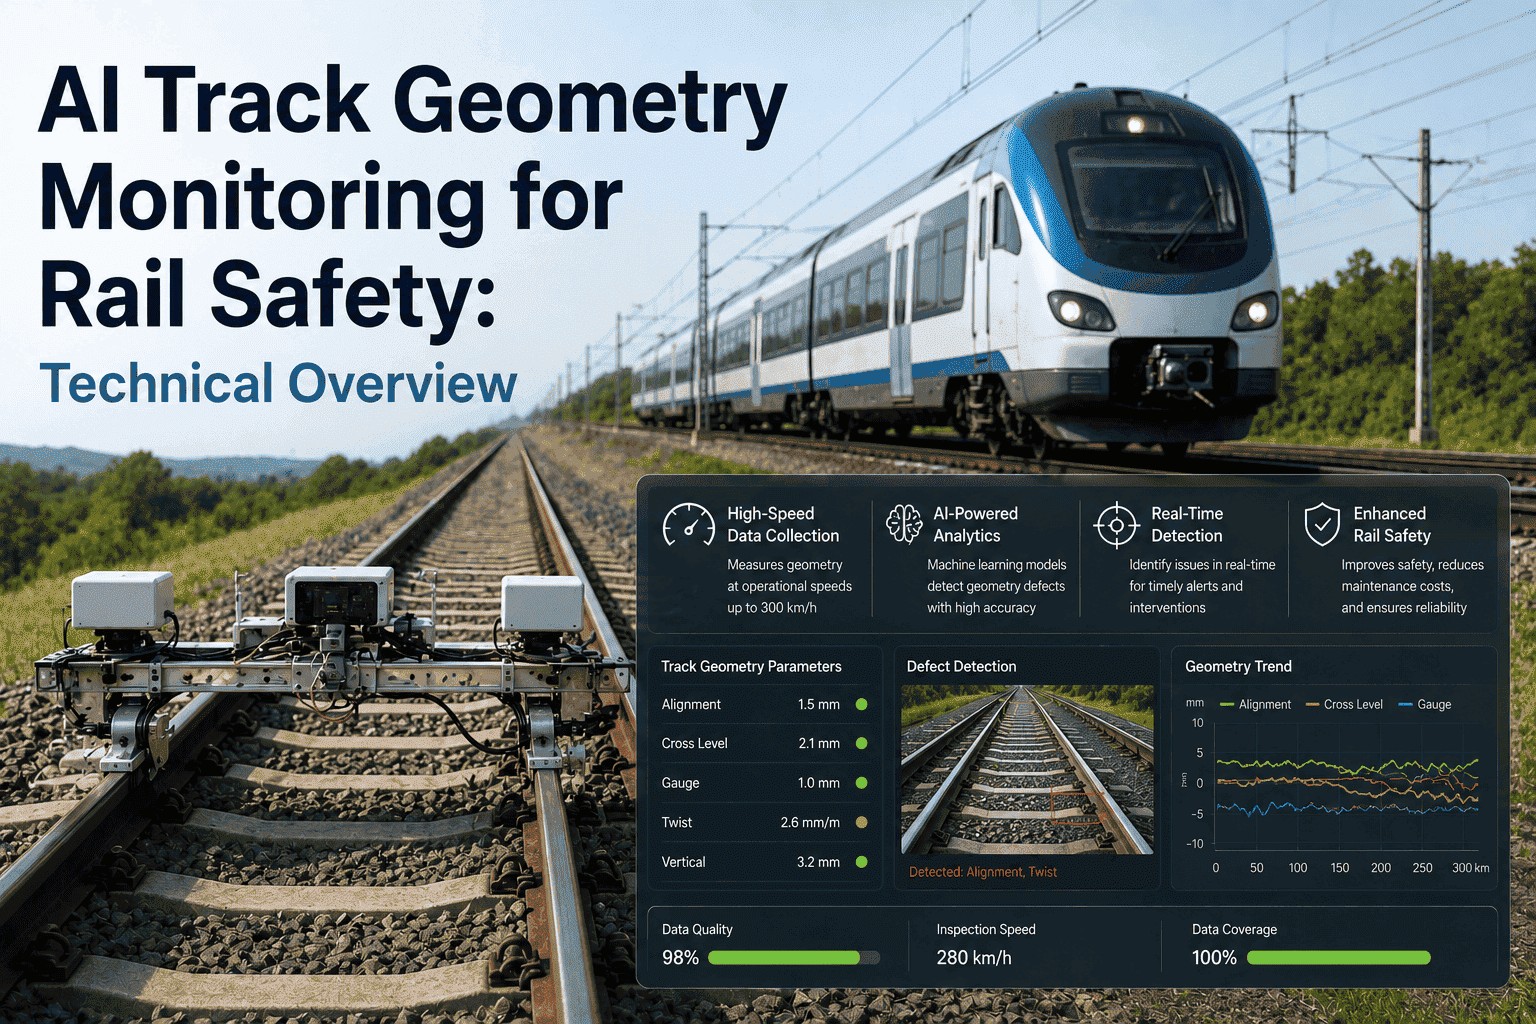
A derailment does not begin with a catastrophic failure. It begins with a millimetre. A gauge that has widened by 3mm over six months. A cant deviation accumulating under heavy freight load. A twist developing in a curve section that no manual inspection visit caught because the last survey was four months ago. By the time the problem is visible to the naked eye, the track has already crossed the intervention limit — and the cost has shifted from a tamping run to an emergency shutdown. AI track geometry monitoring detects that millimetre at operational speed, scores it against safety thresholds, and puts a prioritised work order in front of the maintenance team before the deviation ever becomes a risk. This is how the technology works — end to end.
Sensors · ML Models · Geometry Scoring · Safety Thresholds · Automated Maintenance
Every Millimetre Matters. AI Catches What Quarterly Surveys Miss — at Full Operational Speed.
iFactory's rail AI platform continuously monitors track geometry parameters, scores each segment against EN 13848 safety limits, and dispatches maintenance work orders before deviations reach intervention thresholds.
34%
of all rail derailments traced to track geometry defects (FRA)
75%
reduction in manual inspection cost with automated systems
150K+
miles measured in a single year by sensor-equipped locomotives
£20M+
annual savings documented in European AI track inspection deployments
The Six Geometry Parameters That Define Track Safety
Track geometry is not a single measurement — it is a family of six interdependent parameters, each with its own failure mode, deterioration rate, and safety limit under EN 13848. AI monitoring tracks all six continuously and detects compound deviations that manual inspections, taken in isolation, routinely miss.
01 — Gauge
Distance Between Rails
Standard: 1,435mm. Wide gauge causes wheel drop between rails. Narrow gauge causes wheel climb. AI sensors measure every 250mm along curves — where gauge deviation risk is highest.
Failure risk: wheel drop, derailment
02 — Cant (Cross-Level)
Height Difference Between Rails
Measures superelevation. Excessive cant at high speed on curves generates dangerous lateral forces. AI detects cant degradation linked to rail seat abrasion and worn fasteners before visible damage appears.
Failure risk: vehicle overturn on curves
03 — Twist
Change in Cross-Level Over Distance
The most dangerous compound defect — twist causes wheel unloading, where one wheel loses contact with the rail. AI models detect twist growth rates and flag acceleration before the Immediate Action Limit is reached.
Failure risk: wheel lift, high-speed derailment
04 — Alignment
Horizontal Straightness of Rail
Measures deviation from the horizontal reference line. Poor alignment produces lateral accelerations affecting ride comfort and wheel-rail interaction. AI compares each measurement cycle against baseline to detect migration.
Failure risk: lateral instability, corrugation
05 — Longitudinal Level
Vertical Profile of Each Rail
Irregularities in vertical profile cause excessive vertical accelerations — the jarring "dips" passengers feel. AI tracks profile deterioration from ballast settlement and flags tamping requirements before passenger comfort deteriorates.
Failure risk: ballast damage, ride quality loss
06 — Curvature
Horizontal Bending Accuracy
Ensures trains navigate curves safely within designed radius limits. Curvature deviation generates speed restrictions. AI continuously validates curvature geometry against design intent, alerting teams when curves migrate beyond tolerance.
Failure risk: imposed speed restrictions, derailment
How EN 13848 Safety Limits Work — And Where AI Intervenes
European standard EN 13848 defines three progressive action limits for track geometry deviations. Manual inspection programs typically act at the Intervention Limit. AI monitoring catches geometry trends at the Alert Limit — weeks earlier — when the tamping run costs a fraction of the emergency response.
EN 13848 Action Limit Zones — and AI Monitoring Position
Alert Limit (AL)
AI Acts Here
Intervention Limit (IL)
Manual Inspection Acts
Immediate Action (IAL)
Speed Restriction / Closure
Alert Limit
Geometry quality has declined to a planned attention level. AI flags the segment, projects trajectory, and schedules preventive tamping during next maintenance window. No service impact.
Intervention Limit
Maintenance must be planned within a defined period. Manual programs typically catch problems here — weeks or months after AI has already issued the alert and planned the response.
Immediate Action Limit
Speed restriction or line closure must be imposed before corrective work. Emergency response costs are 4–10x higher than planned tamping. AI is specifically designed to prevent this scenario.
How AI Measures Track Geometry at Operational Speed
Traditional geometry cars require dedicated track possession windows — meaning you stop revenue traffic to measure. AI monitoring systems run on revenue-service trains or autonomous inspection vehicles, gathering geometry data every pass without a single minute of track closure.
1
Inertial Measurement at Speed
Axle-box accelerometers · Inertial Measurement Units (IMU) · up to 200km/h
Axle-box accelerometers and IMU sensors mounted on revenue trains measure vertical and lateral accelerations at every metre of track during normal service. Unlike dedicated geometry cars, these instruments run 24/7 as part of the rolling stock — generating geometry intelligence with zero impact on timetable. The ODIN system deployed by BNSF in 2025 measured over 150,000 miles of track this way in a single calendar year.
2
Machine Vision and LiDAR Surface Scan
4K line-scan cameras · LiDAR · structured light · georeferenced output
High-speed line-scan cameras capture the full track surface at operational speed, while LiDAR builds millimetre-precision 3D geometry profiles of rail head shape, sleeper condition, and ballast shoulder geometry. Computer vision models — trained on hundreds of thousands of labelled defect examples — classify rail surface defects, fastener conditions, and weld anomalies in milliseconds. BNSF's THOR system used this approach to identify 1,900 defects across 165,000 miles of track in 2025, all addressed before becoming serious failures.
3
Edge ML — Defect Classification Before the Train Stops
On-board GPU processing · millisecond classification · instant critical alerts
Machine learning models run on-board the inspection vehicle, processing sensor data in real time without waiting for data to reach a central server. Critical defects — a broken rail, sudden gauge widening, IAL threshold breach — trigger instant alerts transmitted to operations control within minutes of detection. Non-critical data is batched, geo-tagged, and uploaded for the scoring and prioritisation stage. Edge processing eliminates the lag that makes traditional post-survey analysis too slow for high-traffic networks.
4
Track Geometry Index (TGI) Scoring per Segment
Multi-parameter ML model · deterioration trajectory · cross-survey comparison
The central AI platform aggregates all sensor inputs and computes a composite Track Geometry Index (TGI) for every defined segment. Unlike point-in-time measurements, the ML model stacks readings across multiple survey cycles to compute a deterioration rate — and projects when the segment will reach each EN 13848 threshold. Segments approaching the Alert Limit with an accelerating deterioration trajectory are ranked higher than segments currently worse but stable. This is the distinction that makes AI prioritisation fundamentally different from a sorted list of bad measurements.
5
Automated CMMS Work Order — Dispatched to Maintenance Team
Threshold breach trigger · pre-filled work order · CMMS integration · zero manual steps
When a segment's projected trajectory crosses a pre-set threshold, the platform automatically generates a work order in the connected CMMS — pre-filled with segment GPS coordinates, defect classification, recommended intervention type (tamping, grinding, gauge adjustment), and an optimal scheduling window based on traffic patterns. No analyst needs to interpret a spreadsheet. No manager needs to write up a job request. The pipeline closes the loop between sensor reading and crew dispatch in minutes.
Track Geometry · AI Scoring · EN 13848 Compliance · CMMS Integration
See Your Network's Geometry Health Scores — Before the Next Threshold Breach
iFactory's rail AI platform ingests your existing sensor data and produces segment-level TGI scores and a ranked maintenance priority list within the first deployment cycle.
Manual Geometry Survey vs AI Continuous Monitoring: What Changes
The decision cycle from geometry measurement to maintenance dispatch looks entirely different under an AI monitoring programme. The table below reflects the documented operational gap between quarterly manual survey regimes and continuous AI-driven monitoring.
| Capability |
Manual Survey (Quarterly) |
AI Continuous Monitoring |
| Measurement Frequency |
Every 3–12 months; track possession required |
Every revenue service pass — no possession required |
| Defect Detection Lead Time |
At or near Intervention Limit — weeks before IAL |
At Alert Limit — months before intervention needed |
| Deterioration Rate Modelling |
Not available — snapshot measurements only |
ML projects threshold crossing date per segment |
| Compound Defect Detection |
Parameters reviewed in isolation, combinations missed |
Multi-parameter model detects dangerous combinations |
| Work Order Generation |
Manual — engineer reviews data, writes work request |
Automated — CMMS order dispatched on threshold breach |
| Network Coverage |
Sampled routes — high-risk sections only |
Entire operated network — every kilometre, every pass |
What the ML Model Actually Does With Geometry Data
Storing geometry measurements is easy — any database does that. The intelligence is in what the model does next: comparing, modelling, projecting, and ranking. Here are the four analytical layers that separate AI track monitoring from a digital spreadsheet.
Multi-Survey Alignment and Trend Detection
Each new survey run is positionally aligned with prior passes using track chainage references. The model isolates genuine geometry change from measurement noise — so a 0.5mm gauge increase over four passes is identified as a real trend, not sensor variance. This is what enables deterioration rate calculation: the mathematical foundation of predictive maintenance.
Traffic Load and Seasonal Adjustment
Geometry deterioration is not linear — it accelerates with traffic load, freeze-thaw cycles, and ballast moisture content. The ML model incorporates tonnage data from Weigh-in-Motion sensors and historical weather exposure, adjusting each segment's projected deterioration curve for real-world conditions rather than a generic decay assumption.
Isolated Defect Identification and Severity Classification
Short-wavelength isolated defects — gauge spikes, twist peaks, weld settlement — are classified separately from general geometry quality, since they carry disproportionate derailment risk. The AI assigns each isolated defect a severity level aligned with Trafikverket's UH11/UH22/critical classification framework, ensuring the highest-risk individual anomalies are not averaged out by a good general TGI score.
Risk-Weighted Priority Ranking for Maintenance Planning
The final output is not a sorted list of bad geometry scores — it is a risk-weighted priority queue. Each segment is scored by combining its geometry trajectory with traffic volume, line classification (main line vs branch), the cost of planned versus emergency intervention, and the projected date of threshold breach. The result: a ranked work queue that tells your maintenance planner exactly which segments to schedule this month.
"
Before AI monitoring, we were operating in a kind of structured uncertainty. We knew the track was degrading — we just didn't know where the fast-movers were until we showed up with the geometry car. By then, two or three segments had already crossed the intervention limit during the gap. Now we see the trajectory in real time. We schedule tamping on segments that have not yet crossed the alert limit, and we haven't had an emergency speed restriction on a geometry-related issue in over a year.
— Head of Track Engineering, National Passenger Rail Network — 22 Years Infrastructure Experience
Documented Outcomes From AI Track Geometry Monitoring Deployments
Programmes across North America and Europe operating AI geometry monitoring have produced consistent, measurable results. The specific numbers vary by network size, starting condition, and sensor coverage — but the direction is the same everywhere the technology has been deployed at scale.
75%
Lower Manual Inspection Cost
Automated systems applied to high-traffic routes reduce dependence on costly manual labour, per Network Rail analysis
9M+
Man-Hours Reclaimed
CrossTech Hubble automated inspection deployment recovered 9 million man-hours annually across European rail network
1,900
Defects Found Before Failure
BNSF's THOR system identified and addressed 1,900 track defects in 2025, including a broken rail near critical infrastructure
Conclusion
Track geometry defects cause 34% of all derailments — and the majority of those defects were detectable weeks or months before the failure event. The gap is not a lack of sensors. It is a lack of pipeline: a system that moves continuously from measurement, to trend analysis, to safety threshold scoring, to ranked priority, to dispatched work order. That is exactly what AI track geometry monitoring delivers.
The networks already running this pipeline are measuring every kilometre on every revenue service pass, scheduling tamping at the Alert Limit rather than the emergency response stage, and eliminating the geometry-related speed restrictions that erode capacity and passenger trust. iFactory's rail infrastructure AI platform brings the full geometry monitoring pipeline to your network — from sensor ingestion to CMMS dispatch. Book a Demo to walk through the pipeline for your specific network, or Get In Touch to see your first segment geometry scores in the first deployment cycle.
Frequently Asked Questions
Every pass your trains make is geometry data you are not yet using. AI changes that.
iFactory transforms your existing sensor output into a continuous track geometry health score — and closes the loop to automated maintenance dispatch before your next threshold breach. Book a Demo or sign up to see your network's segment scores in the first deployment cycle.