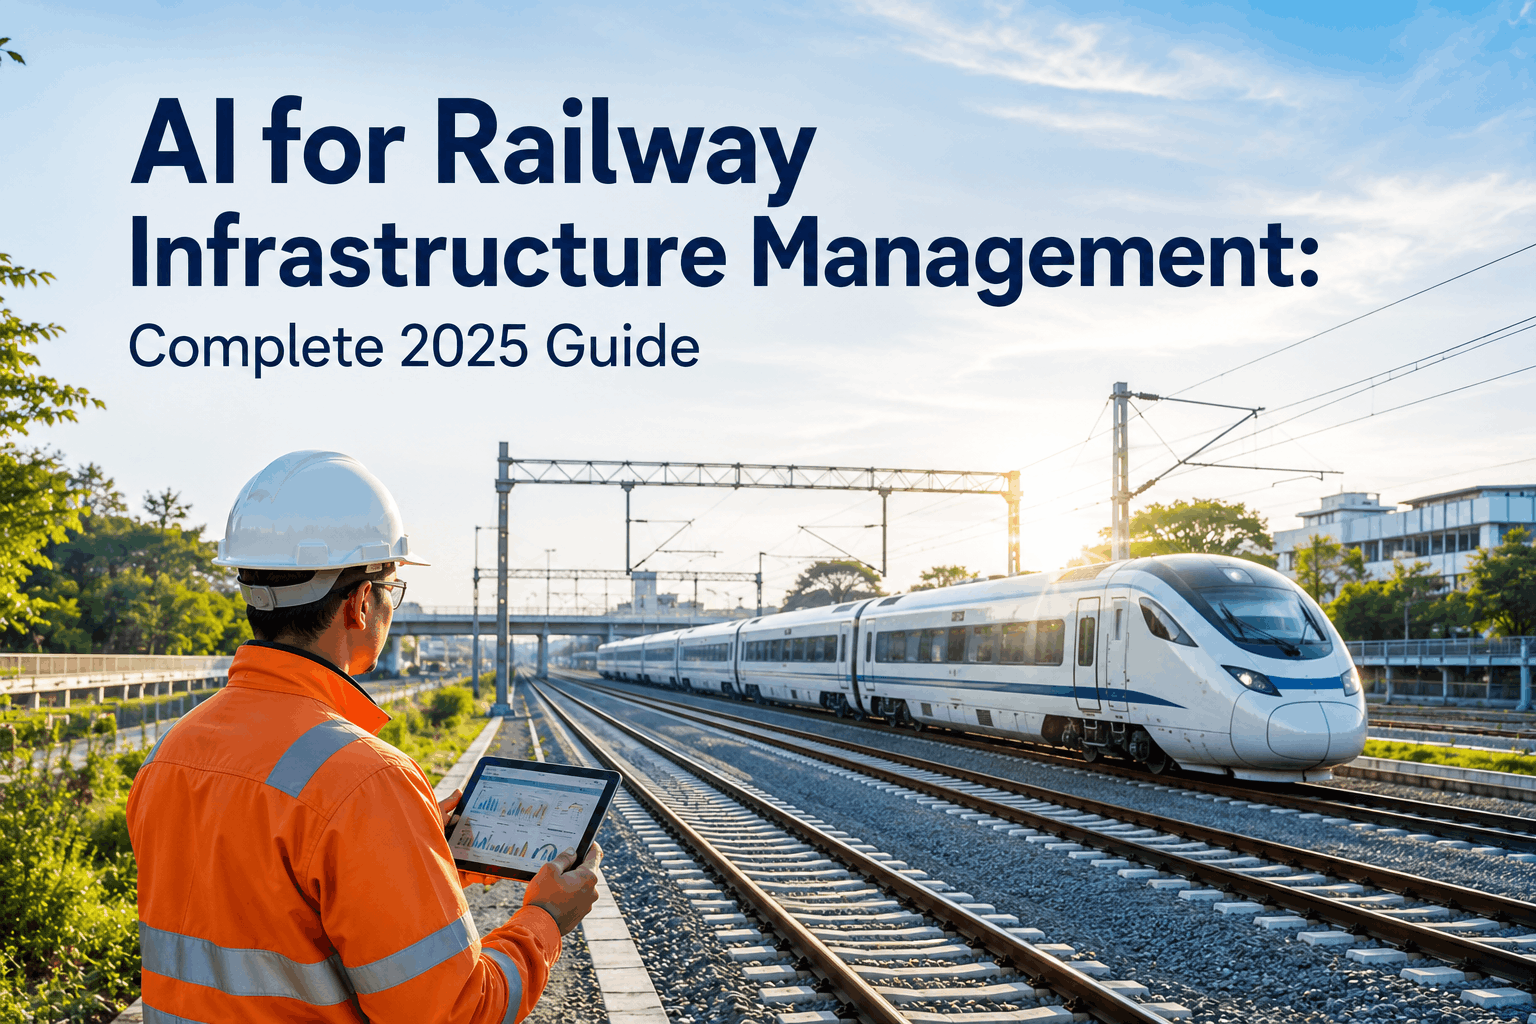
For national and regional rail operators, the permanent way is a "Linear Asset Liability" that accounts for over 40% of total operational expenditure. Traditional maintenance relies on manual track walks and scheduled window-inspections that only identify surface-level fatigue once it has already compromised safety margins. This creates the "Freight vs. Passenger Data Paradox," where different load profiles degrade infrastructure in non-linear ways that human inspectors cannot quantify. AI for railway infrastructure management changes the paradigm by utilizing multi-spectrum sensor telemetry and machine learning. By combining high-resolution visual mapping with acoustic vibrational analysis, iFactory pinpoints rail head defects and point-machine failures months before they manifest as service disruptions or derailment risks. By digitizing every kilometer of the corridor, we turn static steel into a responsive, self-auditing network. Book a Comprehensive Rail Infrastructure Audit to protect your high-value linear assets.
Digitize Your Permanent Way & Eliminate Service Surprises
Deploy AI-powered track health mapping to detect rail fatigue, ballast fouling, and signaling decay across your entire network in 48 hours.
The Strategic Value of AI-Driven Railway Analytics
The lifespan of heavy-haul or passenger rail track is typically 25–30 years, yet many networks are forced into premature rail replacement due to neglected structural fatigue and drainage issues. Railway Infrastructure Analytics identifies these "Invisible Killers" by mapping the track's structural signature in real-time. This railway AI guide reveals how digital oversight allows for targeted rail track repair that restores geometry and safety without the multi-million dollar expense of a full corridor shutdown. By creating a "Digital Twin of the Permanent Way," iFactory allows engineers to simulate wear-patterns under varying load conditions, optimizing the grinding schedule to maximize rail-life. Schedule a Demo to see predictive rail monitoring in action.
Effective railway health monitoring must go beyond simple visual inspection. It requires a railway maintenance checklist supported by deep learning to distinguish between surface rust and deep-seated internal rail flaws (RCF). By digitizing track condition assessment data, rail directors and infrastructure managers can prioritize their CAPEX spend across thousands of miles, addressing the highest-risk anomalies first to secure long-term network resilience. This data-driven approach also simplifies federal safety audits, providing a transparent record of structural integrity that traditional logbooks simply cannot match.
Four Critical Railway Failure Modes Resolved by AI
Railway systems fail from the ballast up. iFactory rail infrastructure inspection telemetry monitors for the four primary drivers of network decay. Book a Lifecycle Review.
Rolling Contact Fatigue (RCF) & Internal Flaws
Repeated wheel-rail contact causes microscopic surface cracks that propagate inward. iFactory's ultrasonic AI sensors detect these internal flaws ($20k/mile in prevented replacement cost) before they lead to rail breaks.
Signaling Interlocking & Point Machine Fatigue
Switching mechanisms (point machines) are the highest failure point in signaling. AI vibrational analysis identifies motor strain and mechanical wear as small as 0.5mm, triggering fault prevention alerts before the signal fails.
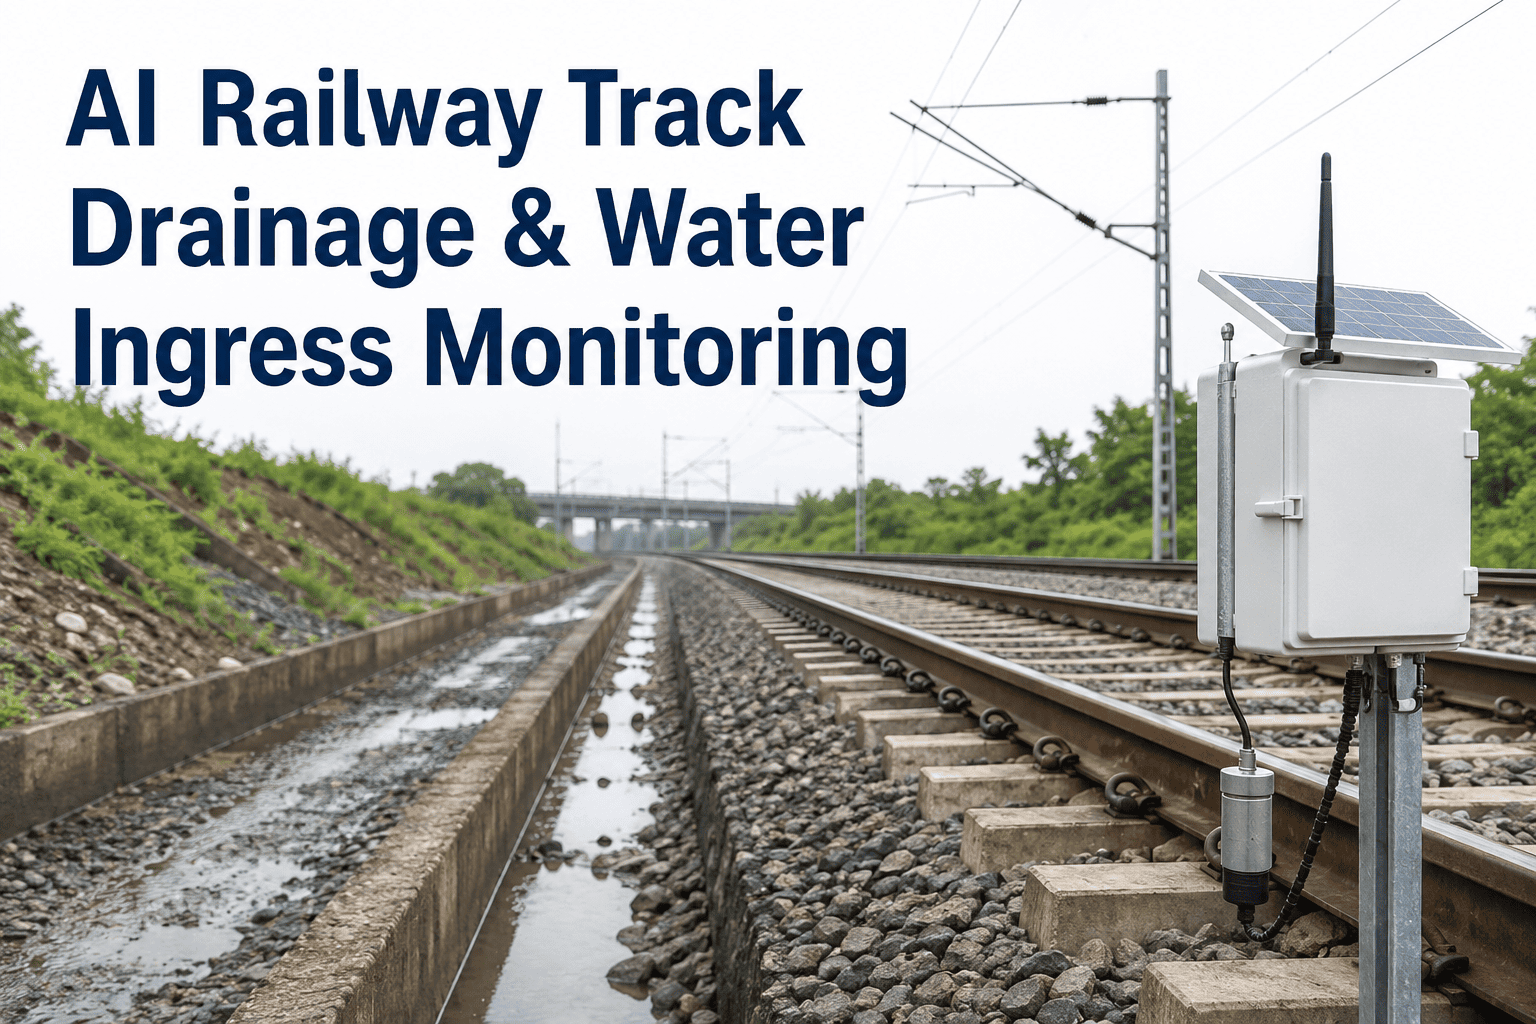
Ballast Fouling & Subgrade Drainage Stasis
Contaminated ballast leads to "Soft Spots" and track geometry shifts. AI-powered Ground Penetrating Radar (GPR) identifies moisture pockets that accelerate tie rot and rail misalignment.
Overhead Electrification (OHE) Pantograph Wear
Contact wire wear leads to dewirement events. OHE inspection analytics monitor the thermal and mechanical profile of the wire to identify hotspots caused by excessive friction or poor pantograph tracking.
Railway ROI Analysis: Lifetime Cost Comparison
The economic impact of railway lifecycle management is clear. Shifting from reactive to predictive monitoring saves millions in CAPEX over the life of a single corridor.
| Maintenance Strategy | Avg. Rail Lifespan | Annual PM Cost | Repair Accuracy | Emergency Surcharge | Est. 20-Year CAPEX |
|---|---|---|---|---|---|
| Reactive "Break & Fix" | 12–15 Years | $0.00 | 12% (Reactive) | 400% (Emergency) | $12.5M (Full Corridor Re-rail) |
| Standard Scheduled PM | 18–20 Years | $0.08 / yard | 40% (Time-Based) | 180% | $7.2M (Heavy Overhauls) |
| AI-Driven Rail Analytics | 32–35 Years | $0.12 / yard | 99% (Sensor Data) | Zero | $2.4M (Precision Grinding) |
| Network Hybrid Model | 28+ Years | $0.10 / yard | 94% (Data Unified) | <3% | $3.8M (Optimized) |
Utilizing a railway PM schedule backed by sensor data allows for "Precision Maintenance," where only the fatigued 5% of the rail is ground or replaced, as opposed to a blind 100% renewal.
Five Key Indicators for Railway System Resilience
To achieve true railway lifecycle mastery, our platform tracks five interconnected health indicators. Book a Demo to see live rail data.
1. Rail Head Profile Deviation (mm)
The delta between the ideal rail crown and actual wear. iFactory flags any deviation exceeding 1.5mm as a "Grinding Priority" to prevent further structural propagation.
2. Point Machine Current Signature (Amps)
Calculates the electrical effort required to move the switch. An amperage spike indicates friction or mechanical obstruction, predicting a failure days in advance.
3. Ballast Fouling Index (BFI)
AI visual sensors and GPR track the percentage of fine particles in the ballast. High BFI scores correlate with track "Pumping" and rapid geometry degradation.
4. Pantograph Contact Force (kN)
Monitors the upward force of the rolling stock against the OHE wire. Deviations indicate catenary sag or mechanical misalignment that could cause a dewirement.
5. Wheel Flat Recognition Index
In rolling stock, acoustic sensors identify the rhythmic thud of a "Wheel Flat." Early detection prevents the associated impact-load from damaging the track infrastructure.
Rail Compliance & Safety: The Digital Network Ledger
Most national rail safety standards (FRA, ERA) require documented rail inspection logs and evidence of proactive geometry maintenance. Secure Your Compliance Now.
iFactory railway infrastructure analytics serves as a tamper-proof digital ledger. Every ultrasonic scan, geometry survey, and signaling repair invoice is stored in a centralized "Certificate of Safety," ensuring your network meets all regulatory audit terms.
Railway Compliance Deliverables
The platform generates the exact datasets required by safety regulators and insurance underwriters.
- Ultrasonic Flaw Records: Permanent digital proof of rail structural integrity for audit.
- Geometry Continuity Logs: Automated documentation of track gauge, cant, and alignment.
- Signaling Fault Mapping: Photo-documentation of repairs following point machine inspection findings.
- Storm-Impact Surveys: Rapid response mapping after floods or landslides to support reopening decisions.
- Rolling Stock Scorecards: Data-backed metrics on wheel-health and impact-load performance.
- Lifecycle Maturity Reports: Data-backed estimates of Remaining Useful Life (RUL) for national CAPEX planning.
By converting your permanent way into a data-driven asset, you transform railway inspection from a recurring expense into a measurable financial hedge against catastrophic network failure.
60-Day Railway Digitization Roadmap
Digitizing your rail asset requires minimal track-time disruption. Our sensor-equipped inspection vehicles and drones deploy in days.
Inspection vehicles perform a "High-Speed Scan" (geometry visual / ultrasonic internal) of the corridor. GPS-referencing links flaws to exact rail-meter coordinates ($50K+ savings in diagnostic time).
iFactory AI processes the ultrasonic "B-Scans," identifying internal flaws, signaling strain, and ballast fouling. Each Anomaly is graded into a railway safety checklist for action.
The railway AI guide interactive dashboard goes live. Targeted track repair work orders are issued, and the permanent 24/7 monitoring loop for signaling and OHE begins.
Stop the Rail Breaks Before the Service Stops
Ultrasonic mapping, automated point-machine detection, and 100% safety compliance—deployed in 60 days with guaranteed year-one ROI.
Predictive Severity Matrix: Railway System Hazards
Your maintenance budget should be data-driven. Railway Analytics assigns a failure probability to every anomaly on your track.
Railway Defect Severity & Network Failure Probability
| Internal Rail Flaw (RCF > 5mm) | Failure Risk: 96% | Impact: Broken rail & derailment | Action: Immediate rail section replacement |
| Point Machine Strain (Current > 12A) | Failure Risk: 82% | Impact: Signaling lockout | Action: Lubricate and adjust within 24 hours |
| Ballast Fouling Index (> 40%) | Failure Risk: 45% | Impact: Geometry loss | Action: Schedule ballast cleaning at next window |
| OHE Contact Hotspot (> 120°C) | Failure Risk: 70% | Impact: Dewirement | Action: Inspect pantograph and wire tension |
The Railway Analytics Maturity Curve
Railway health Analytics ROI scales with the sophistication of your data capture. Transitioning from Level 1 to Level 4 reduces your renewal budget by 65%.
| Maturity Level | Technical Capability | Economic Capture | Typical Environment |
|---|---|---|---|
| Level 1 — Reactive Emergency | Respond to rail breaks, manual inspections | 8–12% | Legacy branch lines, low-speed rail |
| Level 2 — Scheduled PM | Fixed-time track walks, visual checks | 30–40% | Standard regional rail networks |
| Level 3 — Sensor-Assisted | Geometry cars, ultrasonic test vehicles | 55–70% | High-traffic freight and passenger corridors |
| Level 4 — AI Predictive | DRL-based modeling, acoustic OHE surveys | 85–92% | High-speed Rail (HSR) and Metro systems |
| Level 5 — Self-Healing Network | Real-time IoT track/OHE, AI-Auto Workflows | 92–98% | Smart Railway 4.0 Autonomous Hubs |
Key Takeaways: Why Rail AI is Your Best Safety Hedge
Effective railway lifecycle management is no longer about finding breaks—it's about preventing them. Book Your AI Audit to start saving.
Invisible Insight: Ultrasonic AI detects internal rail fatigue 18 months before it becomes a structural risk.
Reliability Security: Automated signaling logs ensure your point-machines maintain 99.9% availability for the full asset term.
Vibration Payback: Rolling stock monitoring prevents impact-load damage, extending track lifespan by up to 12 years.
CAPEX Precision: Infrastructure Analytics guide methodology allows for localized "Restoration" instead of full corridor re-railing.
Frequently Asked Questions
Below are the most common questions from operations leaders evaluating railway infrastructure Analytics.
How does AI identify rail flaws that ultrasonic tests might miss?
Traditional ultrasonic testing produces "B-Scans" that require manual interpretation, which is prone to error. iFactory's AI uses Deep Learning to analyze millions of scan patterns, identifying subtle signal anomalies that correlate with early-stage fatigue that the human eye frequently overlooks.
Does a drone survey work for railway electrification wires?
Yes. High-resolution LiDAR and thermal drones are extremely effective for OHE inspection. They can map wire height, stagger, and wear with millimeter precision without requiring any power shutdowns or track-time occupancy.
Can you integrate with our existing Signaling Control Center?
Absolutely. iFactory acts as the "Reliability Layer" that pulls diagnostic data from your existing interlocking and SCADA systems. We process this data through our predictive engine and push actionable health-alerts directly into your dispatch dashboard.
What is the best way to monitor ballast health across long distances?
We use a combination of Ground Penetrating Radar (GPR) mounted on inspection vehicles and satellite-based synthetic aperture radar (SAR) to monitor subgrade moisture and ballast fouling across hundreds of miles in a single pass.
How long does an AI health-audit take for a 50-mile rail corridor?
For a 50-mile section, the high-speed geometry and ultrasonic scan take approximately 4 hours of track time. You receive the full AI-analyzed health report and risk grading within 48 hours of data capture.
Get Your Network-Wide Rail Health Report Today
Quantify the structural fatigue on your track and find out how much lifecycle extension you can achieve with predictive Analytics.