Every freight train that moves across a rail network generates thousands of data points per minute — GPS position, axle load, speed, vibration, brake pressure, engine temperature. For most of railway history, that data was either ignored or only reviewed after something went wrong. AI changes that entirely. Real-time freight tracking powered by machine learning transforms raw sensor streams into live network intelligence — predicting delays before they cascade, flagging infrastructure stress before it causes failures, and optimising routing decisions before a train has left the yard. The result is a fundamentally different operating model: one where the network thinks ahead instead of reacting after the fact.
Freight Tracking · Network Optimisation · Predictive Maintenance · Infrastructure AI
Your Freight Network Is Generating Data. AI Turns It Into Competitive Advantage.
iFactory's infrastructure AI platform connects your freight tracking data, asset sensor feeds, and maintenance records into predictive models that show you where delays are forming, which assets are approaching failure, and how to route smarter — before disruptions happen.
$697B
Projected global rail logistics market by 2034
20–25%
Transportation cost reduction from AI route optimisation
£20M+
Annual productivity gains from AI track monitoring (Network Rail)
140K mi
US rail network now monitored with AI-assisted inspection tools
What Real-Time AI Tracking Actually Changes in a Freight Operation
Traditional freight tracking tells you where a train is. AI freight tracking tells you where the problem is going to be — 20, 40, or 120 minutes from now. That predictive gap is where operational advantage is won or lost. Here is what the shift looks like across the three domains where freight AI delivers the most measurable impact.
Domain 01
Live Asset Location and Condition
GPS alone shows position. AI shows position plus condition: wheel health, bearing temperature, brake pressure variance, and load distribution — all streamed and analysed in real time. Shippers get accurate, live ETAs. Operators get early warning of developing faults before a wagon is pulled from service mid-run.
Key Signals Monitored
Wheel impact load and profile
Bearing acoustic signatures
Dwell time at terminals
Cargo load distribution
Domain 02
Network Flow and Delay Prediction
Delays in rail freight don't start at the point of impact — they start upstream, in congestion building at interchange points, conflicting path demands, or terminal dwell times that are running long. AI models analyse network-wide flow continuously, predicting delay cascades 20–60 minutes ahead and presenting rerouting options while there is still time to act on them.
AI Outputs
Delay cascade predictions
Dynamic rerouting options
Terminal bottleneck alerts
ETA accuracy scores
Domain 03
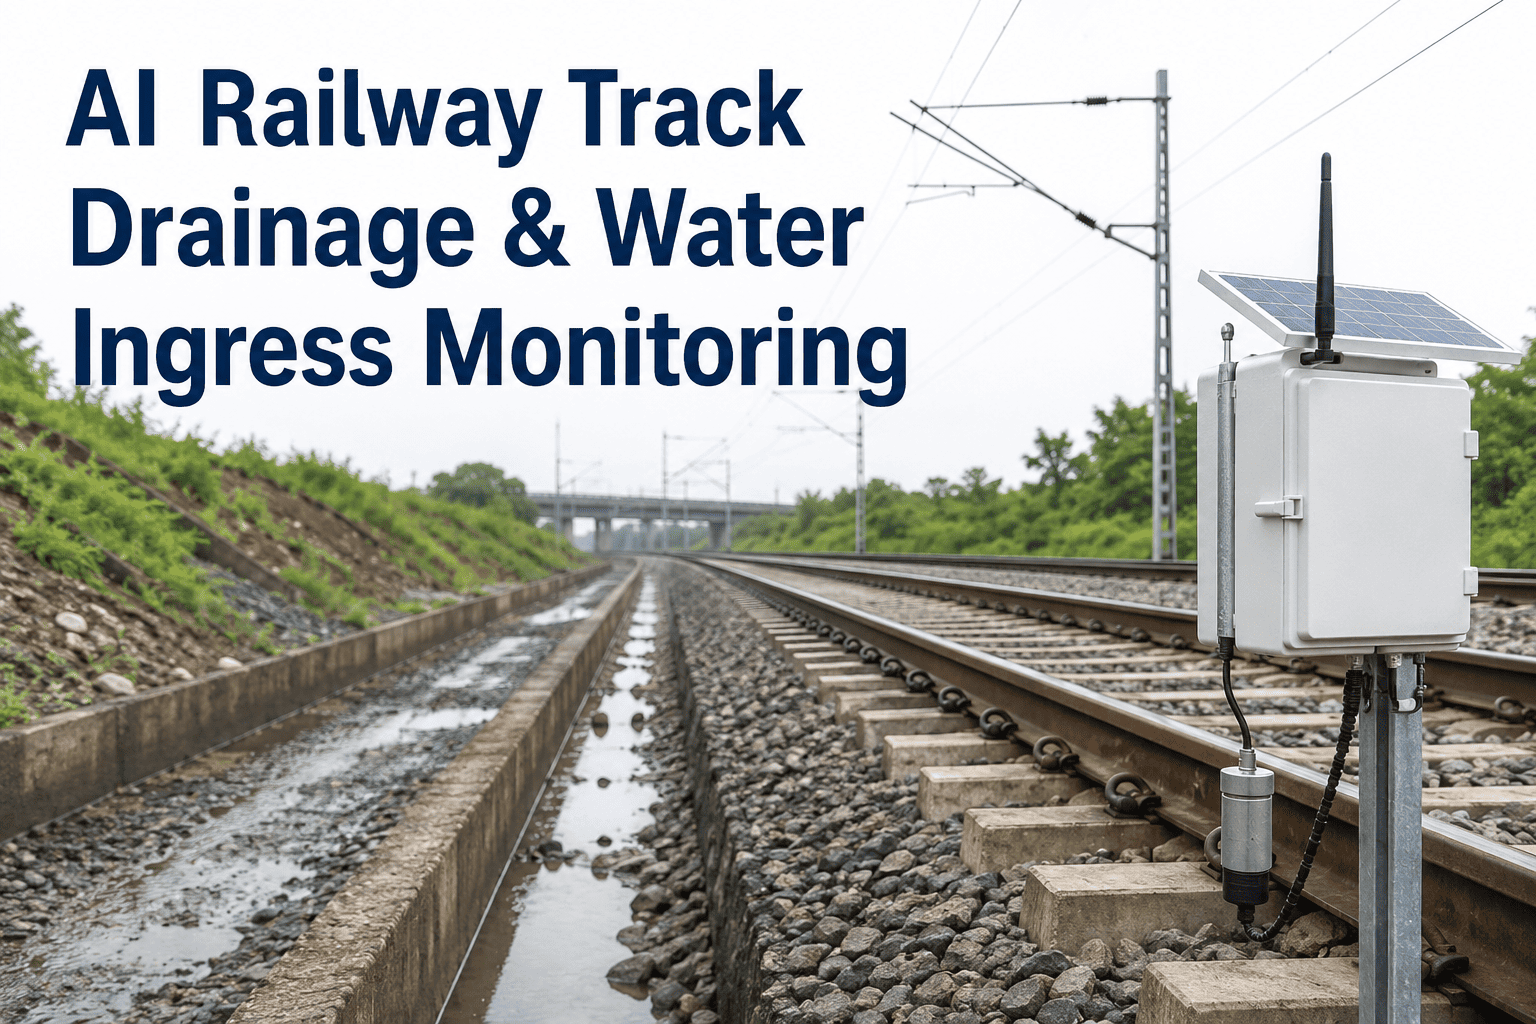
Infrastructure Health Along the Route
Every freight train is also a data collection vehicle. Sensors aboard rolling stock capture track geometry anomalies, vibration signatures, and rail surface variations mile by mile. AI models aggregate this data across every run to build a continuously updated map of infrastructure health — flagging sections approaching intervention thresholds weeks before a defect becomes a speed restriction or line closure.
Infrastructure Inputs
Track geometry sensors
Vibration and ride quality data
Speed restriction pattern changes
Historical failure correlation
How the Intelligence Layer Works: Data Architecture for Freight AI
Freight AI is not a single model — it is a layered architecture that connects live operational data with historical patterns to produce decisions that neither source could generate alone. The architecture below shows how tracking data, asset sensor feeds, and infrastructure records converge into actionable network intelligence.
AI Data Architecture — Freight Network Intelligence
1
Raw Data Streams
GPS, IoT sensors, RFID tags, terminal systems, timetable feeds, weather data
2
Feature Engineering
Vibration spectra, flow velocity, dwell variance, load anomaly scores, route congestion index
3
Prediction Models
LSTM delay forecasting, Random Forest asset health, gradient-boost routing optimisation
4
Operational Output
Delay alerts, rerouting recommendations, maintenance work orders, shipper ETA updates
Who Receives Each Output
Control Room Operations
Maintenance Teams
Freight Shippers and Logistics Partners
Capital Planning and Asset Management
Freight Tracking · Asset Health · Network Optimisation
Every Delay in Your Network Was Visible in the Data Before It Happened.
iFactory builds predictive AI models from your existing freight and infrastructure data — so your control room sees network problems before they become delays, and your maintenance teams work on what is actually about to fail, not what the schedule says. Book a Demo to see what the model finds in your data.
Before AI vs. After AI: The Freight Operations Comparison
The operational gap between a freight network running on conventional tracking and one running on AI-integrated tracking is not incremental. It is a different mode of operation — one that manages from prediction rather than response.
ETA is based on schedule — no adjustment for congestion, dwell overruns, or developing track restrictions
ETA updates continuously from real-time network state — accurate to within minutes, not hours
Asset failures discovered when the fault occurs — wagon removed from service mid-journey, disrupting downstream connections
Bearing wear, wheel profile degradation and brake anomalies flagged 2–6 weeks before failure — planned intervention at depot, not emergency recovery
Route decisions based on standard paths and manual dispatcher knowledge — no real-time network congestion awareness
AI models analyse multiple routing options in real time, accounting for current congestion, weather, and available path windows
Track inspection on fixed cycles — defects can develop undetected between inspection dates
Every passing freight train contributes sensor data — track health updated continuously, defects flagged well ahead of inspection schedule
Five Use Cases Where Freight AI Delivers the Most Immediate Value
AI freight tracking is not a single capability — it is a platform that addresses several high-value operational problems simultaneously. These are the five areas where early deployments consistently show the fastest measurable return.
01 — Wagon Utilisation
AI tracks wagon position and dwell time across the network continuously. Underutilised wagons are identified and redeployed before they accumulate idle costs. Operators using AI utilisation models have reduced wagon fleet sizes by 8–12% while maintaining throughput.
02 — Terminal Throughput
Dwell time at terminals is one of the largest sources of delay in rail freight. AI models predict which trains will arrive late, which loading sequences are running slow, and where resource conflicts will form — giving terminal managers time to adjust before queues form.
03 — Fuel and Energy
AI-optimised driving advisory systems analyse gradient, load, speed, and network state to recommend throttle and braking profiles that minimise energy consumption per journey. Combined with route optimisation, fuel savings of 5–10% per run are achievable at scale.
04 — Shipper Visibility
Freight shippers increasingly demand the same real-time visibility in rail that they receive from road logistics. AI-powered ETA prediction with live status updates gives shipper-facing portals the accuracy and reliability that drives modal shift from road to rail.
05 — Track Condition Monitoring
Track defects that develop between scheduled inspection cycles represent a significant safety and availability risk. AI models built from rolling stock vibration data and inspection records can predict which track sections are approaching intervention threshold — enabling targeted, cost-efficient maintenance deployment.
75%
Reduction in manual track inspection costs achievable through automated AI monitoring systems
Source: Network Rail analysis of automated vs. manual inspection cost benchmarks
The problem was never that we lacked data — we had more sensor data than we could read. The problem was that nothing was connecting the wagon location feed with the asset health feed with the track condition record. Once those three inputs were in one model, we started seeing patterns that had been sitting in our data for years: specific wagon types on specific corridors developing bearing problems at predictable intervals. That alone changed how we planned maintenance for a whole class of rolling stock.
— Fleet Engineering Manager, European Freight Rail Operator
Measurable Outcomes From Freight AI Deployments
Published benchmarks and operator-reported results from freight AI deployments show consistent patterns across cost, reliability, and asset performance. These are the numbers that make the business case.
20–25%
Transport cost reduction
From AI route optimisation across large-scale freight networks (Deloitte benchmark)
30–50%
Unplanned downtime reduction
Assets maintained before failure instead of after — eliminating emergency recovery costs
5–10%
Fuel savings per run
From AI driving advisory and network-optimised routing — translating to millions annually at fleet scale
Up to 1yr
Failure prediction lead time
Network Rail's AI track monitoring platform predicts infrastructure failures up to 12 months in advance
Conclusion
Rail freight networks are among the most data-rich operating environments in global logistics — and historically among the least connected, with asset tracking, infrastructure monitoring, and network operations running as separate systems that rarely talked to each other. AI integration closes that gap. By connecting freight tracking data with asset health feeds and infrastructure condition records into a single predictive model, operators gain the kind of network-wide situational awareness that turns reactive dispatch into proactive optimisation.
iFactory's infrastructure AI platform applies machine learning to your existing operational data — wagon sensors, terminal records, timetable feeds, maintenance histories — to build integrated predictive models for asset health, network flow, and infrastructure condition. Book a Demo to see what the model identifies in your freight data, or Get In Touch to begin the data onboarding process.
Frequently Asked Questions
The next wagon failure, network delay, and track defect on your network are already in your data. The question is whether you're reading it.
iFactory builds AI models from your existing freight operational data — delivering predictive asset health, network flow intelligence, and infrastructure monitoring from a single platform. Book a Demo to run the models on your data.