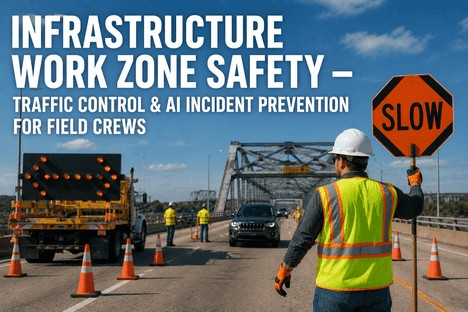
Infrastructure Work Zone Safety — Traffic Control & AI Incident Prevention for Field Crews
By Grace on June 24, 2026
Every six hours, a person dies in a work zone in the United States. In 2024, 850 people lost their lives in work zone crashes — drivers, passengers, pedestrians, and the men and women performing maintenance on active roadways, bridges, and utility sites. The Infrastructure Investment and Jobs Act has directed over $350 billion toward highway and bridge projects, meaning more work zones, more field crews, and more exposure to live traffic. For EHS managers responsible for infrastructure safety, the mandate is clear: traditional traffic control planning and PPE compliance monitoring are no longer sufficient. AI-powered incident prevention, real-time hazard detection, and connected field safety systems are the new standard. This guide is written for EHS managers who need to protect field crews operating in active traffic environments while maintaining project velocity and regulatory compliance.
Traffic Control AI · PPE Compliance · Incident Prevention · Work Zone Safety · Field Crew Protection
Every Work Zone Is a Risk Zone. iFactory Helps You Protect Every Crew Member on Every Job.
iFactory's safety management platform gives EHS managers real-time visibility into work zone hazards, PPE compliance, traffic control plans, and incident data — connecting field operations to the dashboard you need to prevent harm before it happens.
People killed in U.S. work zones in 2024 — an average of 2 lives lost every day, according to FHWA data
1 in 5
Workplace fatalities occur in construction — making it the deadliest industry sector in the United States
$350B
IIJA highway funding driving infrastructure projects nationwide — more work zones, more crews exposed to live traffic daily
58.6%
Of construction deaths caused by OSHA's Fatal Four hazards — falls, struck-by, electrocution, and caught-in-between
Why Traditional Work Zone Safety Planning Falls Short — and What the data Tells Us
The pattern is consistent across infrastructure operations that rely on static safety plans, paper-based inspections, and manual PPE checks: hazard identification lags behind real-world conditions, near-misses go unreported, and the data that could prevent tomorrow's incident sits in disconnected logs that nobody reviews until after an injury occurs. Three structural gaps explain why traditional approaches continue to produce the same outcomes.
01
Traffic Conditions Change Faster Than Safety Plans Can
A traffic control plan created at project start rarely reflects the reality of day 47. Lane closures shift, driver behaviour varies by time of day, weather reduces visibility, and adjacent construction changes approach routes. Static plans create a false sense of safety because they assume conditions remain predictable. When field crews encounter conditions their plan did not anticipate, they improvise — and improvisation in live traffic is where incidents originate.
02
PPE Compliance Is Monitored, Not Enforced in Real Time
The daily PPE walkaround is the standard method — a supervisor visually checks that crew members are wearing hard hats, high-vis vests, gloves, and boots. But compliance drops between inspections, especially during shift changes, in low-light conditions, and when workers remove gear temporarily for comfort. The gap between spot-check and incident is where PPE violations become fatalities. Automated detection closes this gap by monitoring every worker, every second, across every zone.
03
Incident Data Is Collected, but Not Connected to Prevention
Most organisations maintain incident logs, near-miss registers, and inspection reports. But these data sources sit in separate systems — paper forms, spreadsheets, email chains — without being aggregated into a pattern-recognition layer. A struck-by incident on highway project A and a near-miss on bridge project B may share the same root cause, but without connected data, that pattern remains invisible until a third event occurs. Analytics platforms that correlate incidents across projects are the only way to identify systemic risks before they produce repeat harm.
The Fatal Four — OSHA's Leading Causes of Construction Deaths
The Bureau of Labor Statistics reports that 58.6% of all construction fatalities stem from four hazard categories. Falls account for 33.5% of deaths, struck-by incidents for 11.4%, electrocutions for 8.4%, and caught-in or caught-between events for 5.4%. These are not random events — they are predictable, preventable, and disproportionately concentrated in organisations that lack real-time hazard detection and response systems. EHS managers who deploy connected safety platforms with AI-powered monitoring see measurable reductions across all four categories within the first two quarters of adoption.
The Safety Technology Stack — Four Layers Every Infrastructure EHS Manager Needs
The gap between traditional work zone safety and AI-powered incident prevention is not a matter of replacing people with technology. It is a matter of giving every person in the safety ecosystem — from the flagger in the field to the EHS director reviewing quarterly trends — the right data at the right time to make decisions that prevent harm. The following four-layer technology stack describes the capabilities that distinguish high-performing infrastructure safety programmes from those still relying on paper-based hazard identification.
Layer 01
Real-Time Traffic Control Monitoring and Adaptive Planning
Foundation
Static traffic control plans are replaced by connected monitoring that surfaces real-time conditions — approaching vehicle speeds, lane shift compliance, flagger positioning, and equipment placement. When connected sensors detect a vehicle偏离 from the expected lane pattern or a speed anomaly approaching the work zone, alerts reach the site supervisor and the EHS manager simultaneously. Over time, aggregated traffic pattern data feeds into planning decisions: which hours of the day produce the highest approach speeds, which traffic control configurations produce the greatest speed reduction, and where additional positive protection devices are needed. iFactory's platform integrates traffic control monitoring data into the same dashboard that tracks PPE compliance and incident reports — creating a unified view of every risk layer in the work zone.
Layer 02
AI-Powered PPE Compliance Detection
Technology
The global PPE detection market is projected to grow from $462 million in 2024 to $652 million by 2031 — driven by organisations that recognise manual compliance checks as the weakest link in their safety chain. Computer vision models trained on construction and infrastructure work zones can now detect hard hats, high-vis vests, gloves, safety boots, face shields, and fall protection harnesses in real time through existing camera infrastructure. When a worker enters a zone without the required PPE, the system triggers an immediate alert — audible on-site, visible on the supervisor dashboard, and logged permanently in the compliance record. The most effective implementations pair AI detection with contextual rules: specific zones require specific PPE combinations, and the system enforces those rules 24 hours a day without fatigue, distraction, or oversight. iFactory's PPE compliance module integrates directly with your existing camera systems and surfaces real-time violation data alongside your broader safety metrics.
Layer 03
Connected Incident Reporting and Pattern Analytics
Intelligence
A near-miss is a leading indicator of a future fatality — but only if the organisation captures it, classifies it, and connects it to other events across projects and time periods. Connected incident reporting means every event — from a near-miss involving a passing vehicle to a PPE violation caught by AI detection to a first-aid injury — enters a central analytics layer that identifies trends, repeat patterns, and escalating risk profiles. When the same type of struck-by near-miss appears on three projects in the same month, the platform surfaces a pattern alert that triggers a root-cause review before a serious incident occurs. EHS managers who rely on connected incident analytics reduce their total recordable incident rates by an average of 30% within 12 months of deployment, according to industry benchmarks.
Layer 04
Executive Dashboard — From Site-Level Data to Strategic Safety Decisions
Leadership
The data generated by connected work zones is only valuable if it reaches the people who can act on it. An EHS manager reviewing last month's incident log in a spreadsheet is reacting. An EHS manager opening a live dashboard that shows PPE compliance rates by project, near-miss trend lines, traffic control plan adherence scores, and incident frequency by hazard category is leading. iFactory's executive dashboard aggregates data from every layer of the safety technology stack into a single view — with threshold alerts that notify decision-makers when a metric crosses a defined boundary. This is the layer that transforms safety from a compliance function to a strategic capability. When board reporting includes trend data from connected work zones, safety investment decisions are driven by evidence rather than intuition.
AI PPE Detection · Traffic Monitoring · Incident Analytics · Connected Field Safety · Real-Time Dashboards
The Technology Is Ready. The Only Question Is Whether Your Safety Programme Is Connected Enough to Use It.
iFactory unifies AI-powered PPE detection, real-time traffic control monitoring, connected incident reporting, and executive analytics into one platform — so EHS managers can see every risk layer across every project from a single dashboard.
Regulatory Landscape — How OSHA and Federal Standards Are Driving Technology Adoption
The regulatory environment for work zone safety is shifting from prescriptive compliance toward outcome-based performance measurement. The FHWA's 2024 final rule updating 23 CFR Part 630 requires state transportation agencies to implement comprehensive work zone safety and mobility processes that include performance measurement, data-driven decision-making, and coordinated project development. For EHS managers of infrastructure contractors and utility operators working on federally funded projects, this means the regulatory expectation is no longer simply having a traffic control plan on file — it is demonstrating that the plan produces measurable safety outcomes. Organisations using connected safety platforms with real-time monitoring and incident analytics are better positioned to meet this evolving standard because they can produce compliance evidence that static inspection logs cannot — continuous PPE compliance data, trend-based near-miss analysis, and documented traffic control adherence across the full project lifecycle.
OSHA's focus on the Fatal Four hazards continues to drive enforcement priorities. In 2024, fall protection remained the most frequently cited OSHA standard in construction, followed by hazard communication, scaffolding, and ladders. EHS managers who deploy AI-powered hazard detection systems gain a compliance advantage — not by replacing the safety professional's judgment, but by providing continuous monitoring coverage that no human inspection schedule can match. When OSHA citation exposure can be predicted and prevented through real-time compliance data rather than discovered during a post-incident investigation, the safety function shifts from reactive compliance management to proactive risk prevention. iFactory's compliance analytics module tracks OSHA-relevant metrics across all active projects and surfaces citation exposure indicators before they become enforcement events.
The EHS Manager's KPI Framework — What to Measure and Why
A connected safety platform generates more data than any EHS manager can review manually. The key is selecting the metrics that connect directly to decisions. The following KPI framework organises measures by the level of the organisation that acts on them — ensuring every metric has a named owner and a defined response threshold.
Field Level
PPE compliance rate by zone and shift — real-time detection data with automatic violation alerts
Traffic control device integrity — sensor-verified placement of cones, barriers, and signage relative to plan
Near-miss submissions per shift — leading indicator tracked at the crew level with trend visibility
Supervisor Level
Hazard identification closure rate — time from identification to control implementation across the project
Safety briefing completion rate — percentage of daily tailboard and pre-task briefings completed with documentation
First-aid and near-miss trend — weekly movement in minor events that predict serious incident risk
EHS Manager Level
Total recordable incident rate by project type — compare safety performance across highway, bridge, and utility operations
PPE compliance trend by project — projects below 90% compliance flagged for leadership intervention
Incident response time — average minutes from alert to action, measured across all connected detection systems
Director Level
Safety spend per incident prevented — ROIs on PPE detection, traffic monitoring, and training investments
OSHA citation exposure index — predicted citation risk based on current compliance metrics across all active projects
Work zone incident severity trend — 12-month moving average of injury cost, lost hours, and preventable near-misses
The Work Zone Safety Maturity Model — Where Is Your Organisation Today?
Every infrastructure organisation sits somewhere on the safety technology maturity curve. The following model helps EHS managers assess their current position and identify the specific capabilities needed to move to the next stage.
Infrastructure Work Zone Safety Maturity Model
Stage
Safety Approach
Data Characteristics
EHS Priority
Stage 1
Reactive
Incidents drive safety investment. After an injury, new controls are added. Before an injury, the existing plan is assumed sufficient.
Paper logs, disconnected spreadsheets, incident reports filed without root cause analysis. No accessible trend data across projects.
Centralise incident data into a single digital system. Establish consistent hazard classification taxonomy across all projects.
Stage 2
Compliant
Safety programmes meet regulatory requirements. Inspections occur on schedule. PPE is issued and documented. Training is completed.
Digital inspection records, training completion logs, PPE issue registers. Data exists but is reviewed monthly rather than acted upon daily.
Introduce real-time PPE monitoring and connected near-miss reporting. Move from monthly safety reviews to daily dashboard use.
Stage 3
Connected
Real-time data drives daily safety decisions. PPE compliance is monitored by AI. Traffic conditions are tracked. Patterns are analysed across projects.
Live dashboards at every level, AI-powered detection feeds, connected incident logs, trend analytics with threshold alerts. Data quality is actively managed.
Integrate traffic control data with safety metrics. Establish automated alerting for KPI threshold breaches. Build predictive capability.
Stage 4
Predictive
Safety interventions occur before incident indicators emerge. Resource allocation is driven by predictive risk models. Investment decisions are evidence-based.
AI-driven anomaly detection, predictive risk scoring, connected supply chain and workforce data. Analytics embedded in every planning and procurement cycle.
Benchmark safety performance against industry peers. Use predictive analytics for resource planning. Drive continuous improvement from connected data.
Conclusion
The data is clear: work zone fatalities remain unacceptably high, with 850 lives lost in 2024 and 1 in 5 workplace deaths occurring in construction. Traditional safety approaches — static traffic control plans, manual PPE inspections, disconnected incident logs — are not closing the gap because they do not address the speed at which risks change in active work zones. The organisations that consistently protect their field crews are those that have adopted connected safety technology stacks: real-time traffic monitoring, AI-powered PPE compliance detection, centralised incident analytics, and executive dashboards that transform safety data into strategic decisions.
iFactory's safety management platform gives EHS managers the infrastructure they need to move from reactive compliance to connected prevention. With real-time hazard detection, automated PPE monitoring, cross-project incident analytics, and tiered KPI visibility from the field to the boardroom, iFactory connects every layer of the safety ecosystem in a single platform. Book a Demo to see how the platform maps to your operation's risk profile, or Talk to an Expert to begin building your connected work zone safety programme with iFactory today.
850 Deaths in 2024. Zero Is the Only Acceptable Target. Start Building Your Connected Work Zone Today.
iFactory gives EHS managers the real-time visibility, AI detection capability, and connected analytics infrastructure to protect every crew member in every work zone — from the highway shoulder to the bridge deck to the utility trench.
iFactory aggregates data from all active projects into a single executive dashboard — with each work zone displayed as a separate entity showing its current risk profile, PPE compliance rate, active hazards, and incident history. EHS managers can drill into any project from the overview screen to see traffic control monitoring data, recent near-miss submissions, and supervisor-level safety metrics. Threshold alerts are configured per project type — so highway work zones, bridge rehabilitation projects, and utility site operations each have their own alert parameters based on the specific risk profile of that work type. Talk to an Expert to see how multi-project visibility works in your operational context.
iFactory's PPE detection module is designed to integrate with existing IP cameras, dash cams, and site surveillance systems using open standards (ONVIF, RTSP). No proprietary hardware is required. The AI models are pre-trained on construction and infrastructure work zone environments to detect hard hats, high-vis vests, safety gloves, steel-toe boots, safety glasses, face shields, and fall protection harnesses. The system adapts to different camera angles, lighting conditions, and weather scenarios common in outdoor work zones. Setup typically takes days, not weeks, because the platform works with the camera infrastructure you already have. Book a Demo to see the integration process mapped to your current equipment.
Alert routing in iFactory follows a tiered escalation model based on severity and duration. A brief PPE violation that self-corrects within seconds is logged but does not trigger a notification. A sustained violation lasting more than 30 seconds triggers an alert to the site supervisor. A pattern of repeated violations in the same zone within the same shift escalates to the EHS manager with a trend notification. Traffic control alerts follow the same logic — a momentary speed anomaly near the work zone is logged; a sustained approach speed pattern indicating driver confusion triggers a traffic control plan review recommendation. This tiered approach ensures that urgent situations receive immediate attention while pattern-based alerts support strategic decision-making without overwhelming recipients. Book a Demo to configure your alert routing hierarchy.
Organisations that activate AI-powered PPE monitoring in the first week of deployment typically see compliance rates increase by 15-20% within the first month — driven by the visibility effect of workers knowing that compliance is being monitored continuously. Near-miss reporting volume typically increases in the first six to eight weeks as the connected reporting system makes submissions easier and demonstrates that reports lead to action. Measurable reductions in total recordable incident rates typically appear within three to four months, with sustained year-over-year improvement as the connected analytics layer identifies and addresses root cause patterns. The speed of improvement correlates most strongly with the frequency of leadership dashboard review — EHS managers who review their metrics daily achieve outcomes 2-3 times faster than those who review weekly. Talk to an Expert to discuss a deployment timeline tailored to your operation's size and complexity.