Most mid-size and large cities now operate at least three separate monitoring systems — one for water and wastewater, one for roads and traffic, and one for buildings and facilities — each purchased from a different vendor, each with its own dashboard, its own alert rules, and its own data format. Operations directors responsible for city-wide infrastructure performance spend a significant portion of their day switching between these systems trying to understand whether the water main break on Elm Street is related to the traffic signal failure at the same intersection, or whether the rising energy consumption in the community center is connected to the HVAC fault code that the building management system generated at 3 AM but nobody saw because the facilities team does not monitor alerts overnight. The insight gap between these siloed systems is not a minor inconvenience — it is the primary reason that cross-infrastructure failures take longer to diagnose, that coordinated maintenance opportunities are missed, and that city operations teams cannot demonstrate the return on investment that justifies continued IoT expansion. A unified IoT platform that ingests data from all infrastructure domains into a single AI-powered analytics layer eliminates these gaps by making cross-domain correlations visible for the first time. Talk to iFactory support about building a unified smart city IoT platform for your infrastructure portfolio.
Smart City IoT · Unified Platform · Cross-Infrastructure AI
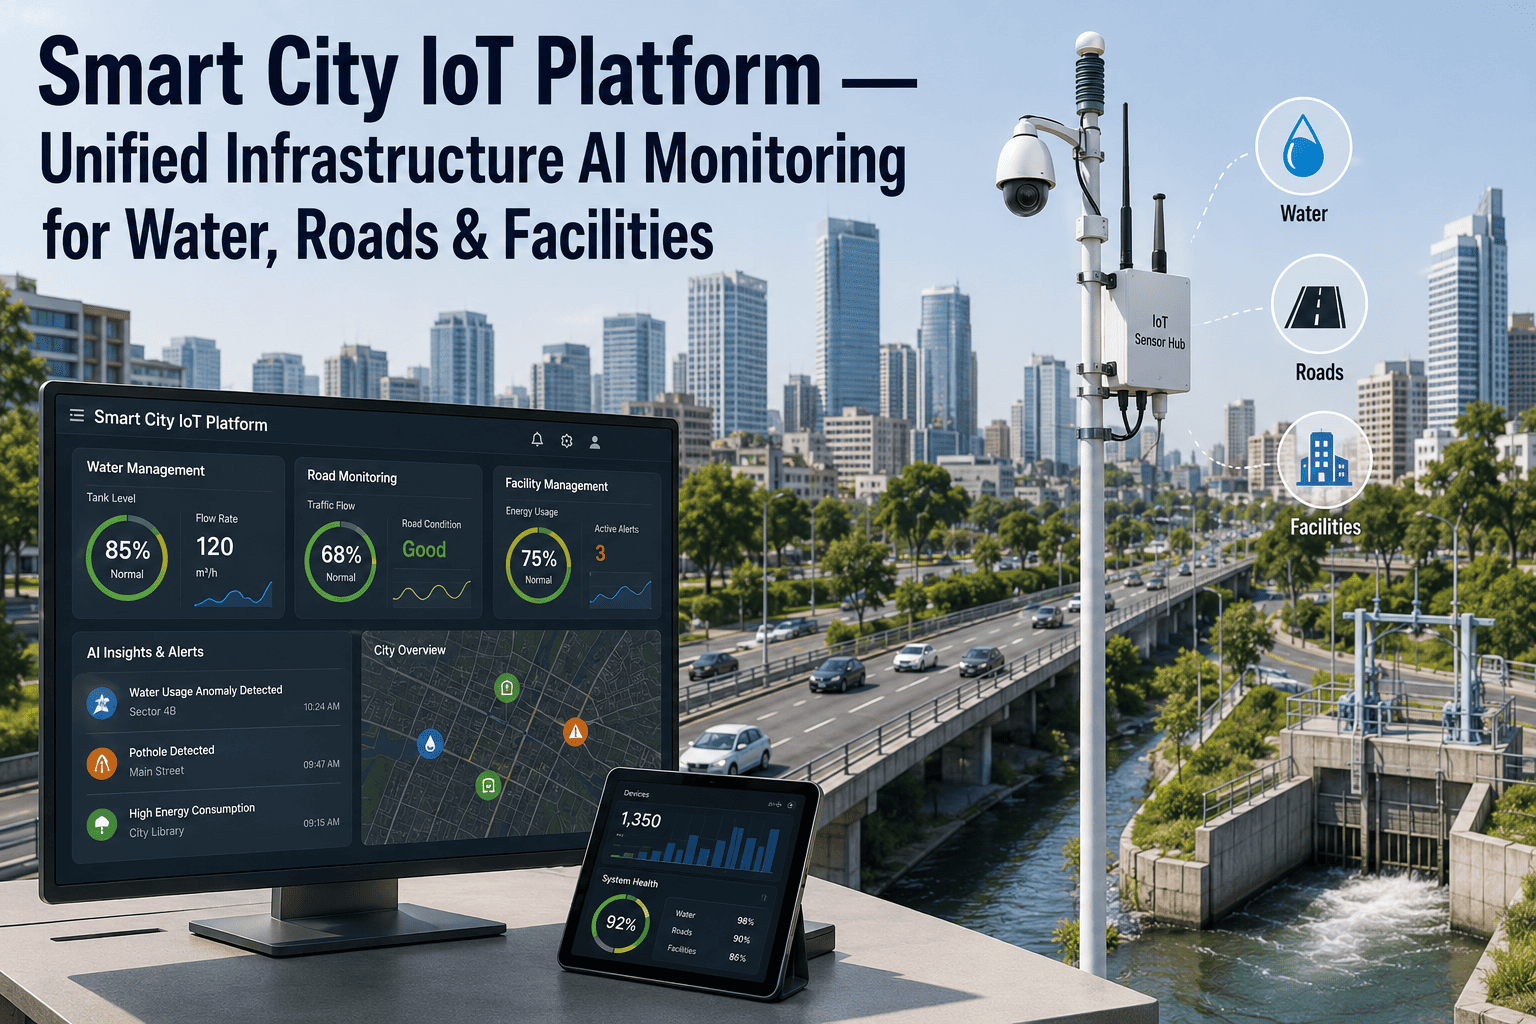
Smart City IoT Platform With Unified Infrastructure AI Monitoring for Water, Roads, and Facilities
Stop switching between five different dashboards to understand what is happening across your city. A unified IoT platform ingests sensor data from every infrastructure domain, normalizes it into a common data model, and runs cross-infrastructure AI analytics that surface the correlations your siloed systems were never designed to detect.
5 to 12
Separate monitoring platforms that a typical mid-size city operates across water, roads, facilities, traffic, lighting, and environmental sensors
73%
Of city operations directors report that cross-department data sharing is the single largest barrier to realizing value from their IoT investments
40%+
Of IoT sensor data collected by cities is never analyzed because it sits in domain-specific systems that lack the analytics capability or cross-referencing context to extract value from it
The Silo Problem
What City Infrastructure Looks Like When Every Department Buys Its Own Monitoring System
The current state of municipal IoT is a collection of independent systems that were each justified and procured to solve a single department's problem. The water department bought a SCADA upgrade. The traffic division deployed a traffic signal management platform. The facilities team installed a building management system across city-owned buildings. Each procurement was rational within its own scope. The collective result is an infrastructure monitoring environment where no single person or system can see the full picture, and where the most valuable insights — the ones that exist in the relationships between domains — are completely invisible.
Water and Wastewater
SCADA Platform
Pressure, flow, level, quality, pump status, valve position
Cannot see road conditions above buried infrastructure, cannot correlate pressure anomalies with construction activity or traffic loading on adjacent road segments
Roads and Traffic
ATMS Platform
Traffic volume, speed, signal timing, detector status, congestion level
Cannot see water main status beneath the road surface, cannot correlate traffic pattern changes with building occupancy or special event schedules in adjacent facilities
Facilities and Buildings
BMS Platform
HVAC status, energy consumption, indoor air quality, equipment faults, occupancy
Cannot correlate energy anomalies with water system performance affecting cooling towers, cannot see whether building usage patterns align with traffic and transit data
Street Lighting
Lighting CMS
Lamp status, energy draw, dimming level, pole location, outage alerts
Cannot correlate lighting outages with crime incident data or pedestrian traffic patterns, cannot link pole-mounted sensor data back to the road or facility domain
The Insight Gap Between Silos
None of these four systems can communicate with each other. A water main break affects road surface conditions, disrupts traffic signals when the repair crew arrives, may require dewatering that affects nearby building foundations, and often requires temporary lighting for night work — but the SCADA system that detects the break, the ATMS that manages the traffic impact, the BMS that monitors the nearby building, and the lighting CMS that provides temporary illumination have no mechanism to share this information or coordinate their response automatically.
Platform Architecture
The Five-Layer Unified IoT Platform Architecture — From Sensor to Coordinated Action
A unified smart city IoT platform does not replace the domain-specific systems that each department depends on for their operational workflows. Instead, it sits above them as an integration and analytics layer that ingests data from all sources, normalizes it into a common model, and runs cross-domain intelligence that no individual system can produce. The following five-layer architecture describes how data moves from physical sensors to coordinated operational response across infrastructure domains.
Layer 1
Sensor and Edge Layer
Physical sensors deployed across water, road, facility, lighting, and environmental domains — pressure transducers, flow meters, traffic detectors, occupancy sensors, energy meters, air quality monitors, and pavement condition sensors. Each sensor generates data in its native protocol: Modbus for water SCADA, NTCIP for traffic signals, BACnet for building systems, DALI for lighting. Edge gateways at each site translate these protocols into a common messaging format before transmission to the platform.
Layer 2
Data Ingestion and Normalization
All incoming data streams are received through protocol adapters that handle the translation from domain-specific formats into a unified time-series data model. Each data point is tagged with its source sensor ID, infrastructure domain, asset identifier, geographic location, measurement type, and timestamp. Data quality rules are applied at ingestion — outlier detection, stale data flagging, and gap filling — so that downstream analytics operate on clean, consistent data regardless of which domain it originated from.
Layer 3
Domain Analytics Engine
Within each infrastructure domain, the platform runs the same analytics that the original domain system provided — pressure trend analysis for water, congestion detection for traffic, energy benchmarking for facilities, and outage detection for lighting. The difference is that these analytics now run on normalized data in a common environment, which means they can reference asset relationships and geographic context that the original systems could not access. A water pressure anomaly can be immediately checked against nearby road construction activity stored in the road domain, something the water SCADA system alone could never do.
Layer 4
Cross-Infrastructure AI Correlation
This is the layer that creates value no siloed system can deliver. AI models analyze relationships between data streams from different infrastructure domains to detect correlations, causal chains, and emerging patterns that span departmental boundaries. The models learn from historical data how events in one domain propagate to other domains — how water main breaks affect traffic patterns, how building energy anomalies correlate with cooling tower water consumption, how street lighting outages correlate with pedestrian incident reports. These cross-domain models generate alerts and insights that no single-department system has the data to produce.
Layer 5
Coordinated Response and Work Order Integration
When a cross-domain event is detected, the platform generates coordinated response actions that are routed to the appropriate departmental systems. A water main break detection triggers a traffic management recommendation in the ATMS, a building impact assessment in the BMS, and a temporary lighting request in the lighting CMS — all from a single event origin. Work orders are created in the city's asset management system with cross-departmental context attached, so the water crew arriving on site knows that the traffic signal at that intersection has already been placed in flash mode and the nearby building has been notified of potential water service interruption.
Cross-Domain Insights
Seven Cross-Infrastructure Correlations That Unified IoT Platforms Detect and Siloed Systems Cannot
Water + Roads
Persistent low-pressure zone in water distribution that overlaps geographically with a cluster of pavement defect reports
Subsurface water loss from a leaking main is undermining the road base, causing pavement settlement and accelerated deterioration. The water SCADA system sees the pressure anomaly but has no road condition data. The pavement management system sees the defects but has no water system data. The unified platform correlates both and flags the intersection as a likely active leak causing infrastructure damage — directing the water crew to investigate a leak that might otherwise go undetected until a catastrophic failure occurs.
Facilities + Water
Building energy consumption increases 30 percent over baseline while cooling tower water consumption decreases 15 percent simultaneously
The cooling tower is not performing effectively, forcing the building's chiller to work harder and consume more electricity to maintain cooling setpoints. The BMS sees the energy increase but does not monitor cooling tower water flow. The water system sees the consumption drop but has no visibility into building energy performance. The unified platform detects the inverse correlation and flags a likely cooling tower performance issue — a diagnosis that neither system could reach independently.
Traffic + Facilities
Traffic volume on a corridor drops 40 percent on weekdays while building occupancy sensors in adjacent facilities show near-zero occupancy
A major employer in the corridor has closed or relocated, but this has not been communicated to the traffic or facilities departments. The traffic system sees reduced volume but does not know why. The facilities system sees empty buildings but does not connect it to traffic patterns. The unified platform flags the correlated anomaly and prompts operations to adjust traffic signal timing for reduced demand and to reassess building HVAC schedules for low-occupancy operation, saving energy and reducing unnecessary road capacity allocation.
Lighting + Roads
Streetlight outages cluster along specific road segments that also show accelerating pavement marking degradation in reflectivity surveys
The road segments with clustered lighting outages are also the segments where pavement marking reflectivity is degrading fastest, suggesting that these segments receive less maintenance attention overall — possibly because they are in areas where maintenance crews have difficulty seeing their work at night due to poor lighting. The unified platform identifies this correlation and flags the segments for a coordinated maintenance intervention that addresses both the lighting and the marking deficiencies in a single crew deployment.
Water + Facilities + Roads
Water main break notification coincides with road closure on the same block and basement flooding alerts from the building management system of an adjacent city-owned facility
This is a three-domain event that requires coordinated response. The water system initiates repair. The road system needs to manage traffic around the excavation. The building system needs to activate sump pumps and assess structural impact. In a siloed environment, these three responses are triggered independently by three different teams who may not know about each other's activities for hours. The unified platform detects the three-domain event, generates a single coordinated incident with all three response tracks, and provides each responding team with visibility into the other teams' actions and timelines.
Environmental + All Domains
Air quality index exceeds threshold in a corridor while traffic volume is elevated and building HVAC systems in the corridor are operating in economizer mode pulling in outside air
High traffic-related pollution combined with buildings actively pulling outside air into occupied spaces creates a public health exposure that no single system detects. The environmental monitor sees the air quality exceedance. The traffic system sees the volume but does not connect it to air quality. The BMS sees economizer mode but does not know about outdoor air quality. The unified platform correlates all three and generates an urgent recommendation to switch affected buildings from economizer to recirculation mode until the air quality event passes — protecting building occupants from an exposure that would otherwise go unaddressed.
Facilities + Lighting + Traffic
After-hours building occupancy spikes at a community center while nearby streetlight energy consumption increases and traffic volume on the access road rises above nighttime baseline
An unscheduled event is occurring at the community center that is drawing unexpected crowds, increasing traffic, and increasing lighting demand in the area. None of the three systems alone can confirm that an event is happening — each sees only its own domain's anomaly. The unified platform correlates the three signals and notifies operations that an unpermitted or uncommunicated event may be occurring, allowing the city to respond proactively rather than discovering the situation through citizen complaints the next day.
Integration Reality
What Actually Has to Happen Technically to Unify City IoT Systems — And Why Most Cities Stall Before They Start
Protocol Translation
Required — Complex
Water SCADA speaks Modbus TCP and OPC-UA. Traffic signals speak NTCIP over serial or SNMP. Building systems speak BACnet/IP. Lighting controllers speak DALI or proprietary wireless protocols. Environmental sensors speak MQTT or HTTP REST. The unified platform must maintain protocol adapters for every data source in the city's IoT portfolio, and each adapter must handle the specific quirks of the vendor's implementation — not just the protocol standard, but the vendor-specific extensions, error handling behaviors, and data rate limitations that differ between manufacturers even within the same protocol.
Data Model Harmonization
Required — High Effort
Each domain system organizes its data according to its own asset model. Water systems model assets as pipes, valves, pumps, and tanks with hydraulic relationships. Traffic systems model intersections, approaches, detectors, and signal phases with timing relationships. Building systems model zones, equipment, points, and schedules with control relationships. The unified platform must map these different asset models into a common spatial and temporal framework where a water pipe, a road segment, and a building footprint can all be referenced as co-located assets that may affect each other. This harmonization is not a technical problem that can be solved with a mapping tool — it requires domain expertise from each department to define the relationship rules.
Geospatial Alignment
Required — Moderate Effort
Cross-domain correlation depends on knowing the geographic relationship between assets in different domains. A water main and a road segment that share a geographic corridor need to be linked in the platform's spatial index so that events on one can be checked against conditions on the other. This requires that each domain's asset data includes accurate geographic coordinates — which is often not the case for legacy infrastructure records where water assets may be mapped to parcel boundaries rather than actual pipe locations and building systems may reference floor plans without external georeferencing.
Temporal Synchronization
Required — Moderate Effort
Different domain systems poll their sensors at different intervals. SCADA systems typically poll every 1 to 5 seconds. Traffic systems poll every 30 seconds to 5 minutes. Building management systems poll every 1 to 15 minutes. Environmental sensors may report every 15 minutes to an hour. Cross-domain correlation requires aligning these different time series onto a common temporal grid so that a water pressure reading at 10:00:03 can be meaningfully compared to a traffic volume reading at 10:00:00 and a building energy reading at 10:00:00. The platform must handle time alignment, interpolation, and latency compensation for each data source.
Security and Access Control
Required — Critical
Each domain system has its own authentication, authorization, and data access policies. The water SCADA system may be on an isolated network with no external connectivity. The building management system may be accessible from the internet with VPN. The unified platform must connect to all of these systems without creating security vulnerabilities in any of them. This typically requires deploying edge gateways in each domain's network that maintain the domain's existing security boundary while exposing a controlled data interface to the unified platform. Cross-domain data sharing must also respect each department's data governance policies — the water department may share pressure data but not pipeline vulnerability assessments with other departments.
Cross-Domain Model Training
Required — Ongoing
The AI correlation models in Layer 4 do not work out of the box. They require historical data from multiple domains to learn the normal correlation patterns and then detect deviations from those patterns. This means the platform must accumulate several months of synchronized multi-domain data before the cross-domain models can begin generating reliable insights. During this training period, the platform provides value through the unified dashboard and domain analytics alone, with cross-domain intelligence activating gradually as the models accumulate sufficient training data. Operations directors should plan for a three to six month model calibration period after full data integration is achieved.
Deployment Phases
Phased Deployment Approach — How Cities Deploy Unified IoT Without Disrupting Existing Departmental Operations
Phase 1
Foundation and Single Domain
Months 1 to 3
Deploy core platform infrastructure and data ingestion layer
Connect the highest-priority domain — typically water or traffic — as the first integrated data source
Configure domain analytics and dashboard for the connected domain
Validate data quality, latency, and reliability before adding additional domains
Outcome: Platform operational with one domain, proving the ingestion and analytics pipeline before expanding scope
Phase 2
Multi-Domain Integration
Months 3 to 6
Connect remaining infrastructure domains through protocol adapters and edge gateways
Harmonize asset models and geospatial references across all connected domains
Configure domain analytics for each newly connected domain
Begin cross-domain data accumulation for model training
Outcome: All domains ingesting data into unified platform; single dashboard replacing multiple domain-specific views
Phase 3
Cross-Domain AI Activation
Months 6 to 9
Train and validate cross-domain correlation models on accumulated multi-domain data
Configure cross-domain alert rules and correlation thresholds with operations team input
Integrate with city work order and asset management systems for coordinated response
Tune model sensitivity to balance detection rate against alert fatigue
Outcome: Cross-domain insights actively generating alerts and coordinated response actions across departmental boundaries
Phase 4
Optimization and Expansion
Months 9 to 12+
Refine models based on operations team feedback and confirmed correlation accuracy
Add new sensor types and data sources as the city expands its IoT deployment
Develop predictive capabilities — forecasting cross-domain failure propagation before it occurs
Generate ROI documentation linking platform insights to avoided costs and operational improvements
Outcome: Mature cross-domain intelligence platform with demonstrated ROI and a scalable framework for continued IoT expansion
Deployment Case
City of 340,000 Unified Water, Road, and Facility Monitoring — Reduced Cross-Department Incident Response Time by 62%
A city of approximately 340,000 residents had been operating separate monitoring systems for water distribution, traffic management, and city facility buildings for over eight years. The water department's SCADA system monitored 420 miles of water mains and 28 pump stations. The traffic division's ATMS managed 340 signalized intersections. The facilities department's BMS monitored 42 city-owned buildings including fire stations, community centers, libraries, and administrative offices. Operations directors and city management had been requesting a unified view for years, but each attempt to integrate the systems had stalled on protocol incompatibility, data model conflicts, and inter-departmental data governance disagreements. The city deployed a unified IoT platform using an edge gateway architecture that connected to each domain system through dedicated protocol adapters without requiring any changes to the existing SCADA, ATMS, or BMS configurations. The water domain was connected first, followed by traffic at month four and facilities at month five. Cross-domain model training began at month six using the accumulated multi-domain dataset. By month nine, the platform was actively generating cross-domain alerts. The most impactful early finding was the correlation between water main breaks and traffic signal failures at the same intersections — the platform identified that 14 of the 23 signal failures in the previous two years had occurred within 48 hours of a water main repair at the same intersection, suggesting that excavation vibration during water repairs was damaging signal detector loops. This correlation, which had never been visible when the systems were separate, led to a procedural change requiring traffic division inspection of detector loops after any water main repair within an intersection. In the twelve months after this change was implemented, intersection-related signal failures dropped by 40 percent. Overall cross-department incident response time — measured from the initial event detection to the point where all affected departments were notified and had acknowledged the event — decreased from an average of 4.2 hours to 1.6 hours, a 62 percent reduction driven primarily by the elimination of the manual notification chain that previously connected departments.
62%
Reduction in cross-department incident response time after platform deployment
40%
Drop in intersection signal failures after cross-domain finding led to procedural change
3 Domains
Water, traffic, and facilities fully integrated into unified platform within 5 months
14 of 23
Previous signal failures correlated with water main repairs — a pattern invisible in siloed systems
Your City Is Collecting Data From Every Infrastructure Domain but Analyzing Each One in Isolation. The Value Is in the Connections Between Domains, and Your Siloed Systems Cannot See Them.
iFactory deploys unified smart city IoT platforms that connect your water, road, facility, lighting, and environmental monitoring systems into a single AI-powered analytics layer — surfacing cross-infrastructure correlations that drive coordinated response, reduce incident duration, and demonstrate measurable ROI from your IoT investments.
Operational Metrics
What Operations Directors Track After Deploying a Unified Smart City IoT Platform
Single Pane
Replaced 5 to 12 Domain Dashboards With One Unified View
Operations directors and their teams no longer log into separate systems to monitor different infrastructure domains. The unified dashboard provides a single entry point for all infrastructure status, with the ability to filter by domain, geographic area, asset type, or alert severity. This consolidation saves an estimated 45 to 90 minutes per shift per operations staff member in system switching and context rebuilding time.
Per Month
Cross-Domain Alerts Generated
After the model calibration period, the platform generates a measurable volume of cross-domain alerts per month — typically 15 to 50 for a mid-size city, depending on infrastructure density and event frequency. Each alert represents a correlation that would not have been detected by any individual domain system, and each is tracked through resolution to measure its operational value and refine model accuracy over time.
Hours Saved
Faster Cross-Department Coordination Per Incident
The automated cross-domain notification eliminates the manual phone calls, emails, and radio traffic that previously connected departments during multi-domain events. Most cities measure a 50 to 65 percent reduction in the time from initial event detection to full cross-department awareness, which directly translates to faster response initiation and reduced incident duration for events that affect multiple infrastructure systems simultaneously.
Documented
IoT Investment ROI With Cross-Domain Value Attribution
The platform tracks the operational impact of each cross-domain insight — the avoided cost, the reduced response time, the prevented equipment failure — and attributes that value to the unified platform investment. This ROI documentation is typically the first defensible evidence that the city's aggregate IoT spending is producing measurable return, because it captures value that was previously invisible in the gap between domain-specific systems.
Frequently Asked Questions
Unified Smart City IoT Platforms — What Operations Directors Ask Before Deployment
Does deploying a unified platform mean we have to replace our existing SCADA, traffic, and building management systems?
No. The unified platform is designed to integrate with existing domain systems, not replace them. Your water SCADA system continues to perform its real-time control and monitoring functions. Your traffic management system continues to operate signal timing and detector logic. Your building management system continues to control HVAC and lighting. The unified platform connects to these systems through read-only data interfaces — it ingests the data that each system produces without interfering with their operational control functions. The domain systems remain the system of record for their respective operational workflows. The unified platform adds a cross-domain analytics and coordination layer on top of the existing stack, which means your departments do not need to change how they operate on a day-to-day basis — they gain an additional intelligence layer without losing any existing capability.
Contact support to discuss integration with your specific domain systems.
How do we handle the data governance and access control challenges when multiple departments are contributing data to a shared platform?
The platform implements role-based and domain-based access control that allows each department to maintain control over who can see their data and at what granularity. The water department can configure their data so that pressure and flow readings are visible to all platform users for cross-domain correlation purposes, but detailed pipeline vulnerability assessments or critical infrastructure location data are restricted to authorized water department personnel only. Each data point in the platform carries metadata tags that define its access classification, and the platform enforces these classifications at query time so that cross-domain analytics can use the data for correlation without exposing restricted details to unauthorized users. The governance framework is configured during the Phase 1 deployment and refined as additional domains are connected, with each department defining their own data sharing rules before their data becomes visible to other platform users.
Book a Demo to review the data governance configuration options.
What happens if one of our domain systems goes down — does the unified platform lose visibility into that entire infrastructure domain?
If a domain system goes offline, the unified platform loses access to the real-time data stream from that system but retains the last-received data and all historical data in its own data store. The platform detects the data interruption, flags the affected domain as having stale data in the dashboard, and continues to operate cross-domain analytics for the remaining active domains using the most recent data from the offline domain as a baseline reference. When the domain system comes back online, the platform automatically resumes data ingestion, identifies any data gaps that occurred during the outage, and can optionally backfill those gaps if the domain system buffers data during its own outage. The platform does not depend on any single domain system being continuously available — it degrades gracefully by reducing its cross-domain capability for the affected domain while maintaining full functionality for all other domains.
Contact support to discuss fault tolerance architecture for your deployment.
Our city has IoT sensors from six different manufacturers across our infrastructure domains. How does the platform handle sensor hardware diversity without creating a vendor lock-in situation?
The platform's integration architecture is designed around protocol-level adapters rather than vendor-specific integrations, which means it connects to sensors based on the communication protocol they use rather than who manufactured them. A pressure sensor from Manufacturer A and a pressure sensor from Manufacturer B that both communicate via Modbus TCP are handled by the same protocol adapter with manufacturer-specific configuration profiles that account for differences in register mapping and data formatting. If the city later replaces sensors from one manufacturer with sensors from another, the platform configuration is updated to reflect the new register mappings but the overall integration architecture does not change. The platform also supports standard IoT protocols like MQTT and OPC-UA that are increasingly common in modern sensor hardware, making future sensor additions progressively easier to integrate regardless of manufacturer. This protocol-based approach means the city is never locked into a specific sensor vendor by the platform — they can procure the best sensor for each application and the platform will adapt to it.
Book a Demo to review protocol adapter coverage for your sensor portfolio.
What is the realistic total cost of a unified IoT platform deployment for a mid-size city, and how does that compare to continuing to operate separate systems?
For a city of 100,000 to 500,000 population with water, traffic, and facility monitoring systems already in place, the total deployment cost for a unified platform typically ranges from $250,000 to $800,000 depending on the number of domains, the number of data points per domain, the complexity of protocol translation required, and the level of cross-domain model customization needed. This is a one-time deployment cost with an ongoing annual platform and support cost of 15 to 25 percent of the initial deployment cost. Against this, the ongoing cost of operating separate systems includes redundant licensing, redundant infrastructure, and — most significantly — the hidden cost of the insight gap between systems: missed cross-domain correlations, slower multi-department incident response, and the inability to demonstrate ROI on the aggregate IoT investment. Cities that have deployed unified platforms report that the operational savings from faster incident response, avoided equipment damage through early cross-domain detection, and reduced manual coordination effort typically offset the platform cost within 18 to 36 months, with the cross-domain insights themselves representing ongoing value that increases as the models improve with more data.
Contact support for a deployment cost estimate specific to your city's infrastructure portfolio.
Your City Is Investing in IoT Sensors Across Every Infrastructure Domain. The Platform That Connects Those Domains Is Where the Actual Return on That Investment Is Realized.
Deploy a unified smart city IoT platform that turns your collection of departmental monitoring systems into a single cross-infrastructure intelligence capability — with AI-powered correlation, coordinated response, and documented ROI that justifies every sensor you have deployed.