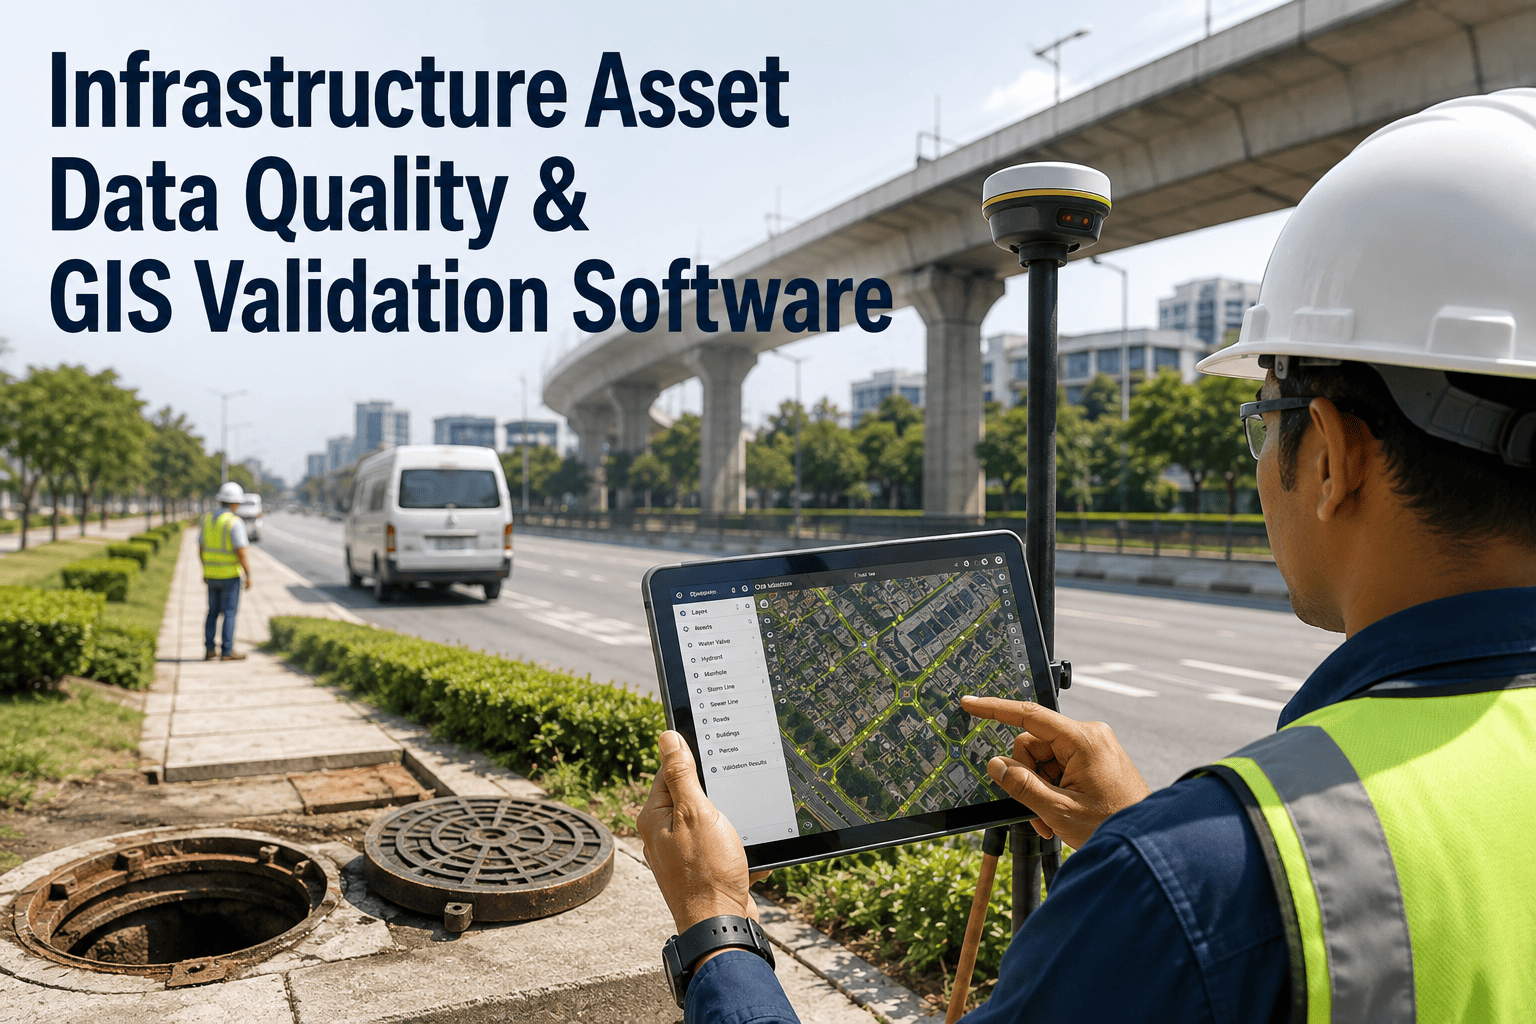
Every road, bridge, and building in public ownership is graded — and every grade drives a budget decision. A bridge with a National Bridge Inventory (NBI) deck rating of 4 jumps the rehabilitation queue. A road with a Pavement Condition Index (PCI) under 55 triggers a resurfacing programme. A building with a Facility Condition Index (FCI) above 0.10 enters the "poor" tier and competes for capital. The problem is not the standards — they are well-defined, internationally accepted, and built into systems like AASHTOWare Bridge Management (Pontis). The problem is that the grading process has always depended on a human inspector walking the asset, scoring distresses against a written rubric, and entering numbers into a spreadsheet. The result: a typical state DOT inspects every bridge once every two years, every road every three to five years, and every building every five-plus. The grade you act on can be three years out of date by the time the work order is raised. Automated infrastructure grading rewrites the timeline. Deep-learning models trained on inspection imagery now detect, classify, measure, and grade every visible distress at the speed the imagery is captured — and feed the resulting condition index straight into the bridge management or pavement management system without a human re-keying anything. Published research demonstrates 95% crack-detection accuracy and 90% width-estimation accuracy, producing automated PCI ratings aligned with the FHWA standard. Asset owners that schedule a demo are finding the grading bottleneck collapse: a network that took 18 months to grade by hand is graded in under a month by AI, with consistency that no inspector pool can match. This article walks through how automated infrastructure grading actually works — the condition indices, the deep-learning models, the data-to-decision pipeline, and the realistic accuracy benchmarks every infrastructure owner should ask for.
Stop Grading by Inspector. Start Grading by Algorithm.
iFactory automates condition-index calculation from inspection imagery and sensor data — purpose-built for DOTs, bridge owners, pavement engineers, water utilities, and facility managers who need every asset graded current, every quarter.
95%
Crack Detection Accuracy in Automated PCI Pipelines
90%
Crack Width Estimation Accuracy Aligned to FHWA Standard
0–9 / 0–100
Native NBI & PCI Scale Outputs Ready for Asset Registers
18→1 mo
Network Grading Cycle Compressed From 18 Months to ~1 Month
1. The Grading Bottleneck Every Infrastructure Owner Hits
Condition grading is the single piece of asset management that touches every other process. The grade drives the renewal queue, the budget request, the regulatory submission, and the political conversation about where the money goes. Yet for decades, every grade in the asset register has come from the same place: a human inspector with a clipboard, a written rubric, and roughly an hour per bridge component or kilometre of pavement to score it. Traditional manual PCI assessment is constrained by labour intensity, subjectivity, and susceptibility to human error. Different inspectors score the same surface with measurable variance. Inspector fatigue degrades accuracy after the fourth hour of a shift. And by the time the score reaches the asset register, the surface itself has continued degrading.
The bottleneck has a knock-on effect that asset owners feel everywhere. Bridge inspection cycles run 24 months in most jurisdictions; pavement inspection cycles run three to five years. Decisions about which kilometre of road to resurface this fiscal year are being made on data three years old. Automated grading collapses that gap. Deep-learning models trained on inspection imagery now detect and grade every visible distress at the speed the data is captured — and feed the resulting standard-aligned condition index directly into the asset register without a human re-keying anything. Asset teams that book a demonstration see live PCI and NBI calculation running on their own inspection archive.
2. The Condition Indices AI Actually Outputs
Automated grading is only operationally useful if the output matches the standard the asset register already speaks. Modern AI pipelines produce native outputs for the five condition indices that dominate global infrastructure management.
0–100
Pavement Condition Index (PCI)
FHWA-aligned roadway score. 100 = perfect surface; under 55 typically triggers resurfacing. Calculated from crack density, severity, width, and area of distress per segment.
0–9
NBI Component Ratings
FHWA bridge inventory. Separate 0–9 grades for deck, superstructure, and substructure. 9 = excellent; 4 = poor; 0 = closed. The "1" grade is intentionally not used.
0–100
Bridge Sufficiency Rating
FHWA composite of structural condition, geometric obsolescence, and importance. Below 50 qualifies a bridge for federal rehabilitation funding in the United States.
Ratio
Facility Condition Index (FCI)
Building condition. Ratio of repair-needs to current replacement value. Good < 0.05; Fair 0.05–0.10; Poor > 0.10. Used heavily by university estates and federal portfolios.
1–5
PACP / MSCC5 Severity
Sewer and drainage condition. NASSCO PACP in North America, WRc MSCC5 in the UK. Each visible defect graded 1–5 for severity; aggregated to pipe segment score.
3. The Deep Learning Models Doing the Grading
Automated grading is not a single model — it is a stack of three coordinated models running in sequence. Detection identifies every distress in the inspection imagery: cracks, potholes, spalls, joint defects, corrosion. Modern pipelines use YOLOv8 for real-time pavement crack detection and Mask R-CNN for higher-accuracy per-pixel segmentation on bridge imagery. Measurement quantifies the detected distress: crack width via segmentation-based skeleton algorithms (achieving 90% accuracy in published research), crack length via pixel-to-real-world calibration, defect area via instance segmentation. Grading applies the standard rubric to the measurements: PCI from the FHWA deduct-value curves, NBI ratings from component-condition trees, FCI from cost ratios.
The validated PCI pipeline above demonstrates 95% accuracy in crack detection and 90% accuracy in crack width estimation, producing automated PCI ratings aligned with standards. Multimodal large language models (MLLMs) are the current research frontier, evaluated across five performance dimensions — response rate, response correctness, consistency, multimodal error, and overall — using prompts that identify defect type and quantity, describe spatial patterns, assess severity, and judge maintenance urgency. The output is not a probability; it is a number the asset register can store and the work-order system can act on. Asset teams that book a strategy session see the full detect-measure-grade stack running on their own inspection imagery.
4. From Raw Inspection Data to Funded Decision — The Six-Stage Pipeline
Automated infrastructure grading runs as a six-stage automated chain. The asset engineer enters only at the prioritisation and budget-approval step — every prior stage runs autonomously, with standard-aligned grades flowing into the bridge or pavement management system without manual re-keying.
01
Inspection Data Capture
UAV imagery, vehicle-mounted survey, CCTV crawler, fixed camera, and IoT sensor feeds ingested in their native formats. No re-capture required.
02
Distress Detection
YOLOv8 and Mask R-CNN locate every crack, pothole, spall, and joint defect at pixel level with confidence scores. 95% accuracy reported in published research.
03
Distress Measurement
Skeleton algorithm estimates crack width to 90% accuracy. Length, area, and severity quantified per defect against calibrated pixel-to-mm scale.
04
Standard-Aligned Grading
PCI deduct values, NBI component scores, FCI ratios, and PACP severity grades calculated from the measured distresses per the published standard.
05
Deterioration Forecast
Markovian decision-process models (as used by Pontis/AASHTOWare) project current grade forward, supporting capital planning and project sequencing.
06
EAM & Decision Push
Grades and forecasts pushed to AASHTOWare, IBM Maximo, SAP PM, Cityworks, and Bentley AssetWise with full visual evidence trail.
5. The Decision Outputs Asset Managers Actually Get
A grading number on its own is not a decision. The output that drives action is the grade plus its decision-support context: how this asset compares to its peers, where it sits on its expected deterioration curve, what the cost of action versus inaction looks like, and which budget category it lands in. Modern automated grading platforms produce six decision-grade outputs from each grading run — each one designed to land directly in the workflow it informs.
Output 01
Current Condition Score
PCI, NBI, FCI, or PACP grade for each asset, with the underlying distress inventory and visual evidence attached. Direct ingestion into the asset register.
Output 02
Peer Comparison & Ranking
Where this asset sits in the network distribution — top quartile, bottom quartile, outliers. The chart that frames every budget conversation.
Output 03
Deterioration Trajectory
Markovian projection of the current grade forward 5, 10, 20 years. Identifies which asset will fall below the action threshold and when.
Output 04
Recommended Intervention
From the grade and the deterioration curve, the cost-optimal action — patch, rehabilitate, replace, or no action — with estimated cost band.
Output 05
Budget & Programme Optimisation
Portfolio-wide cost-benefit ranking against a budget envelope. Which projects clear the most condition liability per dollar spent.
Output 06
Regulatory Submission Pack
Pre-formatted FHWA, AASHTO, or national-equivalent submissions, with the source-image evidence trail attached for audit and dispute resolution.
6. Realistic Accuracy & Performance Benchmarks
Published research and field validation consistently report the following ranges. Performance depends on imagery quality, distress visibility, and the maturity of the chosen architecture.
| Grading Task |
Architecture |
Metric |
Reported Range |
| Pavement crack detection |
YOLOv8 + skeleton algorithm |
Detection accuracy |
95% |
| Crack width estimation |
Segmentation-based skeleton |
Measurement accuracy |
90% |
| Automated PCI rating |
End-to-end deep learning pipeline |
Alignment with FHWA standard |
Standards-compliant output |
| Multimodal condition assessment |
Multimodal LLMs with 39 prompts |
Five performance dimensions |
Active research frontier |
| Network grading throughput |
Automated vs manual pipeline |
Cycle time compression |
~18× faster |
| Inter-grader consistency |
AI vs paired human inspectors |
Score variance |
Substantially lower |
7. Five Deployment Realities Asset Owners Hit on Day One
01
Standards compliance is the only thing that matters
A grade in a vendor-specific format that does not round-trip to PCI, NBI, FCI, or PACP is operationally useless. Any AI grading output must land in the standard the asset register, the regulator, and the funding agency already use.
02
The certified inspector is the standards authority, not the bottleneck
AI does not replace certified bridge or pavement inspectors. The mature workflow has the inspector validate AI-flagged distresses, resolve edge cases, and sign off on the grade — focusing their judgment where it adds the most value, not on routine crack counting.
03
Image quality dominates accuracy
Lower-resolution archive imagery limits how fine a crack the AI can detect, regardless of model. The largest single accuracy gain in most programmes comes from standardising capture geometry, resolution, and lighting — not from a more sophisticated model.
04
Visible defects are not the whole grade
PCI catches surface distress, but pavement strength and subgrade condition need falling-weight deflectometer or ground-penetrating radar. NBI superstructure ratings consider load capacity that no image can show. AI grading is the visual layer of a broader inspection programme — never the whole programme.
05
Integration determines operational value
Grades that do not reach AASHTOWare, IBM Maximo, Cityworks, or SAP PM in usable form are an unfinished system. Bidirectional integration with the customer's bridge or pavement management system is the largest portion of any real deployment.
Automated Infrastructure Grading — Frequently Asked Questions
Tap any question to reveal the answer.
Will AI-graded outputs satisfy FHWA, AASHTO, or our national regulator?+
Yes — production automated grading pipelines output native FHWA-aligned PCI scores, NBI 0–9 component ratings, sufficiency ratings, FCI ratios, and PACP/MSCC5 severity grades. The defect taxonomy, severity scale, deduct-value calculations, and reporting formats all match the published standard. For audit and dispute resolution, certified inspectors remain in the loop on flagged calls — the AI provides the productivity layer, the inspector remains the standards authority. This combined human-plus-AI approach is increasingly the accepted best practice in major DOT and regulator tender specifications.
Book a demo to see standard-aligned outputs from your own inspection archive.
How accurate is automated grading compared to a certified human inspector?+
Published research demonstrates 95% accuracy in pavement crack detection and 90% accuracy in crack width estimation in validated end-to-end PCI pipelines. On the major distress classes — cracks, potholes, spalls, joint defects, corrosion — modern deep learning achieves agreement with certified inspectors at or above the agreement two independent inspectors reach with each other. The AI's strongest advantage is consistency: it scores identically across an entire network, eliminating the inter-inspector variance that historically forced standards bodies to publish coding interpretation guides. Accuracy is lower on rare or visually ambiguous distresses, which is precisely why the certified inspector remains in the workflow for validation.
What inspection data formats can the AI grade?+
Modern grading pipelines ingest most inspection data formats already in use: UAV-captured aerial imagery for bridges, dams, and large structures; vehicle-mounted line-scan and area-scan imagery for pavement surveys; CCTV crawler footage for sewers and drainage; fixed-camera imagery for static asset monitoring; smartphone-captured imagery for facility condition assessment; and 3D LiDAR point clouds for geometric measurement. Each format goes through the same detect–measure–grade pipeline; the underlying models are tuned to the imagery characteristics. Archive footage from earlier inspection cycles is supported for trend analysis, so historical baselines remain useful as the system rolls out.
How quickly can a network actually be graded versus the manual process?+
The throughput improvement is substantial. A typical state DOT inspects every bridge once every 24 months and every road every three to five years under manual processes — the cycle is dictated by inspector availability, not by what the asset needs. Automated grading runs at the speed the imagery is captured, with downstream processing typically completing within hours to days per camera-hour of footage. A network that took 18 months to grade by hand can be graded in roughly one month with AI, including the time for certified-inspector validation of flagged calls. The downstream effect is what asset owners care about: budget decisions made on current data, not on data three years stale.
Does this replace our existing bridge or pavement management system?+
No — and any vendor claiming it will is overselling. Pontis / AASHTOWare Bridge Management, IBM Maximo, SAP PM, Cityworks, and Bentley AssetWise are the platforms your team already uses for capital planning, work-order management, and regulatory submission. Automated grading is the data layer that feeds them — replacing the manual coder step in the grading workflow, not the management system that consumes the grades. Production deployments are explicitly designed to integrate via REST APIs and standard exchange formats, pushing condition indices and supporting evidence directly into the platform of record without disrupting the workflows built around it.
How does iFactory integrate with our asset register and EAM?+
iFactory connects natively to the asset-management platforms infrastructure owners already run — AASHTOWare Bridge Management, IBM Maximo, SAP PM, Cityworks, Innovyze, Bentley AssetWise, Infor EAM, and equivalent national platforms — via standard REST APIs. Graded outputs flow with their condition index value (PCI, NBI rating, FCI, PACP severity), confidence score, deterioration forecast, recommended intervention, annotated visual evidence, and supporting distress inventory directly into the asset record. Regulatory submission packs export in FHWA, AASHTO, or national-equivalent format. The platform layers on top of your existing inspection and management stack — no rip-and-replace, with typical integration completed in 4–8 weeks.
Grade Every Asset, Every Quarter. Decide From Current Data, Not Stale Data.
iFactory orchestrates detect–measure–grade pipelines across pavements, bridges, buildings, and sewers — pushing PCI, NBI, FCI, and PACP outputs straight to AASHTOWare, Maximo, SAP PM, and Cityworks. Built for asset owners who need current grades, not historical ones.